
Journal of Resources and Ecology >
Spatial Behavior Characteristics of Land Use based on Fractal Theory: Taking Poyang Lake Area as an Example
Received date: 2020-09-30
Accepted date: 2020-12-28
Online published: 2021-05-30
Supported by
The National Natural Science Foundation of China(41961035)
The Natural Science Foundation in Jiangxi Province(20202BAB213014)
The China Postdoctoral Science Foundation(2020M682106)
Landscape morphology can reflect the spatial behavior of land use. Using the Poyang Lake area as an example, the landscape pattern characteristics in 1995, 2000, 2015, and 2018 are determined by calculating the fractal dimension, fractal stability, patch density, patch shape fragmentation, and landscape isolation, and fractal theory is used to analyze the spatial behavior of land use. The results show that building land was the land use type which consistently had the highest fractal dimension, but the fractal dimension of building land shows a downward trend, indicating that the spatial form of building land gradually developed in an orderly direction under the action of land use spatial behavior. Paddy, dryland, and forested land were the land use types which always had the lowest fractal dimension, and they are in unstable states. The calculation results of patch density, patch shape fragmentation index, and landscape isolation index supported the conclusions of the fractal analysis. One recommendation for realizing the rational layout of the land is to reduce the fractal dimension of building land through scientific and reasonable planning and to guide the orderly development of building land. For natural landscapes such as forested land, shrub forest land, high-coverage grassland, and water area, their fractal dimensions should be increased to reduce human interference and maintain their stability. Finally, the results of this study suggest that the fractal dimension should be introduced into the National Spatial Planning, and used as an index for evaluating the rationality of the regional land use pattern.
Key words: land use; fractal theory; landscape pattern; Poyang Lake area
HE Yafen . Spatial Behavior Characteristics of Land Use based on Fractal Theory: Taking Poyang Lake Area as an Example[J]. Journal of Resources and Ecology, 2021 , 12(2) : 192 -202 . DOI: 10.5814/j.issn.1674-764x.2021.02.006
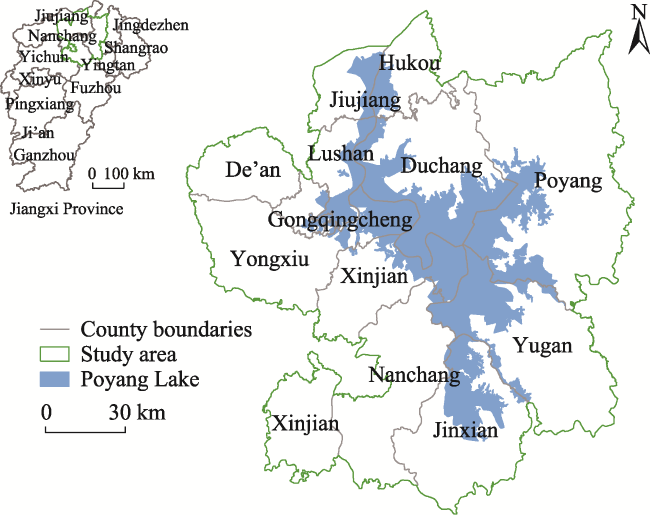
Fig. 1 Location of Poyang Lake area |
Table 1 Land use type areas and composition ratios in 1995, 2005, 2015 and 2018 |
| Land type | 1995 | 2005 | 2015 | 2018 | ||||
|---|---|---|---|---|---|---|---|---|
| Area (km2) | Percentage (%) | Area (km2) | Percentage (%) | Area (km2) | Percentage (%) | Area (km2) | Percentage (%) | |
| Paddy | 6972.09 | 35.34 | 6827.96 | 34.61 | 6788.04 | 34.40 | 6743.68 | 34.18 |
| Dryland | 1991.61 | 10.09 | 1955.08 | 9.91 | 1912.14 | 9.69 | 1873.38 | 9.49 |
| Forested land | 2707.73 | 13.72 | 2749.59 | 13.94 | 2901.73 | 14.71 | 2884.44 | 14.62 |
| Shrub forest land | 895.04 | 4.54 | 870.69 | 4.41 | 775.95 | 3.93 | 774.94 | 3.93 |
| Sparse forest land | 1326.84 | 6.72 | 1286.09 | 6.52 | 1143.53 | 5.80 | 1127.08 | 5.71 |
| Other forest land | 27.18 | 0.14 | 34.14 | 0.17 | 36.52 | 0.19 | 36.24 | 0.18 |
| High-coverage grassland | 354.35 | 1.80 | 331.52 | 1.68 | 299.40 | 1.52 | 298.79 | 1.51 |
| Low-medium-coverage grassland | 345.33 | 1.75 | 350.22 | 1.77 | 321.80 | 1.63 | 320.98 | 1.63 |
| Water | 4609.34 | 23.36 | 4708.54 | 23.86 | 4676.89 | 23.70 | 4670.10 | 23.67 |
| Building land | 498.39 | 2.53 | 614.71 | 3.12 | 873.40 | 4.43 | 1000.76 | 5.07 |
| Unused land | 3.10 | 0.02 | 2.48 | 0.01 | 1.61 | 0.01 | 0.60 | 0 |
| Total | 19731.00 | 100.00 | 19731.00 | 100.00 | 19731.00 | 100.00 | 19731.00 | 100.00 |
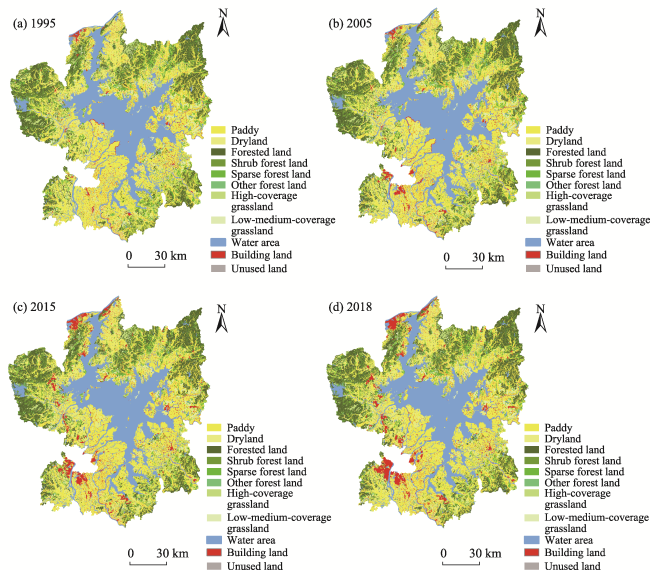
Fig. 2 The trends of land use change in the Poyang Lake area in 1995, 2005, 2015, and 2018. |
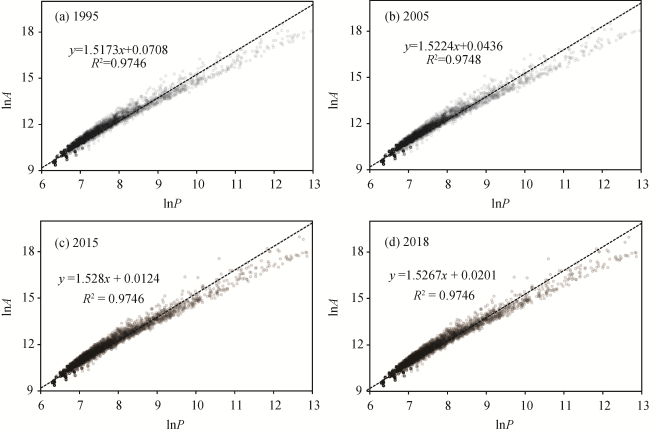
Fig. 3 Scatter diagrams of the area and perimeter of paddy after taking logarithm in Poyang Lake area in 1995, 2005, 2015, and 2018. |
Table 2 Regression equations and related statistics of the fractal calculations of various land use types in Poyang Lake area in 1995, 2005, 2015, and 2018. |
| Land type | Year | Regression equation | Number of samples |
|---|---|---|---|
| Paddy | 1995 | lnA = 0.0708+1.5173lnP (R2=0.9746) | 7860 |
| 2005 | lnA = 0.0436+1.5224lnP (R2=0.9748) | 8034 | |
| 2015 | lnA = 0.0124+1.528lnP (R2=0.9746) | 8115 | |
| 2018 | lnA = 0.0201+1.527lnP (R2=0.9746) | 7987 | |
| Dryland | 1995 | lnA = ‒0.2253+1.5802lnP (R2=0.9729) | 5975 |
| 2005 | lnA = ‒0.2253+1.5805lnP (R2=0.9728) | 6061 | |
| 2015 | lnA = ‒0.2909+1.5905lnP (R2=0.9728) | 6093 | |
| 2018 | lnA = ‒0.2872+1.5901lnP (R2=0.9726) | 5960 | |
| Forested land | 1995 | lnA = ‒0.2403+1.5828lnP (R2=0.9741) | 4415 |
| 2005 | lnA = ‒0.2168+1.5799lnP (R2=0.9742) | 4461 | |
| 2015 | lnA = ‒0.2295+1.5822lnP (R2=0.974) | 4501 | |
| 2018 | lnA = ‒0.2244+1.5816lnP (R2=0.974) | 4432 | |
| Shrub forest land | 1995 | lnA = ‒0.2971+1.5902lnP (R2=0.9766) | 2221 |
| 2005 | lnA = ‒0.305+1.5915lnP (R2=0.977) | 2244 | |
| 2015 | lnA = ‒0.4031+1.6055lnP (R2=0.9763) | 2236 | |
| 2018 | lnA = ‒0.4098+1.6065lnP (R2=0.9765) | 2237 | |
| Sparse forest land | 1995 | lnA = ‒0.7041+1.6497lnP (R2=0.9733) | 5692 |
| 2005 | lnA = ‒0.7117+1.6514lnP (R2=0.9729) | 5629 | |
| 2015 | lnA = ‒0.7388+1.6564lnP (R2=0.9687) | 5472 | |
| 2018 | lnA =‒0.7429+1.657lnP (R2=0.9725) | 5394 | |
| Other forest land | 1995 | lnA = ‒0.2654+1.6039lnP (R2=0.9599) | 136 |
| 2005 | lnA = ‒0.6172+1.6533lnP (R2=0.9632) | 183 | |
| 2015 | lnA = ‒1.1316+1.7234lnP (R2=0.9482) | 189 | |
| 2018 | lnA = ‒1.1228+1.7226lnP (R2=0.9657) | 187 | |
| High-coverage grassland | 1995 | lnA = ‒0.4133+1.612lnP (R2=0.9754) | 765 |
| 2005 | lnA = 0.4389+1.6152lnP (R2=0.9754) | 836 | |
| 2015 | lnA = ‒0.4624+1.6209lnP (R2=0.9639) | 843 | |
| 2018 | lnA = ‒0.4662+1.6214lnP (R2=0.975) | 842 | |
| Low-medium-coverage grassland | 1995 | lnA = ‒0.3172+1.6076lnP (R2=0.972) | 538 |
| 2005 | lnA = ‒0.3962+1.6166lnP (R2=0.9735) | 559 | |
| 2015 | lnA = ‒0.3234+1.608lnP (R2=0.9736) | 575 | |
| 2018 | lnA = ‒0.3298+1.609lnP (R2=0.9736) | 576 | |
| Water area | 1995 | lnA = ‒0.5243+1.6132lnP (R2=0.9736) | 3900 |
| 2005 | lnA = ‒0.4799+1.6066lnP (R2=0.9746) | 3884 | |
| 2015 | lnA = ‒0.5465+1.6177lnP (R2=0.9749) | 3920 | |
| 2018 | lnA = ‒0.5443+1.6173lnP (R2=0.9749) | 3898 | |
| Building land | 1995 | lnA = ‒1.3431+1.7532lnP (R2=0.9506) | 5303 |
| 2005 | lnA = ‒1.2109+1.7339lnP (R2=0.9536) | 5300 | |
| 2015 | lnA = ‒1.2066+1.7333lnP (R2=0.9592) | 5325 | |
| 2018 | lnA = ‒1.2675+1.7422lnP (R2=0.961) | 5288 |
Table 3 Comparison of fractal dimensions and stabilities of various land use types in the Poyang Lake area in 1995, 2005, 2015 and 2018. |
| Land type | Fractal dimension | Stability index | Stability ranking | |||||||||
|---|---|---|---|---|---|---|---|---|---|---|---|---|
| 1995 | 2005 | 2015 | 2018 | 1995 | 2005 | 2015 | 2018 | 1995 | 2005 | 2015 | 2018 | |
| Building land | 1.753 | 1.734 | 1.733 | 1.742 | 0.253 | 0.234 | 0.233 | 0.242 | 1 | 1 | 1 | 1 |
| Sparse forest land | 1.650 | 1.651 | 1.656 | 1.657 | 0.150 | 0.151 | 0.156 | 0.157 | 2 | 3 | 3 | 3 |
| High-coverage grassland | 1.612 | 1.615 | 1.620 | 1.621 | 0.112 | 0.115 | 0.120 | 0.121 | 4 | 5 | 4 | 4 |
| Water area | 1.613 | 1.607 | 1.618 | 1.617 | 0.113 | 0.107 | 0.118 | 0.117 | 3 | 6 | 5 | 5 |
| Low-medium-coverage grassland | 1.608 | 1.617 | 1.608 | 1.609 | 0.108 | 0.117 | 0.108 | 0.109 | 5 | 4 | 6 | 6 |
| Other forest land | 1.604 | 1.653 | 1.724 | 1.723 | 0.104 | 0.153 | 0.224 | 0.223 | 6 | 2 | 2 | 2 |
| Shrub forest land | 1.590 | 1.592 | 1.606 | 1.607 | 0.090 | 0.092 | 0.106 | 0.107 | 7 | 7 | 7 | 7 |
| Forested land | 1.583 | 1.580 | 1.582 | 1.581 | 0.083 | 0.080 | 0.082 | 0.081 | 8 | 9 | 9 | 9 |
| Dryland | 1.580 | 1.581 | 1.591 | 1.590 | 0.080 | 0.081 | 0.091 | 0.090 | 9 | 8 | 8 | 8 |
| Paddy | 1.517 | 1.522 | 1.528 | 1.527 | 0.017 | 0.022 | 0.028 | 0.027 | 10 | 10 | 10 | 10 |
Table 4 Comparisons of landscape indices of various land use types in the Poyang Lake area in 1995, 2005, 2015, and 2018. |
| Land type | Patch density | Patch shape fragmentation index | Landscape isolation index | |||||||||
|---|---|---|---|---|---|---|---|---|---|---|---|---|
| 1995 | 2005 | 2015 | 2018 | 1995 | 2005 | 2015 | 2018 | 1995 | 2005 | 2015 | 2018 | |
| Paddy | 0.115 | 0.122 | 0.134 | 0.133 | 0.327 | 0.354 | 0.389 | 0.388 | 102.9 | 112.0 | 102.3 | 103.8 |
| Dryland | 0.175 | 0.180 | 0.185 | 0.181 | 1.738 | 1.811 | 1.908 | 1.904 | 40585.2 | 41653.0 | 40985.8 | 42553.7 |
| Forested land | 0.138 | 0.139 | 0.138 | 0.136 | 1.006 | 0.997 | 0.941 | 0.933 | 1761.1 | 1737.8 | 2298.6 | 2299.1 |
| Shrub forest land | 0.068 | 0.069 | 0.070 | 0.070 | 1.490 | 1.562 | 1.768 | 1.773 | 99800.8 | 103420.2 | 121972.1 | 122214.4 |
| Sparse forest land | 0.196 | 0.198 | 0.193 | 0.191 | 2.915 | 3.038 | 3.335 | 3.343 | 133032.9 | 145093.5 | 209645.8 | 212327.8 |
| Other forest land | 0.006 | 0.008 | 0.008 | 0.008 | 4.039 | 4.574 | 4.302 | 4.280 | 18062511.6 | 16460734.6 | 15977976.6 | 16021729.2 |
| High-coverage grassland | 0.026 | 0.028 | 0.029 | 0.029 | 1.444 | 1.662 | 1.897 | 1.917 | 127222.9 | 145349.2 | 209863.9 | 209928.1 |
| Low-medium-coverage grassland | 0.021 | 0.021 | 0.022 | 0.023 | 1.184 | 1.203 | 1.374 | 1.403 | 348843.5 | 301706.5 | 415720.3 | 416993.9 |
| Water area | 0.106 | 0.104 | 0.107 | 0.106 | 0.455 | 0.437 | 0.452 | 0.450 | 25.5 | 24.3 | 24.9 | 25.1 |
| Building land | 0.242 | 0.240 | 0.240 | 0.239 | 9.587 | 7.712 | 5.431 | 4.719 | 343695.5 | 105461.8 | 28319.9 | 14198.1 |
| Overall landscape pattern | 1.094 | 1.110 | 1.127 | 1.116 | 1.094 | 1.110 | 1.127 | 1.116 | 20.2 | 19.7 | 19.8 | 19.9 |
| 1 |
|
| 2 |
|
| 3 |
|
| 4 |
|
| 5 |
|
| 6 |
|
| 7 |
|
| 8 |
|
| 9 |
|
| 10 |
|
| 11 |
|
| 12 |
|
| 13 |
|
| 14 |
|
| 15 |
|
| 16 |
|
| 17 |
|
| 18 |
|
| 19 |
|
| 20 |
|
| 21 |
|
| 22 |
|
| 23 |
|
| 24 |
|
| 25 |
|
| 26 |
|
/
| 〈 |
|
〉 |