Land Use Efficiency

Spatiotemporal Differentiation and the Factors Influencing Eco-efficiency in China

  • LI Qiuying 1 ,
  • LIANG Longwu 2, 3 ,
  • WANG Zhenbo , 2, 3, *
Expand
  • 1. Institute of Shandong Academy of Social Sciences, Jinan 250002, China
  • 2. Institute of Geographic Sciences and National Resources Research, Chinese Academy of Sciences, Beijing 100101, China
  • 3. University of Chinese Academy of Sciences, Beijing 100049, China
* WANG Zhenbo, E-mail:

Received date: 2020-09-01

  Accepted date: 2020-11-25

  Online published: 2021-05-30

Supported by

The National Natural Science Foundation of China(41771181)

The National Natural Science Foundation of China(41661116)

The Shandong Social Science Planning Fund Program(20CJJJ04)

Abstract

Economic development, resource utilization, and environmental protection have always presented clear dilemmas for many countries at the national level. It is clear that the related concepts of eco-efficiency and the evaluation index can help in evaluating these associated issues. Thus, based on the use of undesirable output super Slacks-Based Measure models, this study evaluated the eco-efficiency of 30 Chinese provinces during the period between 2005 and 2016. This evaluation was conducted by analyzing the spatiotemporal dynamics and key factors influencing these changes using a panel regression model. The results of this analysis reveal that eco-efficiency gradually increased over the course of the study period, peaking at different levels among the regions. We used the conventional CV evolutionary method to show that inequalities in eco-efficiency gradually decreased at the national level. Indeed, our estimations of the factors affecting this variable suggest that industrial structure, degree of openness, urbanization, technical innovation, and environmental governance all exert significant positive influences, while energy consumption and traffic exert negative effects. The extent of the impacts of these factors on eco-efficiency varied between the different regions.

Cite this article

LI Qiuying , LIANG Longwu , WANG Zhenbo . Spatiotemporal Differentiation and the Factors Influencing Eco-efficiency in China[J]. Journal of Resources and Ecology, 2021 , 12(2) : 155 -164 . DOI: 10.5814/j.issn.1674-764x.2021.02.003

1 Introduction

China has developed successfully over the past 40 years, since the Reform and Opening-up, to become the second-largest economy in the world. This achievement has been the result of huge inputs of materials, energy, resources, and primary labor. The Environmental Performance Index score for China currently stands at 37.3, ranking China as 120 out of 180 economies globally (Wendling et al., 2020), which is indicative of the negative effect of such rapid economic growth on the environment. It is therefore clear that the current economic mode for Chinese development remains in an extensive phase, rather than an intensive phase. The report of the 19th National Congress of the Communist Party of China (CPC) included a major judgment by stating that “China’s economy has shifted from a high-speed growth phase to a high-quality development phase”. It is generally the case that high-quality development builds on economic development as well as innovation, coordination, greenness, openness, and sharing. Thus, it is crucial to evaluate the sustainability nexus, which combines the green development concept with economic growth.
Ecological efficiency (i.e., eco-efficiency) is an instrument used for sustainability analysis, which reflects the technical level and capacity of a regional production system experiencing high economic growth but with minimal natural resource and environmental degradation. The concept of eco-efficiency was utilized by the World Business Council for Sustainable Development which considered it to be defined as satisfying people’s needs while maintaining environmental influence within the carrying capacity of the Earth (Sinkin et al., 2008). Eco-efficiency therefore encapsulates the value of products and services with environmental costs, and reflects the relationships between ecological, environmental, resource, and economic development (Quariguasi et al., 2009). This idea has been widely applied to the study of sustainable development, including with regard to the concepts (Rashidi and Farzipoor, 2015), evaluation indicators (Munisamy and Arabi, 2015; Huang et al., 2018), the methods used for evaluation (Cagno et al., 2019; Deng and Gibson, 2019) and mechanisms influencing eco-efficiency (Zhou et al., 2018; Xu et al., 2020). At the same time, studies on eco-efficiency have also been applied across several scales, including national (Liu et al., 2019), regional (Yu et al., 2018; Guan et al., 2019), and industrial (Gerven et al., 2007; Wang et al., 2019a), as well as at the level of individual companies (Michelsen et al., 2006; Vásquez et al., 2019).
Eco-efficiency evaluation is a key research area and includes such sub-fields as material flow analysis and the ecological footprint and index methods, as well as stochastic frontier (SFA) and data envelopment analyses (DEA) (Koskela, 2015; Wang et al., 2019a; Wang et al., 2019b). Among these methods, DEA is able to simultaneously deal with multi-input and -output indicators without determining their weights; and since this feature makes evaluation easier and more flexible it is the most widely applied approach (Sueyoshi and Goto, 2012). This method is based on linear programming and indicates the production frontier for decision making units (DMUs). A traditional DEA model, however, only considers desirable outputs and does not incorporate undesirable ones. This means that the main issue in using this approach has been to also incorporate resource and environmental factors within the model. In this context, a number of previous workers have considered environmental pollution to be a cost, and have therefore treated it as an input variable; while others have applied the reciprocal transformation method to convert undesirable outputs to desirable ones (Huang et al., 2014; Trianni et al., 2014). Numerous other scholars have considered environmental pollution as an undesirable output (Kao, 2018; Halkos and Petrou, 2019). For example, in one early study, Tone (2001) proposed the use of a slacks-based measure (SBM) model to sum the functions of non-radial and non-oriented variables as a way of solving the issue of inputs and outputs when undesirable forms the latter are present. Applying this model, Tone (2002) also proposed a super-SBM variant that incorporates eco-efficiency evaluation more accurately and reliably. Subsequent studies then began to evaluate the factors influencing eco-efficiency on the basis of various regression models, including Tobit, Malmquist, spatial panel, and panel data approaches (Tone and Tsutsui, 2010; Zhu et al., 2019). Although these methods have all been applied to explorations of the factors influencing ecological efficiency, the use of a panel regression model has been the most common. Economic development, industrial structure, openness, urbanization, technical innovation, environmental governance, energy consumption, and traffic flow have been the main factors evaluated for their influences on eco-efficiency in previous research.
It is noteworthy that studies on eco-efficiency have progressed a great deal both theoretically and practically (Färe and Grosskopf, 2004; Jenniches, 2018; Li et al., 2019). At the same time, most existing studies have ignored undesirable outputs as components of the assessment, even though these factors are essential for accurate evaluation. The bulk of previous analyses which considered the factors influencing eco-efficiency have also employed cross-sectional rather than panel data, and some research has also ignored spatial heterogeneity when analyzing the influencing factors. In order to build on previous work and address its shortcomings, this paper applied an assessment of input and output indicators using a super-SBM model in order to evaluate eco-efficiency spatiotemporal variation across 30 Chinese provinces. A panel regression model was then applied to analyze the key influencing factors in four regions. The empirical results are presented and policy implications are summarized.
The remainder of this article is organized as follows. The methodology applied is outlined first, then the data description and the variables used for SBM and spatial econometric analyses are presented. An empirical comparison is then performed based on the measurement of eco-efficiency across 30 Chinese provinces over the period between 2005 and 2016, and finally conclusions and policy implications are presented.

2 Methods

2.1 The super-SBM model incorporating undesirable outputs

A number of super-SBM and DEA model variations can incorporate undesirable outputs. Since traditional DEA models are either input- or output-oriented, they do not have the ability to simultaneously consider either inputs or outputs. Thus, in order to render these relatively unproductive DMUs more efficient, an input-oriented DEA can be applied that is mainly focused on reducing these variables, while an output-oriented DEA mainly emphasizes expanding the outputs when both sets of variables are considered at the same time. The SBM model introduced by Tone can handle input reductions and output increases simultaneously, so they do not need to be changed appropriately (Tone and Tsutsui, 2010). At the same time, however, SBM models cannot process undesirable outputs, and it is difficult to avoid the situation of multiple DMUs with perfect efficiency (i.e., efficiency values of 1) in terms of the values obtained through the application of these approaches. It is therefore impossible to evaluate and collate the results. In contrast, a super-SBM considers undesirable outputs and therefore does an excellent job of resolving all three of these problems (Liu et al., 2016). In order to take advantage of this approach, a super-SBM model was used in this analysis to calculate green economic efficiency.
Incorporating n DMUs, it is clear that each one will have m types of input factors producing s1.types of desirable outputs and s2..types of undesirable outputs. This means that if three vectors are made to express the correlated factors ${{x}_{i}}\in {{R}^{m}}$, $y_{i}^{d}\in {{R}^{{{s}_{1}}}}$,and $y_{i}^{ud}\in {{R}^{{{s}_{2}}}}$, then matrices X, Yd and ${{Y}^{ud}}$ can be expressed as follows:
$\begin{matrix} X=\left[ {{x}_{1}},{{x}_{2}},\cdots ,{{x}_{n}} \right]\in {{R}^{m\times n}} \\ {{Y}^{d}}=\left[ y_{1}^{d},y_{2}^{d},...,y_{n}^{d} \right]\in {{R}^{{{s}_{1}}\times n}} \\ {{Y}^{ud}}=\left[ y_{1}^{ud},y_{2}^{ud},...,y_{n}^{ud} \right]\in {{R}^{{{s}_{2}}\times n}} \\ \end{matrix}$
The production possibility set (PPS) can therefore be expressed as follows:
$\begin{align} & P(x)=\{\left. ({{y}^{d}},{{y}^{ud}}) \right|x produce\ ({{y}^{d}},{{y}^{ud}}),\begin{matrix} {} & {} & {} \\ \end{matrix}x\ge X\lambda ,{{y}^{d}}\le {{Y}^{d}}\lambda ,{{y}^{ud}}\ge {{Y}^{ud}}\lambda ,\lambda \ge 0\} \\ \end{align}$
In Equation (2), λ is the nonnegative intensity vector, and shows that this definition corresponds to the condition of constant returns to scale (CRS).
Thus, based on the PPS above, an SBM model that also considers undesirable outputs can be expressed as follows:
In Equation (3), sd,s-,sud.denote desirable output loss, excess input, and excess undesirable output, respectively, while the subscript “0” denotes DMUs for which the efficiency values are being estimated. Thus, in the Equation β∈[0,1], if β=1, then s- =sd=sud=0. and the DMU is effective; but if β<1, then the DMU is ineffective, and the inputs and outputs need to be improved.
Therefore, the super-SBM model used in this paper to consider undesirable outputs can be expressed as follows:
The value of objective function ${{\beta }_{SE}}$ can be greater than 1 in Equation (4), while the meanings of all other variables remain the same as in Equation (3).

2.2 Panel regression model

Panel data is often used for studies of this type because it has advantages in terms of reflecting the variation of objects over time and across sections. In the context of fixed, random, or mixed effects models (i.e., the three kinds of panel data regression approaches), the first comprises a special type of the least squares dummy variables model. This encapsulates a cross-section fixed-effects model as well as a time fixed-effects model and a mixed model with both entity and time fixed effects. We therefore applied a time fixed-effects model in this analysis to detect changes in the effects over time. A time fixed-effects model uses a set of unobserved variables that are common to all units but that vary with time, and can be expressed as follows:
${{Y}_{it}}={{\gamma }_{t}}+\sum\limits_{k=2}^{k}{{{\beta }_{k}}{{X}_{kit}}}+{{\mu }_{it}}$
In Equation (5), Yit denotes the dependent variable, while i = entity, and t = time. Thus, Xkit is the observation vector on k regressors, βk is the k vector of unknown coefficients, and γt is a time fixed effect encompassing t = 1, 2, …, T. Similarly, μit is the idiosyncratic error term subject to varianceσ2u.

3 Data and indicators

As defined in the China Statistical Yearbook, mainland China encompasses a total of 31 province-level administrative divisions, excluding Hong Kong, Macao and Taiwan. Tibet was excluded from this analysis because of limited data availability and the rest of China was divided into four main regions: eastern, central, western, and northeastern. The eastern region of China contains ten provinces, Beijing, Tianjin, Hebei, Shanghai, Shandong, Jiangsu, Zhejiang, Guangdong, Hainan, and Fujian; while the central region contains six, Jiangxi, Anhui, Shanxi, Hubei, Hunan, and Henan. The western region includes 11 provinces, Inner Mongolia, Sichuan, Chongqing, Yunnan, Guizhou, Guangxi, Shaanxi, Gansu, Ningxia, Qinghai, and Xinjiang; while the northeastern region contains three, Liaoning, Heilongjiang, and Jilin. All the data used here were extracted from the National Bureau of Statistics of China, the China Statistical Yearbook, the China Energy Statistical Yearbook, the China Statistical Yearbook of Environment, and the Statistical Yearbook of each province.

3.1 Indicators for evaluating eco-efficiency

On the basis of data availability and prior research, input and output indicators were selected for use here so that eco-efficiency could be measured effectively. In this context, labor, capital, and resources are all essential input elements.
The total number of employees at the end of each year was used as the labor input, while gross fixed asset investment was adopted as the capital input. We selected construction area as a proxy for land use, while total energy consumption (after conversion to standard coal equivalents) was used as the energy resource input. Total water supply was chosen as the water resource input. In terms of output indicators, gross domestic product (GDP) was used as a desirable variable, while environmental pollutants, including total volumes of wastewater discharge as well as industrial SO2, soot, and solid waste production, were all listed as undesirable outputs. Descriptive statistics for the input and output indicators are summarized in Table 1.
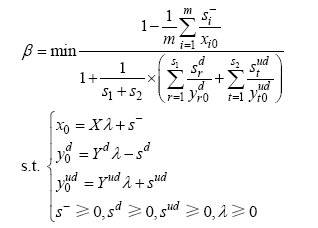
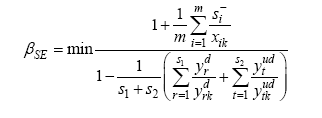
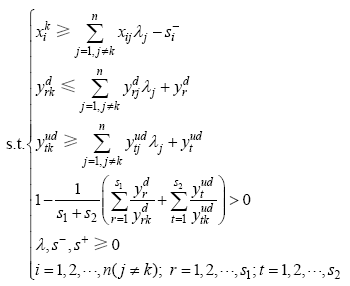
Table 1 Descriptive statistics for the input and output indicators between 2005 and 2016
Category Variable Units Mean Std. dev Min Max
Inputs Capital (I1) 108 yuan 12061.37 10861.52 323.68 54758.30
Labor force (I2) 104 persons 497.01 343.72 40.92 1973.30
Land resource (I5) km2 1458.72 1031.98 105.92 5266.60
Water super (I3) 108 t 201.26 150.30 22.33 1220.00
Energy resource (I4) 104 t of SCEa 12943.66 8140.66 822.00 38899.00
Undesirable Outputs Total waste water (UO1) 104 t 169264.71 165867.70 3396.00 938261.00
Industrial SO2 emission (UO2) 104 t 58.76 41.24 2.00 182.74
Industrial soot emission (UO3) 104 t 35.95 29.11 0.76 179.77
Industrial solid wastes emission (UO4) 104 t 8621.19 7972.33 127.00 45575.83
Desirable output GDP (DO1) 108 yuan 16900.45 15341.25 543.32 80854.91

Note: a SCE means standard coal equivalents.

3.2 Factors influencing eco-efficiency

We chose eight variables to explore the mechanisms influencing eco-efficiency across China. Thus, economic development (ED) was defined using per capita GDP, IS denotes secondary industry as a proportion of GDP to reflect industrial structure, openness (OP) was defined using FDI as a proportion of GDP, urban population (UR) was used to evaluate the level of urbanization, technical innovation (TI)represents expenditure for research and development (R&D) as a proportion of GDP, governance capacity of the environment (EG) denotes expenditure for environmental protection as a proportion of GDP, and carbon dioxide emission intensity (EC) was used to evaluate emission reductions. Finally, TR represents possession of civil vehicles to evaluate the traffic conditions. These indicators are summarized in Table 2.
Table 2 Influencing factor indicators
Factor Indicator Abbreviation Unit
Economic development Per capita GDP ED 104 yuan
Industrial structure Secondary industry as a proportion of GDP IS %
Openness FDI as a proportion of GDP OP %
Urbanization Proportion of urban population UR %
Technical innovation Expenditure for R&D as a proportion of GDP TI %
Governance capacity of the environment Expenditure for environmental protection as a proportion of GDP EG %
CO2 emission intensity Carbon dioxide emission intensity EC t (104 yuan)‒1
Traffic conditions Civil vehicle possession TR vehicle

4 Results and analysis

4.1 Spatiotemporal characteristics of eco-efficiency

The data obtained from the model show that eco-efficiency has gradually increased across China between 2005 and 2016, although it changed by different levels among the four regions (Fig. 1). It is clear that the overall eco-efficiency of China increased markedly from 0.481 to 0.747 over this study period; the first peak in these values occurred in 2008 while the second occurred in 2012. The results show that the eco-efficiency across China had increased rapidly by 2008, mainly because the successful bid for the Summer Olympic Games in that year by Beijing brought tremendous business opportunities to the eastern areas and encouraged heavy industrial polluters to cut their emissions. Indeed, after the 18th Communist Party of China National Congress was held in 2012, the country afforded more attention to technological innovation and ecological environmental protection, and thus eco-efficiency was also rapidly promoted.
Fig. 1 Average eco-efficiency values for the whole country and the four Chinese regions during 2005‒2016
The data show that between 2005 and 2016, the overall spatial pattern of ecological efficiency across China comprised a ladder-like distribution pattern, such that the east was greater than the middle which was greater than the west, followed by the lowest level in the northeast. At the same time, the eastern coastal area also performed significantly better than the inland area (Fig. 2). The eco-efficiency of the eastern region of China was ranked first, averaging about 0.806, while this value was lowest for the northeast region, with an average value below 0.470. As the eastern coastal region of China was the earliest to benefit from the Reform and Opening-up policies of the early 1980s, capital-intensive and labor-intensive industries ensured that this region led the way in development, making significant gains in economic strength and overall improvements. The Chinese Government then began to implement the strategies of Western Development, Prosperous Central China, and Revitalization in the Northeast at the beginning of the 21st century, all programs designed to preferentially increase financial input in the interior regions. The northeast region of China has the lowest eco-efficiency value and also the smallest annual average growth; this is the old industrial base of China where heavy chemical industries play a significant role in the creation of low value-added products and generate relatively high pollution.
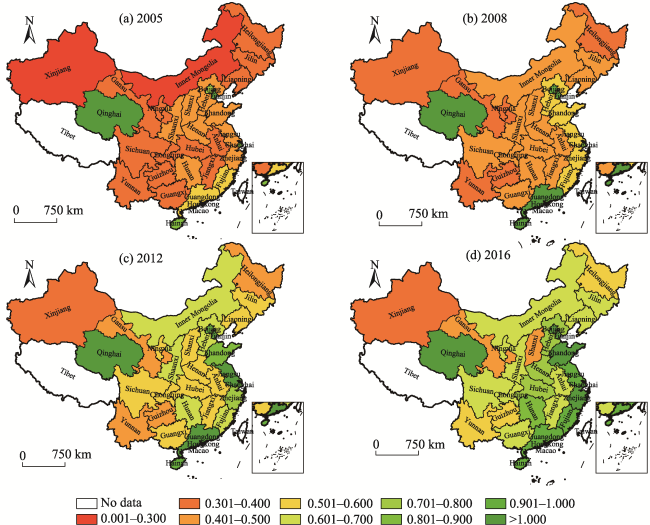
Fig. 2 Maps showing the spatial distribution patterns in Chinese provincial ecological efficiency in 2005, 2008, 2012 and 2016.

4.2 Eco-efficiency classification and fluctuation characteristics

The data presented in Table 3 reveal annual average scores for the eco-efficiency between 2005 and 2016, as well as the first and second halves of this period from 2005 to 2010, and 2011 to 2016. Similarly, plots of the eco-efficiencies of the 30 provinces over the study period are shown in Fig. 3. The application of a super-SBM model proved to be an effective approach for ranking the provinces within six groups according to their eco-efficiency values. The first group includes Tianjin and Qinghai with average values around 1.045 and 1.037, respectively, while the second contains the three provinces Hainan, Shanghai, and Beijing, all with values between 0.9 and 1. Eco-efficiency values for the five provinces which comprised the third group (Guangdong, Jiangsu, Shandong, Zhejiang, and Fujian) had scores between 0.6 and 0.8, while the fourth group encompasses Hunan, Hebei, Henan, Shaanxi, Inner Mongolia, Guangxi, Hubei, Liaoning, and Jiangxi, all with average values between 0.5 and 0.6. The fifth group considered here comprises Sichuan, Ningxia, Jilin, Chongqing, Anhui, Shanxi, Yunnan, Guizhou, and Heilongjiang, all with scores between 0.4 and 0.5, while the sixth (lowest) group contains provinces with scores below 0.4 and includes Gansu and Xinjiang. The provinces in the first, second, third, fourth, fifth, and sixth groups account for 6.67%, 13.33%, 13.33%, 30%, 30%, and 6.67% of total number of provinces examined here, respectively, based on data for the period between 2005 and 2016 (Table 4).
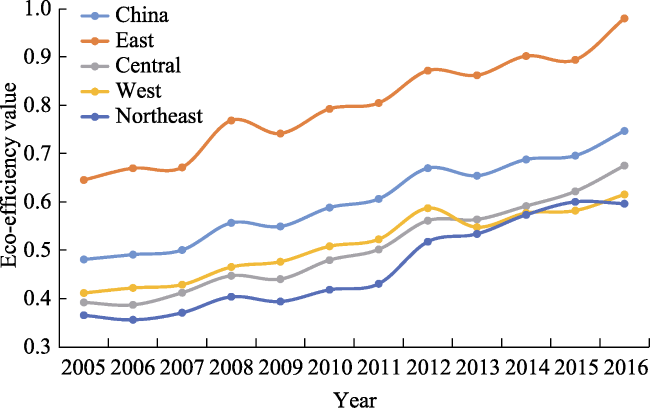
Table 3 Annual average scores for eco-efficiency and provincial rankings between 2005 and 2016, 2005 and 2010, and 2011 and 2016
Province 2005‒2016 2005‒2010 2011‒2016 Province 2005‒2016 2005‒2010 2011‒2016
Rank Score Rank Score Rank Score Rank Score Rank Score Rank Score
Tianjin 1 1.045 2 1.028 1 1.062 Guangxi 16 0.513 15 0.441 20 0.584
Qinghai 2 1.037 1 1.089 3 0.985 Hubei 17 0.502 19 0.407 17 0.597
Hainan 3 0.974 3 0.971 5 0.976 Liaoning 18 0.501 24 0.387 15 0.614
Shanghai 4 0.921 5 0.864 4 0.978 Jiangxi 19 0.500 17 0.422 21 0.579
Beijing 5 0.918 4 0.893 6 0.943 Sichuan 20 0.495 20 0.406 19 0.584
Guangdong 6 0.839 6 0.686 2 0.991 Ningxia 21 0.486 26 0.377 18 0.595
Jiangsu 7 0.745 7 0.590 7 0.901 Jilin 22 0.486 22 0.393 22 0.578
Shandong 8 0.716 8 0.551 8 0.881 Chongqing 23 0.477 25 0.387 23 0.567
Zhejiang 9 0.686 10 0.543 9 0.830 Anhui 24 0.473 21 0.393 24 0.553
Fujian 10 0.645 9 0.546 10 0.743 Shanxi 25 0.462 16 0.441 27 0.483
Hunan 11 0.581 14 0.444 11 0.718 Yunnan 26 0.460 23 0.389 25 0.531
Hebei 12 0.575 11 0.478 12 0.672 Guizhou 27 0.426 29 0.352 26 0.500
Henan 13 0.544 12 0.452 13 0.635 Heilongjiang 28 0.421 27 0.375 28 0.466
Shaanxi 14 0.530 13 0.448 16 0.611 Gansu 29 0.385 28 0.361 29 0.409
Inner Mongolia 15 0.515 18 0.412 14 0.618 Xinjiang 30 0.339 30 0.313 30 0.364
Table 4 Provincial eco-efficiency value distribution across China
Group First Second Third Fourth Fifth Sixth
Scores > 1.00 0.80‒1.00 0.60‒0.80 0.50‒0.60 0.40‒0.50 < 0.4
Number of provinces 2 4 4 9 9 2
Proportion (%) 6.67 13.33 13.33 30.00 30.00 6.67
The concept of a volatility ratio was used to compare changes in eco-efficiency across the four geographic areas between 2005 and 2016. It is clear (Fig. 3) that eco-efficiency volatility within China decreased gradually between 0.463 in 2005 and 0.289 in 2016, an overall annual reduction of 0.204 at the national level. However, eco-efficiency volatility in both the western and eastern regions generally trended downwards across the study period. The western region exhibited the highest eco-efficiency volatility, experiencing large swings over time that resulted in greater gaps between the 11 provinces in the region. The change trend seen in the eco-efficiency volatility ratio values included increases in the central and northeastern regions between 2005 and 2016, with values of 0.084 and 0.162, respectively. The regions can be ranked according to their CV scores for eco-efficiency, and that ranking shows that the sequence was: western > eastern > northeastern > central region, encompassing scores of 0.383, 0.226, 0.108, and 0.098, respectively.
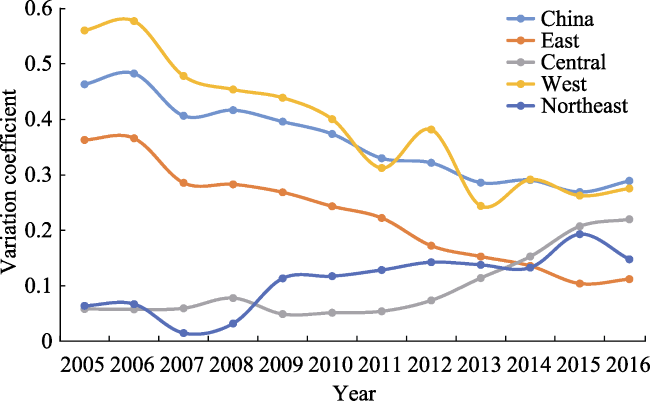
Fig. 3 Eco-efficiency volatility ratio values for all of China and the four Chinese regions duing 2005‒2016
The results of the eco-efficiency volatility ratios for each province are presented in Fig. 4. These data show that the average value of the eco-efficiency volatility ratio for the 30 provinces in China between 2005 and 2016 was 0.181. This ratio was greater than 0.2 in 14 provinces, including Ningxia, Hunan, Shandong, Liaoning, Jiangsu, Inner Mongolia, Zhejiang, Guangdong, Hubei, Chongqing, Jilin, Sichuan, Fujian, and Guizhou. The eco-efficiency volatility ratio for the eight provinces of Henan, Anhui, Hebei, Jiangxi, Shaanxi, Yunnan, Guangxi, and Heilongjiang was not greater than 0.2 but greater than 0.1, while this value for the eight remaining provinces (Shanxi, Shanghai, Xinjiang, Beijing, Tianjin, Gansu, Qinghai, and Hainan) was not more than 0.1. The provinces could therefore be divided into three groups with interval values of not greater than 0.3 but greater than 0.2, not greater than 0.2 but greater than 0.1, and not greater than 0.1, accounting for 26.67%, 26.67%, and 46.66% of the variation, respectively.
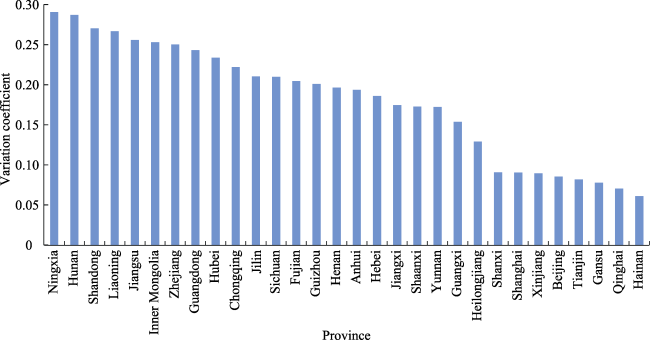
Fig. 4 Eco-efficiency volatility ratio values for the 30 Chinese provinces between 2005 and 2016 Notes: Hong Kong, Macao, Taiwan and Tibet were excluded due to limited data availability.

4.3 Factors influencing eco-efficiency

On the basis of earlier research, it is clear that a panel data regression model should be chosen, based on the results reported here along with Hausman and T-tests. As the ρ-values of both Hausman and F-tests approached 0, we chose a panel data regression model with time fixed effects. Eight factors were ultimately selected as variables for the analysis by eliminating factors with multicollinearity through variance factor inflation (Table 5).
Table 5 Panel data regression results encompassing time fixed effects
Factor China East Central West Northeast
ED 0.452
(8.30)
‒0.058
(‒0.43)
0.131***
(1.04)
0.471**
(3.95)
‒0.465
(‒3.77)
IS 0.132***
(‒1.50)
‒1.009
(‒3.19)
0.949**
(4.50)
0.821***
(2.73)
‒0.590**
(‒2.67)
OP 0.130***
(‒0.43)
0.030***
(0.88)
‒0.096
(‒2.67)
0.190
(5.71)
‒0.104***
(‒3.56)
UR 0.545**
(‒4.33)
1.400**
(4.01)
‒0.309**
(‒0.99)
‒1.035***
(‒3.59)
0.881
(‒1.66)
TI 0.041**
(‒0.38)
0.014*
(‒0.38)
0.027*
(‒1.77)
0.105**
(‒3.49)
‒0.036
(‒1.61)
EG 0.056**
(2.59)
0.029
(0.52)
0.014***
(‒0.79)
0.077**
(‒1.53)
0.074***
(‒1.31)
EC ‒0.048***
(‒2.89)
‒0.237***
(‒2.21)
‒0.184***
(‒5.20)
‒0.020
(‒1.07)
‒0.044
(‒0.41)
TR ‒0.062*
(‒3.76)
‒0.085**
(2.27)
‒0.030**
(‒1.00)
‒0.080
(‒3.11)
0.574
(6.28)
constant ‒1.520***
(-2.77)
‒6.737
(0.668)
1.488
(1.69)
0.843***
(0.88)
4.222***
(1.93)
R2 0.526 0.583 0.833 0.658 0.871
F-statistic 29.660 16.474 20.315 19.146 17.921

Note: Brackets enclose t-statistics, while ***, **, and * denote significance at 1%, 5%, and 10% levels, respectively.

It is clear that at the national level, industrial structure, degree of openness, urbanization, technical innovation, and environmental governance all exerted positive impacts on the eco-efficiency of China over the course of this study period. In contrast, it is also clear that energy consumption and traffic have had negative effects on eco-efficiency, while economic development did not pass the significance test used in this analysis. We have also shown that the extent of the factors’ impacts on eco-efficiency varies between different regions.
The coefficient of openness is positive in the east of China; this is because the eastern coastal region was the first to carry out Reform and Opening-up policies leading to the advent of advanced technologies and management experience. Urbanization has also exerted a positive impact on eco-efficiency here, as many people from the central and western areas of China migrated to the east bringing abundant labor resources and resultant economic activity. Technical innovation is also shown to have had a positive effect on eco-efficiency; this is especially the case in terms of the creation of new technologies and products that are more environmentally friendly and efficient, both economically and for daily life. Energy consumption has also had a nega tive effect on eco-efficiency; in recent years, governments in the eastern regions of China have introduced policies to shift industries from labor-intensive to service industries in order to apply a ‘forced’ mechanism for promoting the transformation and upgrading of industry. Similarly, traffic conditions have also had negative effects on eastern region eco-efficiency; as numbers of cars have increased, pollution problems from exhaust have become increasingly serious.
Economic development and industrial structures have exerted positive impacts on eco-efficiency in the center of China; this has been because the development of the central area of China remains in the second half of the mid- industrialization stage, and such structures still enhance economic development strength. The coefficient of technical innovation was positive, therefore, in this region, indicating that this variable plays an important role in continuous economic development. As the EG coefficient was positive, local governments increased environmental protection revenues as a result of their efforts towards energy-saving emission reductions. The coefficient of energy consumption was negative, which means that due to progress in energy-saving emissions reduction technology, the relative degree of pollution was decreased and the eco-efficiency level was promoted. At the same time, the urbanization coefficient was negative across our study area. On the one hand, urbanization strengthened industrial agglomeration and promoted the quality of human life, while on the other, this leads to serious environmental pollution. Traffic conditions also exerted negative effects on eco-efficiency across this area; as the resultant increase in environmental pollution from vehicle exhaust gases severely harms the environment.
In western China, economic development and industrial structures have both exerted positive impacts on eco-efficiency. This is because development in the western area of China remains in the first half of the mid-industrialization stage, so that these structures obviously enhance economic strength. The data show that the coefficient of technical innovation was positive across this region; which implies that technical innovation improves production technology and upgrades industries. Similarly, the EG coefficient was positive across this area; so local governments have made energy-saving emissions reductions by formulating regional plans related to environmental protection as well as additional budgets. Urbanization exerts a negative effect on eco-efficiency as most local ecosystems in the western areas of China remain in a very fragile condition. It is more difficult to repair the grave damage to the environment in this region.
The proportional expenditure for environmental protection has maintained a positive correlation with eco- efficiency across the northeast of China, a finding that confirms the capacity of government regulations to increase eco-efficiency. Industrial structures exert negative impacts on eco-efficiency in this region, driven mainly by heavy industries such as steel, cars, and equipment manufacturing facilities that have high resource consumption but low economic benefits alongside a weak service industry base. FDI in this region has also exerted a negative effect on eco-efficiency as the effect of knowledge spillover is not obvious in this area. The data also show that technology innovations have not exerted a significant effect, as R&D revenues here remain lower than the national average level, with a gap of more than 5%.

5 Conclusions

A super-SBM model was applied in this analysis, to take undesirable outputs into account in evaluating the eco-efficiency of 30 Chinese provinces between 2005 and 2016. The results of that analysis led to three major conclusions. First, the eco-efficiency of the whole country gradually increased during the study period, accompanied by different levels of eco-efficiency across individual regions. The eco-efficiency across the eastern region of China ranked first while that in the northeast region was lowest. Thus, applying a CV evolutionary method, we determined that inequalities in eco-efficiency gradually decreased nationally. Second, at the provincial level, significant differences in eco-efficiency are seen across the 30 subdivisions of China; and these provinces can be divided into six groups according to eco-efficiency value ranges. The results indicate that eco-efficiency values remained low across most of the Chinese provinces showing that improvements are still needed. Third, a panel data regression model with time fixed effects was applied to analyze the mechanisms influencing eco-efficiency throughout the study period. The findings of this study demonstrated that industrial structures, degree of openness, urbanization, technical innovation, and environmental governance all exerted significant positive influences on this variable, while energy consumption and traffic both had negative effects on eco-efficiency. The extent of the impacts of these variables on eco-efficiency varied among the different Chinese regions.
The concept of eco-efficiency is closely related to sustainable development, ecological civilization, and the idea of a beautiful China. The results of this study reveal a number of both consistencies and inconsistencies with previous findings, in addition to some unique findings. Our analysis of the factors influencing eco-efficiency reveals that the level of industrial structure, degree of openness, urbanization, technical innovation, and environmental governance have all exerted positive impacts on the eco-efficiency of China throughout the study period at the national level, consistent with previous research (Saling et al. 2002; Zhou et al. 2018). The results of this study also reveal a series of notable findings. For example, industrial structures exert a positive impact in the central and western regions, while their impacts remain negative in the northeast region of China. The degree of openness has exerted a positive impact across the eastern region of China, while this variable has exerted a negative impact across the northeast region and it has been of no significance to the other regions. This study aims to provide a frame of reference for green economic growth as well as for sustainable high-quality development in the different regions.
The results of this study demonstrate the importance and urgency for the Chinese government to promote balanced green economic development amongst all the regions. We propose some targeted suggestions for strategies in this regard, including the reduction of regional disparities and coordination of development. In the first place, regional economic cooperation in growth should be maintained alongside sustainable resource utilization and the promotion of ecological principles. The government in the eastern region of China should continue to promote the transformation and upgrading of industrial structures, emphasizing industrial technology upgrades and technological innovation. The continuing industrial transformation of the eastern area of China remains a strong driving force for promoting the development of industry in other regions. The central region of China should aim to ‘create a beautiful central region with green development’, build comprehensive and coordinated ecological environmental protection and systems of governance, develop green energy minerals, strengthen emerging green industries, and improve the level of green tourism. In order to protect the fragile ecology of western China, the government should define a clear bottom line for ecological protection, accelerate economic development and rapid urban construction, scientifically adjust industrial structures, implement the optimization and upgrading of economic growth, and effectively protect the ecological environment. Reforms which maximize the efficiency of energy use and implement strict environmental access standards will also strengthen the northeast regions of China.
1
Cagno E, Accordini D, Trianni A . 2019. A framework to characterize factors affecting the adoption of energy efficiency measures within electric motors systems. Energy Procedia, 158:3352-3357.

2
Deng X Z, Gibson J . 2019. Improving eco-efficiency for the sustainable agricultural production: A case study in Shandong, China. Technological Forecasting and Social Change, 144:394-400.

3
Färe R, Grosskopf S . 2004. Modeling undesirable factors in efficiency evaluation: Comment. European Journal of Operational Research, 157(1):242-245.

DOI

4
Gerven T V, Block C, Geens J , et al. 2007. Environmental response indicators for the industrial and energy sector in Flanders. Journal of Cleaner Production, 15(10):886-894.

DOI

5
Guan R D, Tian L X, Li W C . 2019. Analysis of influencing factors on energy efficiency of Yangtze River Delta urban agglomeration based on spatial heterogeneity. Energy Procedia, 158:3234-3239.

6
Halkos G, Petrou K N . 2019. Treating undesirable outputs in DEA: A critical review. Economic Analysis and Policy, 62:97-104.

7
Huang J H, Xia J J, Yu Y T , et al. 2018. Composite eco-efficiency indicators for China based on data envelopment analysis. Ecological Indicators, 85:674-697.

8
Huang J H, Yang X G, Cheng G , et al. 2014. A comprehensive eco-efficiency model and dynamics of regional eco-efficiency in China. Journal of Cleaner Production, 67:228-238.

9
Jenniches S . 2018. Assessing the regional economic impacts of renewable energy sources—A literature review. Renewable and Sustainable Energy Reviews, 93:35-51.

10
Kao C . 2018. A classification of slacks-based efficiency measures in network data envelopment analysis with an analysis of the properties possessed. European Journal of Operational Research, 270(3):1109-1121.

11
Koskela M . 2015. Measuring eco-efficiency in the Finnish forest industry using public data. Journal of Cleaner Production, 98:316-327.

12
Li L, Liu X M, Ge J J , et al. 2019. Regional differences in spatial spillover and hysteresis effects: A theoretical and empirical study of environmental regulations on haze pollution in China. Journal of Cleaner Production, 230:1096-1110.

13
Liu Y Q, Zhao G H, Zhao Y S . 2016. An analysis of Chinese provincial carbon dioxide emission efficiencies based on energy consumption structure. Energy Policy, 96:524-533.

14
Michelsen O, Fet A M, Dahlsrud A . 2006. Eco-efficiency in extended supply chains: A case study of furniture production. Journal of Environmental Management, 79(3):290-297.

DOI PMID

15
Munisamy S, Arabi B . 2015. Eco-efficiency change in power plants: Using a slacks-based measure for the meta-frontier Malmquist-Luenberger productivity index. Journal of Cleaner Production, 105:218-232.

16
Quariguasi F N J, Walther G, Bloemhof J , et al. 2009. A methodology for assessing eco-efficiency in logistics networks. European Journal of Operational Research, 193(3):670-682.

17
Rashidi K, Farzipoor Saen R . 2015. Measuring eco-efficiency based on green indicators and potentials in energy saving and undesirable output abatement. Energy Economics, 50:18-26.

18
Sinkin C, Wright C J, Burnett R D . 2008. Eco-efficiency and firm value. Journal of Accounting and Public Policy, 27(2):167-176.

19
Sueyoshi T, Goto M . 2012. DEA radial measurement for environmental assessment and planning: Desirable procedures to evaluate fossil fuel power plants. Energy Policy, 41:422-432.

20
Tone K, Tsutsui M . 2010. Dynamic DEA: A slacks-based measure approach. Omega, 38(3-4):145-156.

21
Tone K . 2001. A slacks-based measure of efficiency in data envelopment analysis. European Journal of Operational Research, 130(3):498-509.

22
Tone K . 2002. A slacks-based measure of super-efficiency in data envelopment analysis. European Journal of Operational Research, 130(3):498-509

DOI

23
Trianni A, Cagno E, De Donatis A . 2014. A framework to characterize energy efficiency measures. Applied Energy, 118:207-220.

DOI

24
Vásquez J, Aguirre S, Fuquene-Retamoso C E , et al. 2019. A conceptual framework for the eco-efficiency assessment of small-and medium-sized enterprises. Journal of Cleaner Production, 237:117660. DOI: 10.1016/j.jclepro.2019.117660.

25
Wang X M, Ding H, Liu L . 2019a. Eco-efficiency measurement of industrial sectors in China: A hybrid super-efficiency DEA analysis. Journal of Cleaner Production, 229:53-64.

DOI

26
Wang Z B, Liang L W, Sun Z , et al. 2019b. Spatiotemporal differentiation and the factors influencing urbanization and ecological environment synergistic effects within the Beijing-Tianjin-Hebei urban agglomeration. Journal of Environmental Management, 243:227-239.

DOI PMID

27
Wendling Z A, Emerson J W, de Sherbinin A , et al. 2020. 2020 Environmental Performance Index. New Haven, CT: Yale Center for Environmental Law & Policy. epi.yale.edu.

28
Xu J R, Huang D C, He Z Q , et al. 2020. Research on the structural features and influential factors of the spatial network of China’s regional ecological efficiency spillover. Sustainability, 12(8):3137. DOI: 10.3390/su12083137.

29
Yu Y T, Huang J H, Zhang N . 2018. Industrial eco-efficiency, regional disparity, and spatial convergence of China’s regions. Journal of Cleaner Production, 204:872-887.

30
Zhou C S, Shi C Y, Wang S J , et al. 2018. Estimation of eco-efficiency and its influencing factors in Guangdong Province based on super-SBM and panel regression models. Ecological Indicators, 86:67-80.

31
Zhu L, Wang Y, Shang P P , et al. 2019. Improvement path, the improvement potential and the dynamic evolution of regional energy efficiency in China: Based on an improved nonradial multidirectional efficiency analysis. Energy Policy, 133:110883. DOI: 10.1016/j.enpol.2019.110883.

Outlines

/