Resource Economy

A Study on Spatial Variation of Water Security Risks for the Zhangjiakou Region

  • LU Chunxia , 1, 2 ,
  • DENG Ou , 3, * ,
  • LI Yiqiu 3
Expand
  • 1. Institute of Geographic Sciences and Natural Resources Research, Chinese Academy of Sciences, Beijing 100101, China
  • 2. University of Chinese Academy of Sciences, Beijing 100049, China
  • 3. School of Geography & Environmental Sciences, Guizhou Normal University, Guiyang 550001, China
*DENG Ou, E-mail:

LU Chunxia, E-mail:

Received date: 2020-03-10

  Accepted date: 2020-06-30

  Online published: 2021-03-30

Supported by

National Major Science and Technology Program for Water Pollution Control and Treatment(2017ZX07101001)

Guizhou Normal University Doctoral Funds(GZNUD[2017]8)

Guizhou Normal University Doctoral Funds(GZNUD[2017]9)

Science and Technology Program of Guizhou Province([2019]1218)

Science and Technology Program of Guizhou Province([2019]1222)

Science and Technology Program of Guizhou Province([2020]1Z031)

Abstract

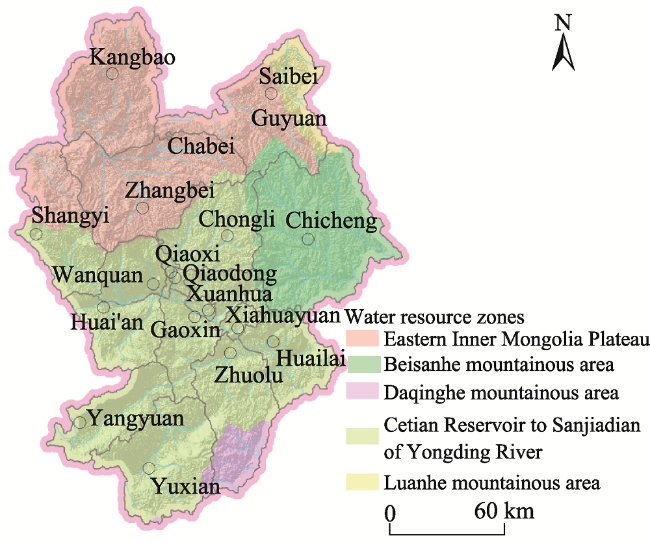
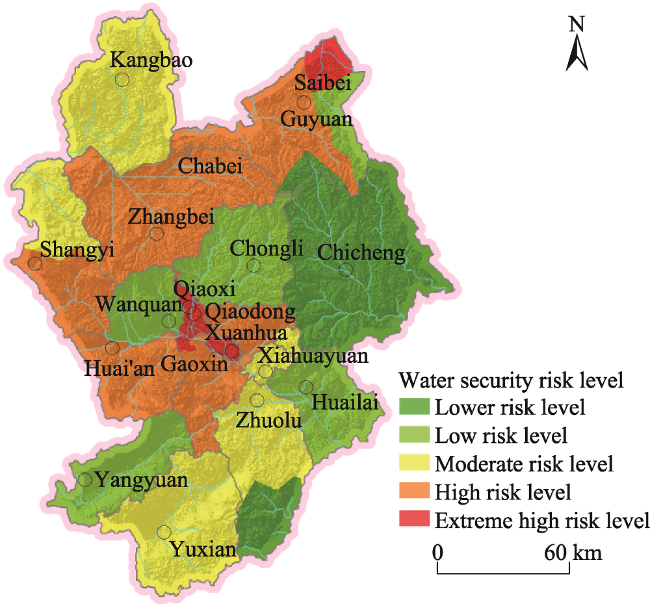
Zhangjiakou region is situated in an agro-pastoral ecotone with a fragile ecosystem. While it has limited surface water resources available and serious groundwater over-exploitation, the city is located in the water conservation zone for the Beijing-Tianjin-Hebei coordinated development area, so its water security is crucial for the entire Beijing-Tianjin-Hebei region. Therefore, it is of vital significance to determine the zoning management of water resources and decision-making according to the magnitude of water resource security risks. This study built an indicator system for water security risk assessment in line with the principles of scientific validity, comparability, operability, and data availability, and this system gives weights to these indicators using the AHP approach. County-level multi-source data for the study area, based on water resource zones, were collected by using mathematical statistics and 3S technology. With normalized data and a weighting method the water security risks were calculated. The results showed large spatial variations of water security risks in Zhangjiakou on the scales of geomorphic and administrative units as well as river basins. High-risk areas are extensive in the Bashang Plateau, and extremely high risk values are found in the Baxia areas. On the watershed scale, high-risk areas are mainly distributed in the inland river basins and the Yongding River basin. The risk values of the Luanhe River, Chaobai River and Daqing River basins in the Zhangjiakou region tend to decrease from north to south. For the northern and western areas of the Bashang Plateau, the factor of “vulnerability of the disaster-prone environment” contributes the most to the water security risk level. Agricultural water use constrains industrial and ecological water use, but in the context of inadequate water resource endowments, the urban population concentration and industrial development are the main causes of water shortages and water pollution so they contribute more to water security risks. This study of the spatial variation of water security risks in Zhangjiakou can provide an important scientific reference for zone-based management and decision-making for reducing the water security risks in the farming-pastoral ecotone.

Cite this article

LU Chunxia , DENG Ou , LI Yiqiu . A Study on Spatial Variation of Water Security Risks for the Zhangjiakou Region[J]. Journal of Resources and Ecology, 2021 , 12(1) : 91 -98 . DOI: 10.5814/j.issn.1674-764x.2021.01.009

1 Introduction

Water resources are essential for human survival and development. Water security refers to a state where water resources can meet the needs of sustainable regional economic and social development at different historical stages. In China, economic development, urban expansion and the improvement in people’s living standards has been accompanied by the increasing consumption of water resources, which has led to prominent contradictions between water supply and demand (Fang and Xiao, 2003; Xia and Zuo, 2013). The excessive exploitation of water resources has caused the deterioration of both the aquatic environment and water quality, resulting in the loss of certain use functions of some water resources. The shortage of water resources has severely restricted the sustainable development of China’s economy and society (Dang and Xu, 2015; Liu et al., 2019). Given the uncertainties caused by global climate change, the contradiction between water supply and demand will be further intensified for a growing population in the future. Therefore, water resource security has always been an important issue of great concern for academics and government departments (Liu et al., 2011; Feng et al., 2014).
Risk is defined as the effect of uncertainties on objectives (Fischhoff, 1985; Surak et al., 2003). Water security risks are the adverse effects caused by the interaction of uncertainties in the complex water resource systems (Zhang et al., 2012; Yao, 2013; Li, 2015). By applying and practicing risk theory in the field of water security, water security risk assessment can facilitate ex-ante management, risk identification and early risk prevention of the water resources (Huang et al., 2007; Zhang et al., 2012).
Beijing, Tianjin and Hebei currently face very high water security risk (Liang and Lv, 2019), which implies a huge potential threat to the coordinated development of the Beijing-Tianjin-Hebei region. Located in the upstream regions of Yongding river, Chaobai river and others, Zhangjiakou region serves as the water conservation area and a major ecological barrier for the Beijing-Tianjin-Hebei coordinated development. Therefore, the water security of Zhangjiakou is critical for the ecological security of Beijing and Tianjin. In view of this role, the assessment of water security risk in the city is of vital significance (Zhai, 2018).
Zhangjiakou region is a semi-arid area with limited precipitation and high interannual rainfall variation, both of which seriously affect the regional production of the farming and pastoral industries (Du et al., 2015). At the same time, the overexploitation of underground sources leads to the constant decline of the groundwater level, which brings great risks to the ecological environment security and poses a huge challenge for water security. This study aims to reveal the spatial variability of water security risks and to identify the key factors affecting water security risks and their respective contribution rates. The results will provide an important scientific reference for zoning management and decision-making regarding the water security risks, and enable classified guidance for water security risk management according to local conditions. This guidance will provide support for sustainable water utilization and water security with a view toward sustainable economic and social development.

2 Data and methods

2.1 Study area

Zhangjiakou, located in northwestern Hebei Province, has high elevation in the northwest and low elevation in the southeast. It is geologically divided by the Yinshan Mountain in the center into two distinct parts: The Bashang Plateau and the Baxia area. Due to the dry climate associated with a semi-humid and semi-arid transition zone, water resources are scarce in the city, being less than one-fifth of the national average per capita. The severe water shortage has become a bottleneck hindering the economic and social development of Zhangjiakou, and its ecological function as an area of water conservation in the Beijing-Tianjin-Hebei region (Zhang et al., 2009). Zhangjiakou’s water resources are mainly distributed in the Yongding River, Chaobai River and Daqing River systems in Baxia, the inland river systems in Bashang and the Luanhe River system. The Yongding River is an important water source that runs through Beijing, Tianjin, and Hebei. The Yongding River and the Chaobai River are directly connected to Beijing. The status of water conservation determines whether Zhangjiakou can provide a more plentiful and better water supply and ecological services for Beijing, Tianjin and Hebei. Fig. 1 and Table 1 show the water systems and water resource zoning in Zhangjiakou region.
Fig. 1 Water systems and water resource zoning in Zhangjiakou region
Table 1 Watershed, water resources and administrative divisions in Zhangjiakou region
Water resource zoning Administrative division Area (km2) Water resource zoning Administrative division Area (km2)
Luanhe mountainous area Guyuan 732.00 Cetian Reservoir to Sanjiadian of Yongding River Qiaodong 34.40
Sub-total 732.00 Qiaoxi 101.32
Beisanhe mountainous
Area
Guyuan 1083.00 Xuanhua 264.20
Chicheng 5287.00 Xiahuayuan 304.00
Sub-total 6370.00 Xuanhua 2107.70
Daqinghe mountainous
area
Zhuolu 1019.64 Shangyi 1337.64
Yuxian 237.06 Yuxian 2982.40
Sub-total 1256.70 Yangyuan 1839.00
Eastern Inner Mongolia
Plateau (Inland river
basins)
Zhangbei 3872.70 Huai’an 1693.00
Kangbao 3364.80 Wanquan 1160.97
Shangyi 1294.83 Huailai 1604.40
Guyuan 1573.00 Zhuolu 1778.95
Saibei 227.33 Chongli 2344.10
Chabei 373.00 Gaoxin 169.10
Sub-total 10705.66 Sub-total 17721.18
Total 36785.54

Note: Table 1 reflects the division of watersheds, water resources, and county-level administrative areas based on the Zhangjiakou Basic Geographic Information Database.

2.2 Data sources

The data used for this study mainly include distribution maps of the water systems and watersheds, water resource zoning, and county-level administrative areas in Zhangjiakou (sourced from Zhangjiakou Basic Geographic Information Database); 2017 land use/land cover data (derived from remote sensing image interpretation); meteorological data (derived from the China meteorological data sharing network (http://data.cma.cn/); water resources and water supply and utilization data (sourced from the 2017 Hebei water resource bulletin (DWRHP, 2017) and departmental investigations); socio-economic data (sourced from the 2017 Zhangjiakou Yearbook) (ZMPG, 2017); and water environ mental data (derived from departmental investigations and related research results).

2.3 Assessment model for water security risks

An indicator system for assessing water security risks (WR) was built based on the theory of disaster system risk (Shi, 2002; Liang and Lv, 2019) while taking into account the main aspects for the connotation of water security. The indicator system includes three components: Hazard of catastrophe factors (Ha), Exposure of disaster-bearing bodies (Ex), and Vulnerability of the disaster-prone environment (Vu).
Hazard of catastrophe factors (Ha) are the factors which lead to insecurity incidents in water resource systems. They are evaluated by measuring water quantity, water quality and drought extent. Water quantity is characterized by “per capita available water resources”, “development and utilization rate of water resources”, and “percentage of groundwater supply” which is selected in view of the serious groundwater overdraft problem in the study area. Water quality is expressed by “emission intensity per 10000 yuan of GDP”. Drought extent is measured by using the “drought index” and “variation coefficient of precipitation”.
Exposure of disaster-bearing bodies (Ex) reflects the state of socio-economic development. It is evaluated by indicators that characterize the status of population and economic development. While “population density” and “per capita GDP” are used to denote the general population and economic development, respectively, indicators of agriculture and agricultural infrastructure are also added considering the strong dependence of agricultural development on water resources. These agriculture-specific indicators include “percentage of cultivated land”, “percentage of effective irrigated farmland”, and “percentage of agricultural output value in GDP”.
Vulnerability of the disaster-prone environment (Vu) refers to the extent that the ecological environment is vulnerable and unable to cope with adverse effects. It is evaluated by measuring the water retention capacity of the underlying surface, water supply and water use efficiency, as well as ecological and environmental water use conditions. Specifically, “forest and grassland coverage rate” is used to characterize the water retention capacity of the underlying surface. “Percentage of surface engineering water supply”, “water consumption per 10000 yuan of industrial added value”, “water consumption per unit of GDP”, and “water consumption per mu of irrigated farmland” are used to represent the water supply and water use efficiency. “Percentage of eco-environmental water replenishment” is used to denote the ecological and environmental water use conditions.
On the basis of these indicator selections and data availability, the water security risks are quantified and expressed as a function of hazard, exposure and vulnerability: $WR=F(H,E,V)$. They are calculated using Equation (1):
$ W{{R}_{i}}=\sum{({{H}_{i}},{{E}_{i}},{{V}_{i}})} $
where WRi is the value of water security risk in region i and Hi, Ei, Vi are the weighted values of the risk attributes (hazard, exposure and vulnerability) in region i.

2.4 Hierarchical structure of water security risk assessment indicators

Zhangjiakou water security risks are evaluated on a county scale based on water resource zones. The indicator system is constructed in line with the principles of scientific validity, comparability, operability, and data availability. It comprises three layers: 1) the target layer (Z), which herein refers to water safety risks (WR); 2) the attribute layer (A), which includes hazard of catastrophe factors (H), exposure of disaster-bearing bodies (E), and vulnerability of the disaster-prone environment (V); and 3) the indicator layer (B), with specific indicators and their descriptions as shown in Table 2.
Table 2 Hierarchical model of water resource security risk evaluation and the meaning of its index
Target layer (Z) Attribute layer (A) Indicator layer (B) Description
Water security risks (WR) Hazard (H) Per capita available water resources (H1) Calculate the amount of water resources based on precipitation and the water production coefficient, and calculate the ratio of water resources to total resident population (m3 person-1)
Development and utilization rate of water resources (H2) Percentage of regional water consumption to total available water resources (%)
Percentage of groundwater supply (H3) Percentage of groundwater sources in total water supply (%)
Emission intensity per 10000 yuan of GDP (H4) Ratio of wastewater discharge to GDP (m3 (104 yuan) -1)
Drought index (H5) Ratio of annual evaporation capacity to annual precipitation
Variation coefficient of precipitation (H6) Standard deviation divided by average precipitation
Exposure (E) Population density (E1) Population per unit area (persons km-2)
Per capita GDP (E2) Ratio of GDP to resident population (yuan person-1)
Percentage of cultivated land (E3) Percentage of cultivated land in total land area (%)
Percentage of effective irrigated farmland (E4) Percentage of effective irrigation in cultivated land area (%)
Percentage of agricultural output value in GDP (E5) Percentage of agricultural output value in GDP (%)
Vulnerability (V) Forest and grassland coverage (V1) Percentage of forests and grassland in total land area (%)
Percentage of surface engineering water supply (V2) Percentage of surface engineering in total water supply (%)
Water consumption per 10000 yuan of industrial added value (V3) Ratio of industrial water consumption to industrial added value
(m3 (104 yuan) -1)
Water consumption per unit of GDP (V4) Ratio of water consumption to GDP (m3 (104 yuan) -1)
Water consumption per mu of irrigated farmland (V5) Ratio of irrigation water to actual irrigated farmland (m3 mu-1)
Percentage of eco-environmental water replenishment (V6) Percentage of eco-environmental water replenishment in total water supply (%)
Under the proposed indicator system, the analytical hierarchical process (AHP) (Saaty, 1980) was adopted to mathematically assess water security risks. First, the decision matrix, hierarchical single sorting and consistency test were combined to calculate the weights of various indicators in the corresponding attribute layer (WBH, WBE and WBV) and the relative weights of risk attributes for the target layer (WAWR). Then, hierarchical general sorting and consistency tests were preformed to measure the relative weights of all indicators for the target layer (WH, WE and WV).

2.5 Quantitative estimation of water security risks

Mathematical statistics and 3S (GPS, GIS, and RS) technology were applied to obtain county-level multi-source data for the study area based on water resource zones. Decision matrices (AijH, AijE and AijV) were built by normalizing the raw data to the weights of the various risk attributes (hazard, exposure and vulnerability):
$ {{H}_{i}}={{W}_{H}}\times A_{ijH}^{T}; {{E}_{i}}={{W}_{E}}\times A_{ijE}^{T}; {{V}_{i}}={{W}_{V}}\times A_{ijV}^{T} $
where, Hi, Ei, Vi are the weighted values of risk attributes (hazard, exposure and vulnerability) in region i; WH, WE and WV are the relative weights of all indicators for the target layer; and $A_{ijH}^{T}$,$A_{ijE}^{T}$and$A_{ijV}^{T}$ are the normalized transpose matrices of risk attributes. Using Equation (1), the comprehensive risk of each assessment unit was evaluated.

2.6 Normalization of raw data

Since the units of measurement were different among the indicators, the raw data needed to be normalized so that it would become standardized. Indicators may be either positively or negatively related to risk attributes. Depending on this characteristic, the indicators were classified as either benefit-type indicators and cost-type indicators, respectively (Liang and Lv, 2019), and calculated using the following equations:
${{A}_{ij\text{cost}}}\text{=}\frac{{{B}_{ij\max }}-{{B}_{ij}}}{{{B}_{ij\max }}-{{B}_{ij\min }}}; {{A}_{ij\text{benefit}}}\text{=}\frac{{{B}_{ij}}-{{B}_{ij\min }}}{{{B}_{ij\max }}-{{B}_{ij\min }}}$
where Bij is the value of indicator j in risk attribute i; Aijcost and Aijbenefit are the normalized negative and positive values of indicator j in risk attribute i, respectively; and Bijmax and Bijmin are the maximum and minimum values of indicator j in risk attribute i, respectively. The matrix A comprised of normalized cost-type and benefit-type indicators is called a decision matrix.

3 Data processing and result analysis

3.1 Evaluation of indicator weights

3.1.1 Hierarchical single sorting and consistency test
In line with the aforementioned steps in the AHP approach, pairwise comparisons are conducted for the indicators for water security risk assessment. By means of expert scoring, each relative weight was identified and represented by a particular scaling value. The decision matrices for water security risks were constructed for hierarchical single sorting and consistency testing. The results are shown in Table 3.
Table 3 Hierarchical single sorting and its consistency test results
Attributes W Factors Wi Consistency Ratio (CR)
H 0.4039 H1 0.2288 0.0759
H2 0.1887
H3 0.131
H4 0.2399
H5 0.1353
H6 0.0763
E 0.2806 E1 0.3017 0.0131 0.0001
E2 0.1006
E3 0.1778
E4 0.3017
E5 0.1182
V 0.3154 V1 0.1964 0.0054
V2 0.3114
V3 0.2031
V4 0.0926
V5 0.0982
V6 0.0982
3.1.2 Hierarchical general sorting and consistency test
Based on hierarchical single sorting, hierarchical general sorting and the consistency test were preformed to measure the weights of all indicators for the target layer, and the results are shown in Table 4.
Table 4 Hierarchical general sorting and its consistency test results
Target layer (Z) Indicator layer (B) WH Indicator layer (B) WE Indicator layer (B) WV
WR H1 0.0924 E1 0.0847 V1 0.0620
H2 0.0762 E2 0.0282 V2 0.0982
H3 0.0547 E3 0.0499 V3 0.0641
H4 0.0308 E4 0.0847 V4 0.0310
H5 0.0529 E5 0.0332 V5 0.0292
H6 0.0969 V6 0.0310
CR CR=0.0375<0.1

3.2 Water security risk assessment results and analysis

Using Equation (2) mentioned above, the weighted value of each risk attribute factor (hazard, exposure, and vulnerability) was first calculated. Based on the results, the water security risk of each assessment unit in the study area in 2017 was calculated using Equation (1). Then, the contribution levels and risk values of the water security risk attributes were calculated. The water security risk values shown in Table 5 and Fig. 2 are classified into extreme high risk level (EH), high risk level (H), moderate risk level (M), low risk level (LR) or lower risk level (L) by the ArcGIS natural breaks method.
Table 5 Contributions of water security risk attributes and risk levels in Zhangjiakou region, 2017
Water resource zoning Administrative division Hazard Exposure Vulnerability Water security risks Security risk level
Luanhe mountainous area Guyuan 0.0460 0.0951 0.1460 0.2871 L
Beisanhe mountainous area Guyuan 0.0720 0.0662 0.1336 0.2718 L
Chicheng 0.1001 0.0480 0.1099 0.2579 L
Cetian Reservoir to
Sanjiadian of Yongding River
Qiaodong 0.2633 0.1782 0.1634 0.6049 EH
Qiaoxi 0.2472 0.1077 0.1837 0.5387 EH
Xuanhua 0.2920 0.1122 0.2094 0.6136 EH
Xiahuayuan 0.1919 0.0495 0.1112 0.3526 L
Xuanhua 0.1486 0.1009 0.1570 0.4065 H
Shangyi 0.1360 0.0787 0.1764 0.3910 H
Yuxian 0.1694 0.0746 0.1162 0.3601 M
Yangyuan 0.1388 0.0874 0.1137 0.3400 M
Huai'an 0.1815 0.0794 0.1746 0.4355 H
Wanquan 0.1451 0.1071 0.0890 0.3412 M
Huailai 0.1459 0.1110 0.0846 0.3415 M
Zhuolu 0.1552 0.1181 0.1117 0.3850 M
Chongli 0.1449 0.0505 0.1168 0.3122 L
Gaoxin 0.2360 0.0928 0.1998 0.5286 EH
Daqinghe mountainous area Zhuolu 0.1022 0.0570 0.0493 0.2086 LR
Eastern Inner Mongolia Plateau (Inland river
basins)
Zhangbei 0.1975 0.0712 0.1682 0.4369 H
Kangbao 0.1323 0.0781 0.1680 0.3784 M
Shangyi 0.1131 0.0787 0.1764 0.3682 M
Guyuan 0.1746 0.0853 0.1801 0.4400 EH
Saibei 0.1749 0.1336 0.1742 0.4827 EH
Chabei 0.1630 0.0964 0.1508 0.4103 H
Fig. 2 Water security risk values for assessment units in Zhangjiakou region, 2017
The spatial distribution of water security risks in Zhangjiakou differs widely between the scale of geomorphic and administrative units and the scale of watersheds.
First, on the scale of geomorphic units and counties, high risks are identified in large parts of the Bashang area, however, extremely high risk values are found in Baxia area including the Xuanhua District, Qiaodong District, Qiaoxi District and Gaoxin District; while the lowest risk value appeared in Zhuolu County of the Daqinghe mountainous area in Baxia area.
Bashang Plateau is a transition zone between the Inner Mongolia Plateau and the North China Plain, where precipitation is limited but evaporation is strong. For Guyuan, Kangbao, and Shangyi counties in the northern and western parts of Bashang, the indicator “vulnerability of the disaster-prone environment” contributes the most to their water security risk values. The other prominent contributing indicators are “percentage of surface engineering water supply” and “forest and grassland coverage”, which characterize the status of surface water and vegetation cover. Due to low coverage of grassy expanses and vegetation, the water and soil holding capacity and water conservation ecological function are weakened, which increases the water security risks. For Zhangbei County, Chabei Management District and Saibei Management District, “per capita available water resources” and “emission intensity per 10000 yuan of GDP” that characterize water quantity and water quality show greater contributions. Therefore, the water security risk caused by human economic activities exceeds the vulnerability due to natural environmental conditions.
Baxia area is a low- and medium-elevation basin located at the intersection of the Bohai Bay economic circle and the Hebei-Shanxi-Inner Mongolia economic circle. Extremely high risk areas and extremely low risk areas for water security can be found in this region. Xuanhua District suffers the greatest risk. “Emission intensity per 10000 yuan of GDP”, which characterizes water quality, contributes the most to the risk; followed by “per capita available water resources” and “development and utilization rate of water resources”, which characterize water quantity. Zhuolu County has the smallest risk value. The factors which contribute the most in this county include the “percentage of effective irrigated farmland”, which characterizes the dependence of agriculture on water resources in the exposure of disaster-bearing bodies, and the “percentage of agricultural output value in GDP”, which represents agricultural development under the influence of water resources. Agricultural water use constrains industrial and ecological water use, but in the context of inadequate water resource endowments, the urban population concentration and industrial development are more responsible for water security risks by causing water shortages and water pollution.
Second, on the watershed scale, high-risk areas are mainly distributed in the inland river basins and the Yongding River basin, while relatively low risks are seen in the Luanhe river, Chaobai river and Daqing river systems.
The inland river basins have scarce precipitation and high evaporation. In the late 1990s, most inland rivers and lakes dried up and the groundwater level decreased sharply, leading to large contiguous high-risk areas. This is generally attributed to “forest and grassland coverage” and “percentage of surface engineering water supply”, which characterize vegetation cover and modifications of the surface hydrological infrastructure.
The Yongding river basin is the main water source and the lifeline of urban construction and economic development of Zhangjiakou. It accounts for 70.39% of the region’s population and 77.47% of the city’s GDP. High consumption and severe pollution of the water resources give rise to extremely high water security risks in the Municipal Districts. The most prominent contributing factors include “per capita available water resources” and “development and utilization rate of water resources”, which characterize water quality and water quantity.
The Luanhe river, Chaobai river and Daqing river basins under the jurisdiction of Zhangjiakou are located in the upstream mountainous areas of the corresponding water systems, and combined they account for less than 10.00% of the city’s population and GDP. The risk values of these areas are significantly lower than those of inland river basins and Yongding river basin, and they tend to decrease from north to south.

4 Discussion

There are obvious differences between the Bashang Plateau and Baxia area on the scale of geomorphic and administrative units. The risk level of water security is generally high in Bashang Plateau and the extreme levels appeared in Baxia area. For Bashang area, the risk level is mainly attributed to the “vulnerability of the disaster-prone environment” in Guyuan, Kangbao and Shangyi counties, and the two indexes of “percentage of surface engineering water supply” and “forest and grassland coverage” contribute the most to the risk level. This means that the limited capacity of surface water supply and low vegetation coverage aggravated the water security risk. Under the background of a serious shortage of surface water resources, it is very important to carry out ecological restoration and protection measures and to improve the water conservation function.
Extremely high risk areas and the lowest risk areas are distributed in Baxia area, which are closely related to the population density and social and economic development levels. Extremely high risks are found in central urban areas, including Qiaodong district, Qiaoxi district and Gaoxin district, where the indictors of “Emission intensity per 10000 yuan of GDP”, “per capita available water resources” and “development and utilization rate of water resources” are the key factors contributing to the risk levels. Thus, reducing water pollution discharge and improving the utilization of water resources are the keys to reducing the risks of water resources security in these districts.
On the watershed scale, the high risk areas are identified in the inland river basin and the Yongding river basin, while relatively low risks are seen in the Luanhe, Chaobai and Daqing river systems. The inland river basin covers almost the entire Bashang Plateau where serious shortages of surface water resources and the excessive exploitation of groundwater aggravate the risk of water resource security. The Yongding river basin occupies 48% of the total area but the population and GDP account for 70.39% and 77.47% of the entire Zhangjiakou region, respectively. The demand pressures for water resources caused by rapid urbanization, socio-economic development and runoff supply to the downstream area lead to a higher risk level of water resource security in this river basin. Obviously, the Yongding river basin plays an important role in the water security of Zhangjiakou region. Therefore, the following strategies must be adopted to ensure water security in the future: establishing water-conserving industries, improving the utilization efficiency of water resources, strengthening the ecological restoration of river basins, and improving the water conservation function.

5 Conclusions

An indicator system for assessing water security risk is constructed in line with the principles of scientific validity, comparability, operability, and data availability, and the indicators are weighted using the AHP approach. The weighted values for water security risks are calculated by using mathematical statistics and 3S technology. The application of this system to relevant data for Zhangjiakou region leads to the following conclusions:
Firstly, on the scale of geomorphic and administrative units, an obvious spatial variation of the water security risk in Zhangjiakou region exists. High-risk areas are extensive in the Bashang Plateau, but extremely high risk levels are found in the municipal districts of Baxia area.
Secondly, on the watershed scale, high-risk areas are mainly located in the inland river basins and the Yongding River basin, while relatively low risks are seen in the Luanhe, Chaobai and Daqing river systems.
Thirdly, the high-risk level of water security in the Bashang Plateau is closely related to the factor of “vulnerability of the disaster-prone environment”. Agricultural water use constrains industrial and ecological water use, while urbanization and industrial development cause water shortages and water pollution and thus contribute the most to water security risks in Baxia area.
[1]
Dang L J, Xu Y. 2015. Review of research progress in carrying capacity of water resources. Research of Soil & Water Conservation, 22(3):341-348. (in Chinese)

[2]
Department of Water Resources of Hebei Province (DWRHP),Hebei water resources bulletin compilation and development leading group. 2017. Hebei water resources bulletin 2017. (in Chinese)

[3]
Du H M, Yan J P, Wang P T. 2015. The drought disaster and its response to the warming-drying climate in the farming-pastoral ecotones in northern China. Journal of Arid Land Resources and Environment, 29(1):124-128. (in Chinese)

[4]
Fang Z Y, Xiao R C. 2003. General strategy for water conservancy development in China: Sustainable development of national economy of China based on sustainable utilization of water resources. Advances in Science & Technology of Water Resources, 23(1):1-4. (in Chinese)

[5]
Feng Z M, Yang Y Z, You Z. 2014. Research on the water resources restriction on population distribution in China. Journal of Natural Resources, 29(10):1637-1648. (in Chinese)

[6]
Fischhoff B. 1985. Managing risk perceptions. Issues in Science and Technology, 2(1):83-96.

[7]
Huang M C, Xie J C, Ruan B Q, et al. 2007. Model for assessing water shortage risk based on support vector machine. Journal of Hydraulic Engineering, 38(3):255-259. (in Chinese)

[8]
Li Z F. 2015. Climate change and water security in China’s surrounding regions. The Journal of International Studies, (4):38-55. (in Chinese)

[9]
Liang Y Y, Lv A F. 2019. Risk assessment of water resource security in China. Resources Science, 41(4):775-789. (in Chinese)

DOI

[10]
Liu J J, Dong S C, Li Z H. 2011. Comprehensive evaluation of China’s water resources carrying capacity. Journal of Natural Resources, 26(2):258-269. (in Chinese)

DOI

[11]
Liu Y H, Li Y B, Liang X Y, et al. 2019. Study on water resource carrying capacity evaluation and change in China. Resources and Environment in the Yangtze Basin, 28(5):1080-1091. (in Chinese)

[12]
Saaty T L. 1980. The analytic hierarchy process. New York, USA: McGraw-Hill Company.

[13]
Shi P J. 2002. Theory on disaster science and disaster dynamics. Journal of Natural Disasters, 11(3):1-9. (in Chinese)

[14]
Surak J G, Schmidt R H, Rodrick G E. 2003. International organization for standardization ISO 9000 and related standards. Hoboken, USA: John Wiley & Sons, Inc.

[15]
Xia J, Zuo Q T. 2013. China’s decade summary and prospect of water resources academic exchange. Journal of Natural Resources, 28(9):1488-1497. (in Chinese)

DOI

[16]
Yao J H. 2013. On risk assessment of water resources security. Journal of Changsha University, 27(5):94-96. (in Chinese)

[17]
Zhai X J. 2018. Study on the functional characteristics and evolution of the main ecosystems in the agro-pastoral ecotone. Diss., China Agricultural University. (in Chinese)

[18]
Zhang L, Yuan B, Yuan L Y. 2009. Water resources situation and development and utilization suggestion of Zhangjiakou. Haihe Water Resources, (12):20-22. (in Chinese)

[19]
Zhang S F, Chen J X, Hua D, et al. 2010. Research on the assessment of water resource system risk—A case study of Beijing. Journal of Natural Resources, 25(11):1855-1863. (in Chinese)

DOI

[20]
Zhang X, Xu K, Zhang D. 2012. Risk assessment of water resources utilization in Songliao Basin of Northeast China. Environmental Earth Sciences, 67(5):1319-1329. (in Chinese)

DOI

[21]
Zhangjiakou Municipal People’s Government (ZMPG). 2017. Zhangjiakou statistical yearbook in 2017. Peking, China: Kyushu press. (in Chinese)

Outlines

/