Resource Economy

Value and Heterogeneity: Using a Choice Experiment to Evaluate the Coastal Recreational Environment

  • WEI Jianhua , *
Expand
  • Jiujiang University, College of Tourism and Geography, Jiujiang, Jiangxi 332005, China
*WEI Jianhua, E-mail:

Received date: 2020-07-31

  Accepted date: 2020-09-22

  Online published: 2021-03-30

Supported by

National Natural Science Foundation of China(71640023)

Abstract

The management of the coastal park environment is a major ecological and economic development issue. In developing effective policies, relevant information is essential, especially the economic valuation of various recreation-related environmental attributes. This study used Dalian coastal parks as a pilot study area and estimated the willingness to pay (WTP) of tourists using three different discrete choice models. In this study, we analyzed the preference heterogeneity among the respondents regarding a combination of park attributes, and the individual respondent’s WTP values were estimated for each attribute. The results indicate that water quality amelioration and trash reduction had the highest economic values among the given attribute factors. In addition, the estimated tourist WTP varied considerably among different segments, such as among the visitors who preferred different recreational activities. These findings provide valuable information that will allow coastal park managers to develop policies which maintain a balance between tourism development and improvement of the coastal environment.

Cite this article

WEI Jianhua . Value and Heterogeneity: Using a Choice Experiment to Evaluate the Coastal Recreational Environment[J]. Journal of Resources and Ecology, 2021 , 12(1) : 80 -90 . DOI: 10.5814/j.issn.1674-764x.2021.01.008

1 Introduction

In term of economics, a significant contribution is created by the tourism sector (e.g., employment and income generation). However, with the rapid development of the tourism sector and economics, the natural environment and tourist experiences have encountered serious threats. Specifically, tourism growth in the coastal areas has resulted in water pollution, biodiversity reduction, scenic spot crowding, and increased trash (Yang et al., 2019). The degradation of the coastal tourism environment has significantly diminished the reputation of these destinations, which may motivate tourists to choose other alternatives. Consequently, improving the coastal environmental is of strategic importance for the sustainability of the tourism industry. In particular, the attributes that tourists prefer should be among the major considerations of park management authorities.
Environmental attribute valuation is used to determine tourists’ preferences, which allows policymakers and park managers to identify the park attributes that should be prioritized during resource allocation. Generally speaking, the overall objectives for managing nature-based scenic areas should involve the integration of both the socio-economic and ecological aspects (Díaz and Rodríguez, 2016; Zhang et al., 2020). To this end, it is essential to enforce the principles of sustainability that are related to the economic and ecological issues. The economic and social values are all closely related to the visitors’ welfare (Kubo et al., 2020), which is commonly measured by consumer surplus (Juutinen et al., 2011). Thus, by evaluating the alternative levels of coastal quality enhancement, this study can provide significant information for sustainable coastal park management.
The Choice Experiment (CE) is widely used in studies of the theoretical propositions of consumer choice behavior (Crouch et al., 2007). In CE, a consumer is provided with the opportunity to choose trade-offs among various environmental characteristics and programs, and these are expressed with alternative prices that simulate a real situation. The preferences for an environmental good are modeled by CE using a multi-dimensional response surface to enhance its applicability for managerial decision making (Adamowicz et al., 1994; Mogas et al., 2009; Rodrigues et al., 2016). In addition, experimental design theory can improve the statistical efficiency of the econometric models in the analysis, so that smaller sample sizes can be used while still obtaining statistically significant results.
Because of these potential advantages, many scholars have applied choice experiments and the contingent valuation method in assessing the economic value of the coastal environmental attributes (Eggert and Olsson, 2009; Beharry-Borg and Scarpa, 2010; Liu et al., 2019). Factors such as socio-economic status, cultural ties, and past experiences influence how people perceive environmental quality (Petrosillo et al., 2007). But, relatively little is known about how to evaluate environmental attributes by taking into account individual characteristics, such as gender, degree of education, income, and interest points. Prior studies have failed to provide an appropriate method for simultaneously evaluating several different sectors associated with environmental attributes and individual characteristics. To fill this research gap, one of the objectives of this study is to take these various sectors into account in the research design. In this study, respondents are provided with the opportunity to choose trade-offs among various environmental characteristics and programs, and the tourists’ characteristics are incorporated into the evaluation model.
The primary purpose of this study is to estimate the recreational value associated with hypothetical variations in the coastal environmental quality in Dalian. In view of the fact that Dalian is a unique coastal tourist city in the Northeast of China, the evaluation of its coastal recreational resources has important practical significance. In addition, the main coastal parks in Dalian have obvious differences in characteristics and resources (such as beach types, water quality, tourist density, etc.), which facilitates theoretical research on specific park attributes and tourist preferences. The choice experiment and discrete choice models are used to investigate the tourists’ utilization of the coastal environment, including “Beach type”, “Beach crowding”, “Beach garbage”, and “Water quality” in Dalian. This study also involved collecting socio-demographic information from the respondents. Finally, we combined the tourists’ willingness to pay (WTP) with individual characteristics in order to analyze and reveal the environmental value and heterogeneity. A combination of logit models is employed to overcome the potential inherent defects of the individual models. The models applied include the conditional logit model, random parameters logit model and heteroscedastic conditional logit model.
This study contributes to this field in three main ways. 1) It includes a joint assessment of multiple attributes and extends the estimation of recreational values, which involves natural, management, and tourist attributes, with a particular emphasis on beach congestion and trash management on the site. 2) The assessed environmental attributes’ values and heterogeneity can also be utilized to support the environmental impact assessment, as well as the risk management, and these can then be used in guiding coastal park management. 3) This study determines the results and addresses the related policy issues that can potentially serve as instrumental references for the management of other national coastal parks in China and around the world.

2 Study area

Dalian City is located on the southernmost tip of the Liaodong Peninsula in northeastern China (120°58′-123°31′E, 38°43′-40°10′N), and is adjacent to Japan, South Korea, North Korea and the Russian Far East. Dalian is one of the most well-known coastal tourism cities in northeastern China. It has many coastal resources which provide a multitude of recreational products (e.g., swimming, boating, birdwatching, fishing). While it has 2000 km of coastline, the most reputable and glamorous tourist attractions (e.g., Golden Pebble Beach, Fujiazhuang Park, Xinghai Beach, Xinghai Bay Artificial Beach) are centralized in the southern scenic waterfront area, as shown in Fig. 1.
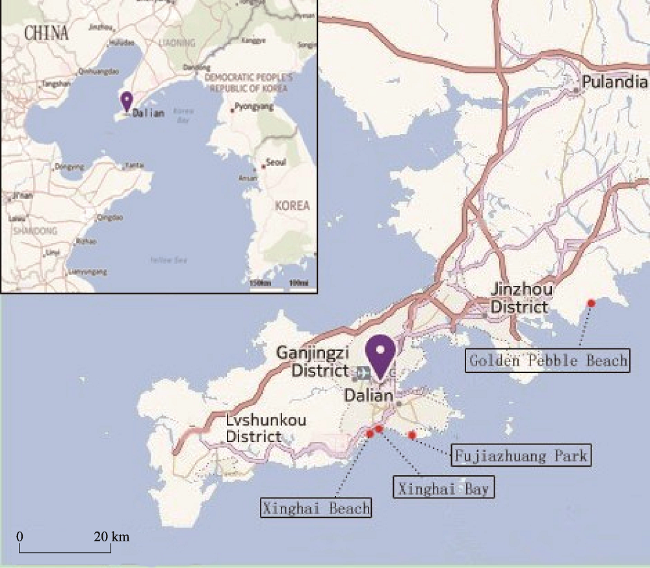
Fig. 1 Location of research sites in Dalian
The resource characteristics are distinctive for these four coastal parks. Golden Pebble Beach has a larger beach area, which is conducive for carrying out various tourist activities such as camping, barbecues and beach sports. The water quality of Fujiazhuang Park is the clearest, attracting a large number of tourists for swimming, boating and other water activities every year. Both Xinghai Bay Artificial Beach and Xinghai Beach are small in size, and their water quality and beach environments are of relatively lower quality. However, because of their locations closer to the urban areas, large numbers of citizens and tourists are attracted for leisure and entertainment. Overall, most of the beach spots are found in a relatively small coastal band of land in Dalian that consists of the beach park area (Zhong et al., 2011).
In recent years, the Dalian municipal government has developed a strategic plan for the city’s economic development. This plan states that coastal tourism is the driving force of the city’s economy. In this sense, several proposals have been developed to enhance the quality of the coastal beach environment (e.g., construction of the Golden Pebble Beach, and the Xinghai Bay artificial beach projects). Therefore, it is important to better understand tourists’ preferences for specific environmental attributes. The coastal value information can assist in the designing and marketing of tourism goods. Nevertheless, few relevant Dalian tourist studies have been carried out thus far (Wang et al., 2017).

3 Methods and data

3.1 Experimental design and data collection

This study presents the results of a valuation exercise which uses CE to estimate the benefits of the environmental attributes for a potential coastal program. The respondents are presented with several sets of choices, which are made up of various alternatives. Each alternative is comprised of a combination of several environmental attributes which reflect the improved outcomes. The composition of the attributes and their levels are varied systematically in each individual alternative, according to experimental design theory (Adamowicz et al., 1998).
As mentioned in the Study Area section, according to the main characteristics of the four coastal parks, the experimental design includes five attributes: beach type, garbage, crowding, water quality and cost. Detailed descriptions of the attribute levels and variables are summarized in Table 1. Specifically, the beach types include Cobblestone, Gravel, and Sand based on the real situations in each of the coastal parks. For the garbage and crowding levels, we combined the real and virtual situations. In terms of water quality, this study focuses on the recreational value from the tourists’ perspective, so the water quality is reflected through the visibility depth of the water on the seaside.
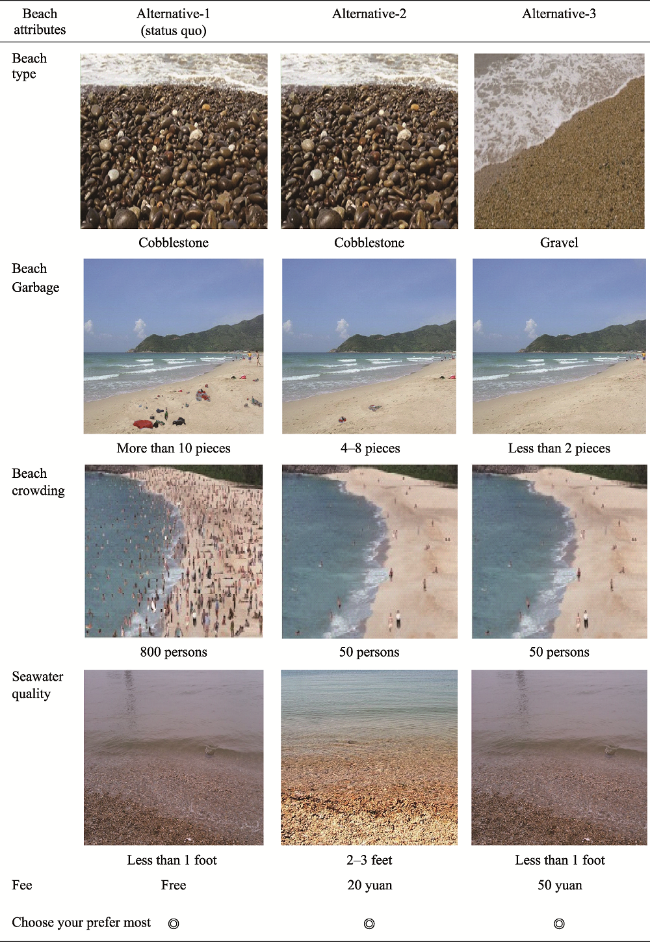
Table 1 Specifications of the beach attribute variables
Attributes Description Level Variable type Variable names
Beach type The material of beach Cobblestone Dummy variable BT_Stone
Gravel Dummy variable BT_Gravel
Sand Dummy variable BT_Sand
Beach garbage The amount of garbage on the coastline in the view < 2 pieces Dummy variable Garbage_low
4-8 pieces Dummy variable Garbage_med
> 10 pieces Dummy variable Garbage_high
Beach crowding Number of people in the view 50, 100, 300, 500, 800 persons Continuous variable Crowding
Water quality Visibility depth of the water on the seaside < 1 foot Dummy variable WaterQ_low
2-3 feet Dummy variable WaterQ_med
3-5 feet Dummy variable WaterQ_high
Cost Contribution fee to beach authority 0, 10, 20, 50, 70, 100 yuan Continuous variable Cost
All possible choice sets can be generated with a full factorial design. The total number of combinations of the four environment attributes and cost at different levels is 810 (3×3×5×3×6). In a practical sense, such large choice sets cannot be answered by each respondent (i.e., choosing one out of 180 choices). So, the orthogonal design method was adopted to decrease the number of choice sets (Louviere et al., 2000), and it reduced the number of profiles to 25 alternatives. However, the number of alternatives was still considered too large to allow clear and easy consideration by the respondents.
Ultimately, the number of choice sets was determined by following the procedures proposed in Street et al. (2005). Then the choice sets were randomly blocked into 12 versions. Each choice set included two assigned alternatives and a constant status quo alternative, and all levels of the attributes referred to the present situation. The respondents were asked to provide answers regarding their preferences for the different levels of attribute combinations across the alternatives in the choice sets. This meant that in one choice set each respondent had to choose either an improved environmental situation (Alternatives 2 or 3) or the current situation (Status quo-Alternative 1). The current environmental conditions of a study area constituted the unique status quo choice (Alternative 1).
Most tourists have no concept of WTP, and they are also not used to participating in this type of survey. Therefore, to facilitate the respondents’ understanding of the questionnaire, the survey was administrated in a field interview setting, with the assistance of photographs, to describe the hypothetical environmental quality changes. An illustration of one choice set is presented in Fig. 2.
Fig. 2 Example of choice set
The survey was comprised of three sections. The first section introduced the survey and contained the questions related to visitors’ attitudes towards environmental quality and their preferences for outdoor recreation activities. Other questions included the importance of natural settings and environmental factors, time spent on each activity, and respondents’ attitudes toward the environmental quality perceptions of the beach. The second part asked visitors about the motivations for their park visits. This information included the places they visit and their primary recreational activities. The final section included questions concerning respondents’ socio-economic status or demographics (i.e., age, gender, income, education, and residence).
The survey was designed in cooperation with Dalian tourism management personnel. A pilot test was conducted on small groups of visitors at Fujiazhuang Park and Xinghai Beach Park during the week of May 24-31, 2019. The final questionnaires were fine-tuned and re-tested during the focus visitor groups. The field survey took place at the end of July 2019, and lasted for ten days. Four sites were selected for the data collection. These sites cover the most important coastal recreational areas in Dalian: Golden Pebble Beach, Fujiazhuang Park, Xinghai Beach, and Xinghai Bay Artificial Beach (Fig. 1). These four sites accommodate the vast majority of the tourists who come to Dalian every year, accounting for approximately 90% of the annual visitation trips. This popularity is why these four sites are under extremely high environmental stress, especially during the peak of the tourism seasons.
The field survey was carried out by the investigators at each beach site. Questionnaires were distributed to the visitors who expressed a willingness to participate in the survey when intercepted by the investigators. Each survey form was filled out with the interviewer’s assistance, which ensured better response rates and questionnaire completeness. The final dataset was comprised of 630 completed questionnaires, collected from 733 interviews. The demographic results are presented in Appendix 1.
Appendix 1 Summary of the sample information
Demographics level Percent (%) Demographics level Percent (%)


Individual income
< 2000 yuan 33.7
Education
background
Junior high school or below 8.3
2000-2999 yuan 14.0 High school
3000-3999 yuan 17.1 Technical school 24.8
4000-4999 yuan 10.5 B.S. 34.9
5000-5999 yuan 11.1 M.S. and PhD 11.7
6000-6999 yuan 5.1

Residence
Dalian City (local) 55.2
> 7000 yuan 8.6 Other city of Liaoning
Province (Non-local)
17.8

Gender
Male
Female
49.2
50.8
Other provinces of China
(Non-local)
27.0

Sites
(sample from)


Golden pebble Beach
Xinghai Bay
Fujiazhuang Park
Xinghai Beach
26.0
19.4
28.6
26.0


Age
19-25
26-35
51-60
> 60
40.6
30.8
10.5
1.9
The analysis of the marginal utility of the environmental attribute changes encountered some problems since only the Crowding and Cost variables were set up as continuous variables in the survey questions. All the remaining attribute variables were set up as dummy variables to reflect the situation of the attribute as being either present or not present (Table 1).

3.2 Choice Experiments (CE)

CE have been widely applied in the fields of environmental management and evaluation (Nie et al., 2019), and reveal consumer preferences using the random utility approach (McFadden et al., 2000). Also, CE provide respondents with hypothetical change conditions while considering a decision process under multiple environmental attributes, as opposed to a single change through considering a consumer’s utility as a composite of the utilities originating from the multiple underlying characteristics of the goods consumed. Given that environmental services contain a number of underlying characteristics, CE provides a useful instrument for valuing environmental goods with multiple attributes and characteristics (Hanley et al., 2001).
According to the random utility theory, the representative individual is assumed to have a utility function that takes the following form:
$ {{U}_{ij}}=U({{X}_{ij}},\ {{S}_{j}}) $
This function can be decomposed into two parts: a deterministic element and a stochastic element. The deterministic element (V) is derived from any option which is assumed to depend on the attributes (X) (e.g., water quality, crowding of the surrounding, level of vegetation coverage) (Mendoza-González et al., 2018). At the same time, different socioeconomic characteristics (S) could also influence the level of utility (U). The socioeconomic characteristics are typically specified as a linear index of the attributes of the many j alternatives in a choice set. The stochastic element (e) considers the researcher’s unobservable effects on individual choices. Hence, Equation (1) can be re-written as:
$ {{U}_{ij}}=V({{X}_{ij}},\ {{S}_{j}})+e({{X}_{ij}},\ {{S}_{j}}) $
The probability that any particular respondent prefers option k in the choice set A over any alternative option i, can be expressed as the probability (Prob) that the utility associated with option k exceeds the utility associated with the other options. Thus:
$ \begin{matrix} & Prob(k)=Prob({{V}_{kj}}+{{e}_{kj}}>{{V}_{ij}}+{{e}_{ij}},\forall i\in A) \\ & =Prob({{V}_{kj}}-{{V}_{ij}}>{{e}_{ij}}-{{e}_{kj}},\forall i\in A) \end{matrix} $

3.3 Models

Data obtained from the questionnaires were analyzed using the conditional logit (CL), heteroscedastic logit (HL), and random parameter logit (RPL) models. The CL is a basic model in CE studies. CL has a typical assumption of independent and identical distribution, with the Type 1 extreme-value distribution. Hence, it offers a good starting point and benchmark for an analysis. However, the CL also assumes that the error variance is constant, usually being set to 1 across individuals. This assumption has been called into question, especially when comparing utility parameter vectors across two datasets. This is problematic because this assumption might mislead the hypothesis testing and cannot be separately identified from the vector of the utility parameter β (Louviere et al., 2002).
Therefore, in this study we also tested HL as an alternative model, as suggested by DeShazo et al. (2002). Since CL is limited by the Independence of Irrelevant Alternatives (IIA), it fails to account for the unobserved heterogeneity and potential correlations between the available choices. Given this limitation, more flexible approaches are desirable.
In this study, we also used the RPL model as another alternative for analyzing the preferences associated with the establishment of coastal tourism environmental programs. The RPL generalizes the CL by allowing the coefficients to vary randomly across individuals (Train, 1998). Therefore, RPL mitigates IIA and can represent any substitution pattern. Furthermore, the RPL explicitly accounts for unobserved heterogeneity (Carlsson et al., 2003).

4 Empirical results

As presented in Section 3 (Methods), we estimated the utility function parameters using the CL, HCL and RPL models. All of the attribute variables were included in each individual model, with the exception of the HCL model, which is specifically designed for analyzing the socio-economic effects. In addition, we assumed that each attribute in the RPL model has a normal distribution. For simplicity, the cost variable was treated as a fixed parameter to avoid the problem that a random distribution allowance could lead to unnecessary complications (Gelo and Koch, 2012).

4.1 Parameter estimates and model comparisons

Table 2 shows that the estimates of the utility parameters vary among the three models. According to the AIC criteria, the HCL and RPL models are both better than the CL model; and this is also evident by the results of the likelihood ratio (LR) test. The LR test shows a model’s fitness with the data. The CL is nested within the RPL, and the RPL is statistically preferred over the CL at the 0.01 significance level (2ΔLL=32.36>χ2(7) =18.48). Furthermore, the RPL results reveal that there is a significant preference heterogeneity, as the estimated standard deviations of both levels of the crowding (Crowding) and high-water quality (WaterQ_high) attributes are statistically significant (P<0.05).
Table 2 Parameter estimates under the CL, HCL and RPL models
Variables Model-1 (CL) Model-2 (HCL) Model-3 (RPL)
Coef. P>z Coef. P>z Coef. P>z
(for Coef.)
Coef.SD. P>z
(for Coef.SD.)
BT_Gravel -0.264 0.033 -0.221 0.176 -0.352 0.095 0.102 0.879
BT_Sand 0.067 0.656 0.037 0.751 -0.201 0.564 2.071 0.066
Garbage_med 0.497 0.000 0.376 0.053 0.899 0.014 1.403 0.049
Garbage_low 0.695 0.000 0.506 0.045 1.436 0.004 0.153 0.806
Crowding -0.002 0.000 -0.001 0.039 -0.002 0.000 0.003 0.016
WaterQ_med 0.202 0.182 0.089 0.465 0.264 0.319 -1.257 0.110
WaterQ_high 0.695 0.001 0.457 0.063 0.828 0.053 -2.894 0.038
Cost -0.016 0.000 -0.011 0.027 -0.020 0.000 - -
Age - - 0.019 0.766 - - - -
Gender - - -0.030 0.853 - - - -
Education - - 0.033 0.625 - - - -
Income - - 0.086 0.005 - - - -
Address - - -0.068 0.479 - - - -
No. params. - 8.000 - 13.000 - 15.000 - -
LR - 231.320 - 10.110 - 12.360 - -
Prob > chi2 - 0.000 - 0.072 - 0.089 - -
Log likelihood - -576.470 - -561.410 - -560.290 - -
AIC - 1168.940 - 1148.820 - 1150.580 - -

Note: Coef. represent the coefficient of models; P is the result of the z test.

Beach type (BT_Sand) shows statistical significance (P< 0.1). This result could be partly attributed to the well-known problem of heteroscedasticity, which causes the coefficient estimates in discrete choice models to be inconsistent (Yatchew and Griliches, 1985). Furthermore, it also reveals a behavioral interest in factors which influence the variance of the latent variables in the model (Louviere, 2001).
It is possible to compare the CL and HCL models, since the CL is nested within the HCL. Interestingly, the HCL is statistically preferred over the CL at the 0.01 level of significance (2ΔLL=30.12> χ2(5) =15.09). This manifests the presence of a discrete preference heterogeneity. The individual income variable has a significant positive effect on the visitor’s decision-making process. In contrast to the CL-HCL relationship, the HCL is not nested within the RPL. Therefore, it is not necessary to make a comparison test for these two models. However, the HCL agrees with the RPL, suggesting that a significant preference heterogeneity exists.
Furthermore, the RPL model can offer more information regarding the visitors’ preferences for the level of crowding and the water quality improvement. However, those preferences are heterogeneous between the groups. Therefore, according to the comparative analysis, we decided to use the RPL model to conduct a more thorough analysis of the tourism environment preferences.
The results of the RPL indicate that most of the estimated parameters are statistically significant (P<0.1), except for the variables of BT_Sand and WaterQ_med. As expected, the estimated cost parameter is negative, which is consistent with economic theory, and the so-called law of demand.
Regardless of whether the heterogeneity is considered, Crowding has a negative effect. Hence, visitors prefer to encounter fewer people on the site. It is interesting to note that the respondents display a lower sensitivity to the level of crowding, even at a higher level of crowding, because it has a lower estimated coefficient and odds radio in the statistical tests(The coefficient of the non-linear model cannot be directly interpreted as a marginal impact on the level of individual utility tourist’s decisions. Each odds ratio value is the multiplicative effect of a unit change of a given independent variable and the odds ratio=exp(bi), where bi is the coefficient of the models (Train, 2009).). This insensitivity may be due to the fact that the Chinese tourists are more accustomed to congestion in parks than visitors from other countries (since China has the highest population density in the world).
The tourists did not exhibit any differences in their preferences towards the features of sand and gravel characteristics between the beach sites. The remaining attributes are all positive and statistically significant by at least (P<0.1) in the RPL model. Garbage_med (4-8 pieces), Garbage_low (< 2 pieces) and WaterQ_high (Visibility depth 3-5 feet) all have higher estimated coefficient values and odds radio test results.
In summary, the visitors have stronger preferences for a reduction in the amount of garbage and an increase in water quality at the beaches, suggesting that the current levels of water quality and trash management are not satisfactory to the visitors.
None of the socio-economic variables were significant, except for the income variable in the HCL model. This implies that as the consumer’s income rises, they will more likely choose a higher willingness to pay value, while all other factors are held constant. Based on this result, the level of personal income is probably the primary factor that leads to the heterogeneous preferences among the respondents, although other potential factors could also cause the heterogeneous preferences. Therefore, it will be informative to conduct a welfare analysis using the RPL model, by subdividing the sample data into different groups based on the socio-economic criteria.

4.2 Welfare measurements from RPL

Although the preceding coefficient estimates could be used to assess the marginal effect-based odds ratios, unfortunately, they are not easily interpreted from a visitor’s point of view. To facilitate their interpretability from the welfare perspective, generic choice experiments often report the marginal WTP (MWTP). The MWTP can be interpreted as the average marginal WTP for a one-level change of each attribute (Train, 1998). Using a simple linear utility function, the marginal rate of substitution between an attribute and money is simply the ratio between the coefficient of that attribute and the marginal utility of money (Parsons and Kealy, 1992):
$ MRS=\frac{{\partial {{U}_{kj}}}/{\partial }\;{{X}_{j}}}{{\partial {{U}_{kj}}}/{\partial }\;{{y}_{k}}}=-\frac{{{\beta }_{j}}}{\lambda }=MWTP $
where βj is the coefficient of an analyzed attribute and λ is the cost coefficient. This ratio is often known as the implicit price. MWTP shows how much money an individual is willing to sacrifice for a decrease of one unit in the attribute level. In this study, all environmental attributes are designed as non-continuous variables in the models. Thus, strictly speaking, the ratios of the attribute coefficients and the marginal utility of money are not MWTP, since we cannot express a marginal change for a discrete variable. In such a case, the WTP measure is interpreted as the amount of money a respondent is willing to pay for a change in the attribute from, say, not available to available (Holmes and Boyle, 2005).
As for the compensating-variation welfare measurements, the MWTP from the RPL model states that any one of the chosen attributes with a relatively higher-level of improvement is able to generate a positive amount of welfare gain, as shown by the positive utility parameter estimates (Table 3). For instance, the average welfare gain from the factor of the trash amount (Garbage_low, less than two pieces) is larger than that of the other factors, according to the RPL model. This is followed by the garbage amount (Garbage_med, 4-8 pieces) and water quality (WaterQ_high, visibility depth 3-5 feet) variables.
Table 3 MWTP estimates under RPL models
Variable MWTP 90% confidence interval
BT_Stone 27.20 -
BT_Gravel -17.30 (-34.351, -0.249)
BT_Sand -9.90 -
Garbage_high -114.72 -
Garbage_med 44.17 (14.555, 73.794)
Garbage_low 70.55 (29.891, 111.247)
WaterQ_low -53.68 -
WaterQ_med 12.98 -
WaterQ_high 40.69 (6.060, 75.345)
Crowding -0.12 (-0.167, -0.072)

Note: Values in CNY (100 yuan is approximately equivalent to US$ 15).

Crowding has a smaller positive welfare gain resulting from the rate of the crowding level decrease. For example, 12 yuan will be gained as the congestion level is reduced to 100 people. This result is consistent with the previous analysis. However, the beach type (BT_Gravel) shows a unique significant negative welfare result (-17.3 yuan), which is worse than the base alternative of beach type (BT_Stone) of 27.2 yuan( Since we are using effects coded data, the WTP values for the attribute levels of the base alternative can be derived from the two estimated WTP values of the attributes in question as a negative sum of these two values (i.e. WTP-BT_Stone = WTP-BT_Gravel ×-1+WTP-BT_Sand×-1) (Juutinen et al., 2011).). Overall, the welfare analysis results are consistent with those of the former section of the visitor’s preference analysis.
Furthermore, the coefficients for garbage amount (Garbage_med), water quality (WaterQ_high) and the intensity of crowding (Crowding) are all statistically significant at P<0.05, according to the results of RPL model (Table 2). This may suggest that the level of utility is heterogeneous among the various groups of respondents, which is indicated by the group-specific parameters developed by this RPL model. Using the estimated individual parameter values for each random variable, we were able to generate the average marginal WTP for each subgroup of respondents using the information from the respondents’ characteristics (e.g., traveler generating region, types of activities, and travel purposes).
Table 4 reveals some significant differences, in terms of economic values, between the visitor groups. The attributes examined (e.g., traveler generating region, gender, level of education) show no significant effects on the WTP. The economic value differences only occur between the higher income and lower income visitor groups; and this result is supported by the HCL model. As to the site estimations, Site 2 (Xinghai Bay) and Site 4 (Xinghai Beach) both exhibit the highest WTP for the attribute of water quality (WaterQ_ high) among all of the attributes analyzed, which means that the visitors have a higher desire for water quality improvement from the current condition. In terms of the recreation activities, visitors who choose to participate in swimming and boating show the highest desire for the water quality improvement (59.83 yuan), and the next is “beach walk” (46.32 yuan). All of the different types of tourists have a strong tolerance for crowding, since the lowest WTP is only -0.2 yuan. The improvement of the garbage situation has a significant influence on the WTP of tourists who prefer to sunbathe (39.1 yuan). However, according to the last row in Table 4, garbage amount (Garbage_med, 4-8 pieces in the view) generates the highest mean WTP among all of the samples. Overall, this implies that the visitors have a strong preference for a reduction in the amount of garbage, especially at Site 2 (Xinghai Bay).
Table 4 MWTP for the random variables by groups under the RPL
Groups Garbage_med Water Q_high Crowding Number of obs. Number of respondents
Location 13.96 13.47 -0.17** 1044 348
Non Location 85.51 89.63 -0.03 846 282
male 49.82* 15.57 -0.13** 930 310
female 6.25 61.09** -0.10** 960 320
Income ≥ 5000 yuan 50.37* 141.64* -0.17** 468 156
Income < 5000 yuan 39.54** 59.37** -0.08** 1422 474
Edu ≤ high school -73.59 612.88 -1.55** 540 180
Edu > high school 51.76** 30.58 -0.10** 1350 450
Site 1: Gold pebble Beach 47.60 26.48 0.02 492 164
Site 2: Xinghai Bay 188.49** 225.20* -0.02 366 122
Site 3: Fujiazhuang Park 42.42 -38.75** -0.18** 540 180
Site 4: Xinghai Beach 15.52 194.79** -0.15** 492 164
Sunbathing 39.10** 23.64 -0.04 390 130
Swimming, boating 52.80 59.83* -0.13** 582 194
Beach walk 11.69 46.32** -0.13** 564 188
Barbecue, camping 144.92 -223.37 -0.20** 198 66
All samples 44.17**(8.88, 79.47) 40.69*(15.57, 81.98) -0.12**(-0.18, -0.06) 1890 630

Note: T-test statistical significance on the ** P<0.05, * P<0.1 level. 95% confidence intervals are in parenthesis.

5 Discussion and recommendations

The RPL model is used to estimate the WTP using sub-sample data. The results show that the amount of the visitors’ willingness to pay is strongly affected by the respondents’ income. The higher income groups would have a higher WTP based on the environmental attributes than the lower income groups. Among the sites analyzed, visitors at Site 2 (Xinghai Bay) and Site 4 (Xinghai Beach) show a higher WTP for water quality enhancement than the other sites. This implies that the current water quality in these two sites is not acceptable to the visitors, which concurs with the results in Termansen et al. (2013).
In relation to the recreation activities, the swimmers and boaters are much more sensitive to the sea water quality improvement. This result is consistent with the findings of Beharry-Borg and Scarpa (2010), where visitors who are interested in different recreation activities display divergent levels of willingness to pay for coastal water quality changes. According to the last row in Table 4, visitors exhibit the highest WTP for trash reduction, followed by high-water quality improvements. The results imply that the current sanitation and water quality levels at the sites are a far cry from being satisfactory to the visitors. This may be caused by the increasing of tourists’ demands of the coastal tourism experience, since tourists who engage in any of the various coastal recreational activities have higher expectations for water quality and beach sanitation than ever before.
In general, the level of crowding should have an important effect on the tourists’ recreation welfare or WTP (Kafle et al., 2015). However, it is interesting to note that the level of crowding does not exhibit stark influences on the respondents’ willingness to pay, though the crowding variable is statistically significant among the model tests. One possible reason for this is that the Chinese visitors seem to have a higher crowding tolerance and are less sensitive to crowding situations in the beach parks. This is perhaps due to the fact that they are more used to it. During peak tourism seasons, the vast majority of nature-based recreation sites are very crowded in China, so the crowding condition is quite consistent with tourists’ expectations.
Based on these findings, the following suggestions are recommended, with respect to coastal park management in Dalian, and elsewhere:
(1) The beach water quality should be monitored to inform visitors with accurate sea water quality information. The visitors should know whether the water quality in those swimming areas complies with the minimum swimming quality standards.
(2) Law enforcement personnel (e.g., sea police) should always be available to strengthen and safeguard the relevant environmental laws in the coastal park areas. The law-enforcement personnel’s primary task is to check the coastal environmental quality and investigate pollution sources. This surveillance should be conducted to ensure that the business operators in the surrounding areas, and the tourists, all behave in a legal and consistent manner. Otherwise, they must suffer the legal consequences.
(3) More sanitation workers must be hired by the beach park’s management, so that they can periodically remove algae, trash, and other pollutants from the beach park sites. This is an important task, because our results indicate that tourists who engage in recreation activities (e.g., sunbathing) strongly desire a high level of beach environmental quality. This desire was revealed through their marginal willingness to pay (MWTP).
In addition, management policies should give full consideration to the quality of the environment at the beach, public health, economics, and social aspects. The park authority should conduct regular checks of the beach facility. A routine visitors’ survey should also be conducted, to better understand consumer preferences and demands. Corrective measures must be taken as soon as any shortcomings are identified.
Considering the net benefits that may be gained from tourist recreational experiences, the forgoing results and discussion suggest that there is a lot of room for improvement over the coastal environmental conditions that exist currently, in terms of both individual attributes and overall attribute structures.

6 Conclusions

In this study, we applied the CL, HCL and RPL models to evaluate visitor preferences and WTP amounts for environmental quality improvements in the Dalian coastal parks. This was accomplished by analyzing field survey data. The main reason for using these three models at the same time was to determine which model performed the best and to clarify the potential value estimation differences under the various models. We provided a modeling process that used the HCL model to determine whether heterogeneity existed for the individual characteristics, then used the CL and RPL models to check for random effects or fixed effects. In the end, RPL was the optimal model for the research data in this paper. The results of the RPL model indicate that recreational participants tend to value higher water quality and trash reduction at the beach sites. This result is evidenced by the corresponding marginal value changes.
The socio-demographic characteristics of the tourists also play important roles in the prediction of their willingness to pay for the environmental enhancements specified by various attributes. In addition, we provide some recommendations to help improve coastal management policies. Thus, these research findings have some important implications for policy makers. More specifically, the results can be used by the environmental policy makers for impact assessment, risk management assessment, or cost-benefit analysis. They can also be used to evaluate the feasibility of a project for a coastal park investment, not only in Dalian, but also in any coastal park around the world which has challenges similar to those in Dalian.
[1]
Adamowicz W L, Boxall P, Williams M, et al. 1998. Stated preference approaches for measuring passive use values: Choice experiments and contingent valuation. American Journal of Agricultural Economics, 80(1):64-75.

DOI

[2]
Adamowicz W L, Louviere J, Williams M. 1994. Combining stated and revealed preference methods for valuing environmental amenities. Journal of Environmental Economics and Management, 26(3):271-292.

DOI

[3]
Beharry-Borg N, Scarpa R. 2010. Valuing quality changes in Caribbean coastal waters for heterogeneous beach visitors. Ecological Economics, 69(5):1124-1139.

DOI

[4]
Carlsson F, Frykblom P, Liljenstolpe C. 2003. Valuing wetland attributes: An application of choice experiments. Ecological Economics, 47(1):95-103.

DOI

[5]
Crouch G I, Oppewal H, Huybers T, et al. 2007. Discretionary expenditure and tourism consumption: Insights from a choice experiment. Journal of Travel Research, 45(3):247-258.

DOI

[6]
DeShazo J R, Fermo G. 2002. Designing choice sets for stated preference methods: The effects of complexity on choice consistency. Journal of Environmental Economics and Management, 44(7):123-143.

DOI

[7]
Díaz M R, Rodríguez T F E. 2016. Determining the sustainability factors and performance of a tourism destination from the stakeholders’ perspective. Sustainability, 8(9):951-968.

DOI

[8]
Eggert H, Olsson B. 2009. Valuing multi-attribute marine water quality. Marine Policy, 33(2):201-206.

DOI

[9]
Gelo D, Koch S F. 2012. Does one size fit all? Heterogeneity in the valuation of community forestry programs. Ecological Economics, 74(2):85-94.

DOI

[10]
Hanley N, Moutato S, Wright R E. 2001. Choice modeling approaches: A superior alternative for environment valuation. Journal of Economic Surveys, 15(7):436-462.

[11]
Holmes T P, Boyle K J. 2005. Dynamic learning and context dependence in sequential, attribute-based, stated-preference valuation questions. Land Economics, 81(1):114-126.

[12]
Liu X Z, Song L L, Chen S Y, et al. 2019. Assessment of environmental value loss of coastal tourism under the influence of red tide. Ocean Development and Management, 36(11):53-58.

[13]
Louviere J J. 2001. What if consumer experiments impact variances as well as means? Response variability as a behavioural phenomenon. Journal of Consumer Research, 28(12):506-511.

[14]
Louviere J J, Hensher D A, Swait J. 2000. Stated choice methods: Analysis and applications in marketing, transportation and environmental valuation. Cambridge, UK: Cambridge University Press.

[15]
Louviere J J, Street D, Carson R, et al. 2002. Dissecting the random component of utility. Marketing Letters, 13(3):177-193.

[16]
Juutinen A, Mitani Y, Maentymaa E, et al. 2011. Combining ecological and recreational aspects in national park management: A choice experiment application. Ecological Economics, 70(6):1231-1239.

[17]
Kafle A, Swallow S K, Smith E C. 2015. Does public funding affect preferred tradeoffs and crowd-in or crowd-out willingness to pay? A watershed management case. Environmental & Resource Economics, 60(3):471-495.

[18]
Kubo T, Uryu S, Yamano H, et al. 2020. Mobile phone network data reveal nationwide economic value of coastal tourism under climate change. Tourism Management, 77:104010. DOI: 10.1016/j.tourman.2019.104010.

DOI

[19]
McFadden D, Train K. 2000. Mixed MNL models of discrete response. Journal of Applied Econometrics, 15(5):447-470.

[20]
Mendoza-González G, Martínez M L, Guevara R, et al. 2018. Towards a sustainable sun, sea, and sand tourism: The value of ocean view and proximity to the coast. Sustainability, 10(4):10-12.

[21]
Mogas J, Riera P, Brey R. 2009. Combining contingent valuation and choice experiment: A forestry application in Spain. Environmental and Resources Economics, 43(4):535-551.

[22]
Nie X, Chen Q, Xiao T, et al. 2019. Willingness to pay for ecological function regions protection based on a choice experiment method: A case study of the Shiwandashan Nature Reserve. Quality & Quantity, 53(2):813-829.

[23]
Parsons G, Kealy M. 1992. Randomly drawn opportunity sets in a random utility model of lake recreation. Land Economics, 68:93-106.

[24]
Petrosillo I, Zurlini G, Corlianò, et al. 2007. Tourist perception of recreational environment and management in a marine protected area. Landscape & Urban Planning, 79(1):29-37.

[25]
Rodrigues L C, Jeroen C J M, van den Bergh, et al. 2016. The cost of mediterranean sea warming and acidification: A choice experiment among scuba divers at medes islands, Spain. Environmental & Resource Economics, 63(2):1-23.

[26]
Street D J, Burgess L, Louviere J J. 2005. Quick and easy choice sets: Constructing optimal and nearly optimal stated choice experiments. International Journal of Research in Marketing, 22(4):459-470.

DOI

[27]
Termansen M, Colin J, McClean, et al. 2013. Modeling and mapping spatial heterogeneity in forest recreation services. Ecological Economics, 92(8):48-57.

[28]
Train K E. 1998. Recreation demand models with taste differences over people. Land Economics, 74(2):230-239.

[29]
Train K E. 2009. Discrete choice: Methods with simulation. Cambridge, UK: Cambridge University Press.

[30]
Wang E D, Wei J H, Zhu J. 2017. The effects of improving coastal park attributes on the recreation demand—A case study in Dalian, China. Tourism Economics, 23(1):133-149.

DOI

[31]
Yang X P, Weng G M, Li J, et al. 2019. Optimization of tourism environment carrying capacity in coastal cities: A case study of Qinhuangdao City. Geography and Geo-Information Science, 35(4):134-140.

[32]
Yatchew A, Griliches Z. 1985. Specification error in probit models. Review of Economics and Statistics, 67(1):134-139.

[33]
Zhang K X, Wang X L, Shi J Y, et al. 2020. Residents’ perception of the recreational value of forest parks: A case study in Shanghai, China. Journal of Resources and Ecology, 11(4):425-434.

[34]
Zhong L S, Deng J Y, Song Z W, et al. 2011. Research on environmental impacts of tourism in China: Progress and prospect. Journal of Environmental Management, 92(11):2972-2983.

DOI PMID

Outlines

/