
Journal of Resources and Ecology >
Temporal and Spatial Characteristics and Evolution of China’s Inbound Tourism Carbon Footprint
|
HAN Zhiyong, E-mail: 812404918@qq.com |
Received date: 2020-06-16
Accepted date: 2020-09-01
Online published: 2021-03-30
Supported by
National Natural Science Foundation of China(42001155)
National Natural Science Foundation of China(41571139)
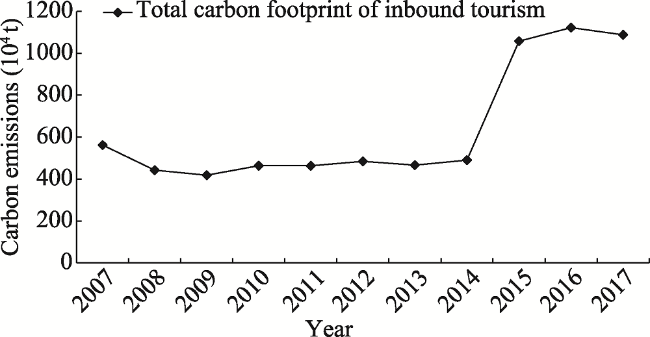
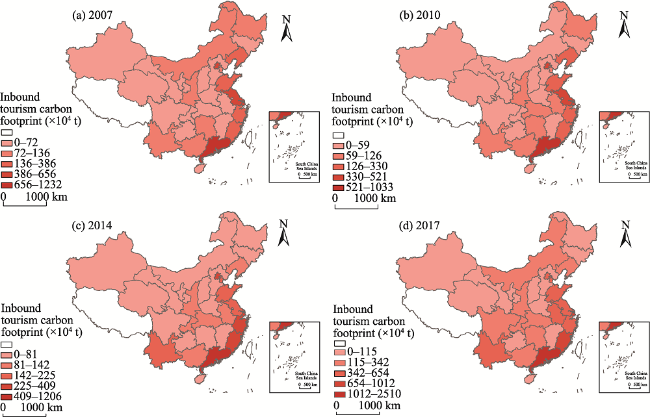
Reducing carbon emissions and transitioning to a low-carbon economy are important propositions for human sustainability. Since it is closely related with high carbon emissions, international travel makes a substantial contribution to the global carbon emissions. To comprehensively explore the influence of international travel on carbon emissions and develop a sustainable development plan, this paper studies the temporal and spatial distribution and evolution of the carbon footprint of inbound tourism in China’s 30 provinces between 2007 and 2017. In this study, comprehensive calculations and spatial models are adopted to reveal the temporal and spatial characteristics. The results show that the carbon footprint of inbound tourism in China has been increasing continuously from 2007 to 2017. While the carbon footprint increased by 1.94-fold, from 5.623 million tons to 10.8809 million tons, it presented obvious fluctuations by initially increasing rapidly and then dropping slightly. From the perspective of the contributions of various tourism components on the carbon footprint, transportation and post and telecommunications account for the largest proportions. In the past ten years, the variations in the carbon footprint of inbound tourism in most provinces and cities in China were not very extreme, but maintained a relatively stable state. In the spatial dimension, the carbon footprint of China’s inbound tourism tends to decrease from the southeast to the northwest. The highest coefficient of variation is in Ningxia and the lowest is in Liaoning. Based on these results, recommendations are put forward for sustainable development plans in some major cities and provinces for the future.
HAN Zhiyong , LI Tao , LIU Ximei . Temporal and Spatial Characteristics and Evolution of China’s Inbound Tourism Carbon Footprint[J]. Journal of Resources and Ecology, 2021 , 12(1) : 56 -67 . DOI: 10.5814/j.issn.1674-764x.2021.01.006
Table 1 Carbon emission coefficients of comprehensive energy consumption for the provinces of China (g MJ-1) |
| Province | Average carbon emission coefficient | Province | Average carbon emission coefficient |
|---|---|---|---|
| Guizhou | 23.82 | Hubei | 22.06 |
| Gansu | 23.64 | Tianjin | 21.78 |
| Liaoning | 23.50 | Fujian | 21.68 |
| Shanxi | 23.50 | Shandong | 21.61 |
| Inner Mongolia | 23.39 | Hainan | 20.82 |
| Hebei | 23.16 | Jiangsu | 20.80 |
| Henan | 23.10 | Beijing | 20.72 |
| Hunan | 23.04 | Guangxi | 20.65 |
| Xinjiang | 23.03 | Chongqing | 20.61 |
| Yunnan | 22.85 | Zhejiang | 20.59 |
| Anhui | 22.41 | Shaanxi | 20.54 |
| Jilin | 22.37 | Guangdong | 20.45 |
| Heilongjiang | 22.21 | Sichuan | 20.32 |
| Ningxia | 22.18 | Qinghai | 20.25 |
| Jiangxi | 22.08 | Shanghai | 20.13 |
Note: Research data has excluded Chinese Tibet, Hong Kong, Macao and Taiwan. |
Table 2 Stripping coefficient of inbound tourism consumption (unit: %) |
| Year | 2007 | 2008 | 2009 | 2010 | 2011 | 2012 | 2013 | 2014 | 2015 | 2016 | 2017 |
|---|---|---|---|---|---|---|---|---|---|---|---|
| (TPTS)sc | 6.85 | 6.30 | 5.80 | 5.63 | 5.26 | 5.23 | 4.69 | 4.80 | 10.11 | 10.36 | 9.39 |
| (ARCS)sc | 5.80 | 3.66 | 3.27 | 3.24 | 2.54 | 2.14 | 1.98 | 1.93 | 3.93 | 3.31 | 3.33 |
| (ECLS)sc | 1.47 | 1.14 | 0.96 | 0.92 | 0.81 | 0.70 | 0.63 | 0.60 | 1.01 | 1.14 | 1.02 |
Note: TPTS represents transportation and post-telecommunications; ARCS represents accommodation, retail and catering; ECLS represents entertainment and consumption for living; sc represents stripping coefficient. |
Table 3 Carbon footprint of inbound tourism in China from 2007 to 2017 (´104 t ) |
| Year | 2007 | 2008 | 2009 | 2010 | 2011 | 2012 | 2013 | 2014 | 2015 | 2016 | 2017 |
|---|---|---|---|---|---|---|---|---|---|---|---|
| (TPTS)cf | 451.66 | 316.48 | 300.95 | 334.27 | 341.96 | 372.79 | 357.66 | 382.51 | 848.85 | 899.97 | 867.81 |
| (ARCS)cf | 41.52 | 45.97 | 45.89 | 55.77 | 50.88 | 46.89 | 46.07 | 45.93 | 98.32 | 87.14 | 91.01 |
| (ECLS)cf | 69.11 | 79.93 | 71.55 | 73.43 | 70.33 | 64.63 | 62.75 | 61.76 | 110.40 | 135.14 | 129.23 |
| Total | 562.30 | 442.37 | 418.38 | 463.48 | 463.18 | 484.31 | 466.48 | 490.20 | 1057.56 | 1122.25 | 1088.09 |
Note: TPTS represents transportation and post-telecommunications; ARCS represents accommodation, retail and catering; ECLS represents entertainment and consumption for living; cf represents carbon footprint. |
Table 4 Correction factors of carbon emission intensity for the provinces and cities of China |
| Province | Correction factor | Province | Correction factor |
|---|---|---|---|
| Beijing | 0.95 | Henan | 1.05 |
| Tianjin | 0.99 | Hubei | 1.01 |
| Hebei | 1.06 | Hunan | 1.05 |
| Shanxi | 1.07 | Guangdong | 0.93 |
| Inner Mongolia | 1.07 | Guangxi | 0.94 |
| Liaoning | 1.07 | Hainan | 0.95 |
| Jilin | 1.02 | Chongqing | 0.94 |
| Heilongjiang | 1.01 | Sichuan | 0.93 |
| Shanghai | 0.92 | Guizhou | 1.09 |
| Jiangsu | 0.95 | Yunnan | 1.04 |
| Zhejiang | 0.94 | Shaanxi | 0.94 |
| Anhui | 1.02 | Gansu | 1.08 |
| Fujian | 0.99 | Qinghai | 0.92 |
| Jiangxi | 1.01 | Ningxia | 1.01 |
| Shandong | 0.99 | Xinjiang | 1.05 |
Note: Research data has excluded Chinese Tibet, Hong Kong, Macao and Taiwan. |
Table 5 Calculation results of the carbon footprint of inbound tourism in China from 2007 to 2017 (´104 t) |
| Province | 2007 | 2008 | 2009 | 2010 | 2011 | 2012 | 2013 | 2014 | 2015 | 2016 | 2017 |
|---|---|---|---|---|---|---|---|---|---|---|---|
| Beijing | 65.65 | 47.03 | 40.71 | 42.63 | 39.84 | 35.51 | 32.68 | 32.93 | 64.44 | 72.67 | 65.35 |
| Tianjin | 11.73 | 11.10 | 11.62 | 12.61 | 13.57 | 16.14 | 18.56 | 22.47 | 48.51 | 53.59 | 50.24 |
| Hebei | 4.95 | 3.23 | 3.22 | 3.31 | 3.68 | 4.20 | 4.46 | 4.27 | 7.85 | 8.85 | 8.24 |
| Shanxi | 3.60 | 3.60 | 4.01 | 4.45 | 4.73 | 5.63 | 6.36 | 2.28 | 4.72 | 5.16 | 5.06 |
| Inner Mongolia | 8.82 | 6.87 | 5.89 | 5.74 | 5.57 | 6.01 | 7.40 | 8.09 | 15.20 | 18.43 | 17.91 |
| Liaoning | 19.96 | 18.26 | 19.67 | 21.65 | 22.63 | 25.53 | 26.88 | 13.11 | 25.97 | 29.65 | 25.69 |
| Jilin | 2.78 | 2.41 | 2.45 | 2.78 | 3.06 | 3.68 | 4.06 | 4.50 | 10.94 | 12.24 | 10.53 |
| Heilongjiang | 9.87 | 9.84 | 6.40 | 6.91 | 7.23 | 6.18 | 4.42 | 4.32 | 5.93 | 7.04 | 6.55 |
| Shanghai | 65.08 | 50.95 | 43.07 | 52.06 | 41.10 | 36.81 | 34.73 | 38.89 | 79.67 | 89.39 | 82.91 |
| Jiangsu | 49.92 | 41.08 | 37.68 | 40.58 | 41.74 | 43.61 | 16.28 | 21.75 | 49.55 | 54.73 | 53.65 |
| Zhejiang | 38.57 | 31.70 | 29.94 | 33.00 | 33.20 | 35.31 | 36.52 | 40.86 | 94.40 | 44.55 | 45.40 |
| Anhui | 5.33 | 5.18 | 5.72 | 6.48 | 9.38 | 11.66 | 12.24 | 14.22 | 34.25 | 39.41 | 39.69 |
| Fujian | 32.54 | 26.41 | 25.42 | 26.33 | 27.97 | 30.49 | 32.61 | 36.72 | 81.43 | 99.37 | 101.15 |
| Jiangxi | 2.99 | 2.83 | 2.89 | 3.12 | 3.25 | 3.56 | 3.81 | 4.24 | 8.45 | 8.93 | 8.55 |
| Shandong | 20.21 | 15.30 | 17.21 | 18.99 | 19.57 | 21.03 | 19.41 | 17.37 | 42.27 | 45.79 | 42.17 |
| Henan | 5.08 | 4.40 | 4.51 | 4.70 | 4.50 | 4.70 | 5.01 | 4.29 | 9.73 | 10.33 | 9.40 |
| Hubei | 6.30 | 4.97 | 5.08 | 6.76 | 7.36 | 8.83 | 8.84 | 9.42 | 24.91 | 28.57 | 28.55 |
| Hunan | 10.24 | 7.24 | 6.99 | 8.51 | 8.30 | 7.12 | 6.23 | 6.36 | 13.35 | 16.01 | 18.35 |
| Guangdong | 123.16 | 95.51 | 92.50 | 103.27 | 100.95 | 106.26 | 109.50 | 120.65 | 247.00 | 262.80 | 250.98 |
| Guangxi | 8.24 | 6.32 | 5.99 | 6.79 | 7.71 | 8.79 | 10.51 | 11.20 | 26.73 | 30.92 | 30.42 |
| Hainan | 4.34 | 3.33 | 2.60 | 2.74 | 2.78 | 2.41 | 2.31 | 1.93 | 3.49 | 5.04 | 8.72 |
| Chongqing | 5.45 | 4.72 | 4.99 | 5.91 | 7.08 | 8.01 | 8.60 | 9.63 | 20.44 | 24.05 | 24.68 |
| Sichuan | 7.20 | 1.59 | 2.64 | 2.93 | 4.28 | 5.40 | 5.11 | 6.01 | 16.20 | 22.23 | 18.07 |
| Guizhou | 2.13 | 1.42 | 1.19 | 1.26 | 1.14 | 1.34 | 1.58 | 1.55 | 3.72 | 4.16 | 4.15 |
| Yunnan | 13.59 | 11.72 | 12.08 | 12.33 | 13.05 | 14.81 | 18.18 | 19.08 | 44.37 | 48.60 | 49.88 |
| Shaanxi | 8.70 | 6.90 | 7.14 | 8.51 | 9.44 | 10.92 | 11.32 | 12.53 | 27.75 | 33.23 | 34.15 |
| Gansu | 1.15 | 0.19 | 0.13 | 0.14 | 0.15 | 0.18 | 0.16 | 0.08 | 0.23 | 0.31 | 0.30 |
| Qinghai | 0.22 | 0.11 | 0.14 | 0.17 | 0.19 | 0.16 | 0.13 | 0.17 | 0.53 | 0.62 | 0.48 |
| Ningxia | 0.04 | 0.03 | 0.04 | 0.05 | 0.05 | 0.04 | 0.09 | 0.14 | 0.31 | 0.62 | 0.51 |
| Xinjiang | 2.58 | 1.59 | 1.42 | 1.74 | 3.80 | 4.22 | 4.43 | 3.95 | 8.65 | 8.26 | 11.48 |
Note: Research data has excluded Chinese Tibet, Hong Kong, Macao and Taiwan. |
Fig. 1 Total carbon footprint of China’s inbound tourism from 2007 to 2017 |
Table 6 Mean and CV of carbon footprint of inbound tourism in China's provinces from 2007 to 2017 |
| Province | Mean of carbon footprint (×104 t) | Coefficient of variation | Province | Mean of carbon footprint (×104 t) | Coefficient of variation |
|---|---|---|---|---|---|
| Guangdong | 161.26 | 0.41 | Hunan | 10.87 | 0.37 |
| Shanghai | 61.46 | 0.31 | Inner Mongolia | 10.59 | 0.45 |
| Beijing | 53.94 | 0.26 | Sichuan | 9.17 | 0.73 |
| Fujian | 52.04 | 0.56 | Heilongjiang | 7.47 | 0.23 |
| Zhejiang | 46.34 | 0.37 | Henan | 6.67 | 0.35 |
| Jiangsu | 45.06 | 0.26 | Jilin | 5.94 | 0.61 |
| Shandong | 27.93 | 0.40 | Hebei | 5.63 | 0.36 |
| Tianjin | 27.02 | 0.61 | Jiangxi | 5.26 | 0.46 |
| Yunnan | 25.77 | 0.58 | Xinjiang | 5.21 | 0.61 |
| Liaoning | 24.90 | 0.18 | Shanxi | 4.96 | 0.21 |
| Anhui | 18.36 | 0.72 | Hainan | 3.97 | 0.46 |
| Shaanxi | 17.06 | 0.60 | Guizhou | 2.36 | 0.50 |
| Guangxi | 15.36 | 0.62 | Gansu | 0.30 | 0.94 |
| Hubei | 13.96 | 0.65 | Qinghai | 0.29 | 0.60 |
| Chongqing | 12.36 | 0.60 | Ningxia | 0.19 | 1.04 |
Note: Research data has excluded Chinese Tibet, Hong Kong, Macao and Taiwan. |
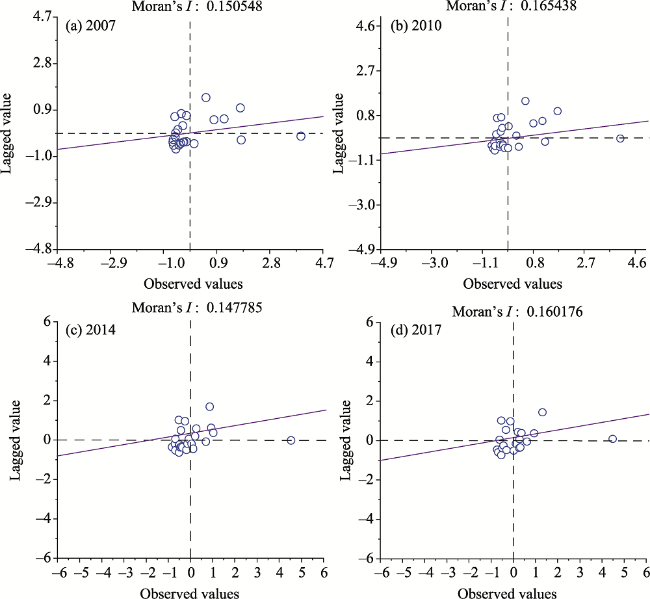
Fig. 2 Scatter plots of Moran’s I (2007, 2010, 2014, 2017) |
Fig. 3 Spatial distribution of the inbound tourism carbon footprint in 2007, 2010, 2014 and 2017.Note: Research data has excluded Chinese Tibet, Hong Kong, Macao and Taiwan. |
The authors thank to The Innovation and Entrepreneurship Doctoral Fund of Jiangsu Province (to Li Tao).
| [1] |
|
| [2] |
|
| [3] |
|
| [4] |
|
| [5] |
|
| [6] |
|
| [7] |
|
| [8] |
|
| [9] |
|
| [10] |
|
| [11] |
|
| [12] |
|
| [13] |
|
| [14] |
|
| [15] |
|
| [16] |
|
| [17] |
|
| [18] |
|
| [19] |
|
| [20] |
|
| [21] |
|
| [22] |
|
| [23] |
|
| [24] |
|
| [25] |
National Tourism Administration of the People’s Republic of China. 2019. Tourist sample survey data. Beijing, China: China Tourism Press.
|
| [26] |
|
| [27] |
|
| [28] |
|
| [29] |
|
| [30] |
|
| [31] |
|
| [32] |
|
| [33] |
|
| [34] |
|
| [35] |
|
| [36] |
|
| [37] |
|
| [38] |
|
| [39] |
|
| [40] |
|
| [41] |
|
| [42] |
|
| [43] |
|
| [44] |
|
| [45] |
|
| [46] |
|
| [47] |
|
| [48] |
|
| [49] |
|
| [50] |
|
| [51] |
|
| [52] |
|
/
| 〈 |
|
〉 |