
Journal of Resources and Ecology >
Policy Assessment and Recommendations for Forestry-based Ecological Poverty Alleviation: An Empirical Study from the Prefectures of Nujiang and Aba, Southwestern China
|
WANG Yaming, E-mail: v_wym@163.com |
Received date: 2020-08-21
Accepted date: 2020-09-22
Online published: 2021-03-30
Supported by
Economic Development Research Center of National Forestry and Grassland Administration Research Project(JYC2018-101)
China has adopted a long-term campaign against poverty. In recent decades, there is an increasing understanding that ecological poverty alleviation can meet the dual goals of environmental protection and rural poverty reduction. China is pivoting towards forestry-based poverty reduction in the severely poverty-stricken areas. However, several key factors remain elusive, including the extent to which the poor people benefit from forestry programs, whether they are satisfied with the policies and whether the policies are effective for poverty alleviation. Based on data collected through a questionnaire survey of 79 households in the prefectures of Nujiang and Aba, southwestern China, the analytic hierarchy process (AHP) approach was used to examine the effectiveness of the forestry-based poverty alleviation policy. The results showed that four poverty alleviation pathways, including industry, employment, micro-finance and pairing assistance in villages, had obviously increased the incomes of the filing poor households and solved the problem of “Two Worries-free and Three Guarantees”. The poor were satisfied with the forestry-based ecological poverty alleviation policies and these policies had good effects in fighting against poverty. However, there are still some shortcomings, such as a lack of active participation, imperfect targeted identification, lack of funds and limited sources of funds during the policy implementation. Our results highlight the importance of the forestry industry and the public welfare position in the alleviation of poverty in the poverty-stricken areas. Synergies between ecological protection and poverty reduction are possible through sound forestry-based policies. This article recommends five policies to simultaneously realize the potential of poverty alleviation and environment protection through forestry development.
WANG Yaming , QIN Fanding , ZHAO Guangshuai , FENG Qinliang , WU Qiong , LI Yang , YI Xutong . Policy Assessment and Recommendations for Forestry-based Ecological Poverty Alleviation: An Empirical Study from the Prefectures of Nujiang and Aba, Southwestern China[J]. Journal of Resources and Ecology, 2021 , 12(1) : 110 -123 . DOI: 10.5814/j.issn.1674-764x.2021.01.011
Table 1 Sources of samples in the studied prefectures of Nujiang and Aba |
| Prefectures | Counties | Townships | Numbers of samples | Percent (%) | Numbers of poor households samples | Percent (%) |
|---|---|---|---|---|---|---|
| Nujiang Prefecture | Lanping County | Zhongpai Town | 19 | 10.5 | 5 | 6.33 |
| Lajing Town | 7 | 3.87 | 6 | 7.59 | ||
| Shideng Town | 13 | 7.18 | 5 | 6.33 | ||
| Tu’e Town | 20 | 11.05 | 8 | 10.13 | ||
| Fugong County | Jiakedi Town | 12 | 6.63 | 6 | 7.59 | |
| Pihe Town | 18 | 9.94 | 5 | 6.33 | ||
| Shangpa Town | 19 | 10.5 | 4 | 5.06 | ||
| Lushui County | Pianma Town | 11 | 6.08 | 4 | 5.06 | |
| Gudeng Town | 18 | 9.94 | 8 | 10.13 | ||
| Aba Prefecture | Aba County | Kuasha Town | 12 | 6.63 | 12 | 15.19 |
| Hongyuan County | Hongyuan County | 16 | 8.84 | 16 | 20.25 | |
| Li County | Li County | 16 | 8.84 | 0 | 0.00 | |
| Total | 181 | 100 | 79 | 100 | ||
Table 2 Questionnaire design on the living conditions and forestry-based modes of poverty reduction |
| Survey category | Sub-categories | Main surveyed questions |
|---|---|---|
Two Worries-free and Three Guarantees | Two worries-free | No worries of food and clothing. Questions include: $\bullet$ Do you have enough food? percentage of total income expended on food $\bullet$ Source of drinking water and whether water supply is safe or not $\bullet$ If you have seasonal clothes, quilts and shoes at home |
Three guarantees | Including basic and serious illness medical insurance, compulsory education and safe housing: $\bullet$ Have you benefited from the renovation policy of dangerous houses since 2014 and has your old house been renovated? $\bullet$ Is the individual payment part of medical insurance subsidized by government finances? $\bullet$ Are the medical expenses reduced compared with before? | |
| Forestry-based modes of poverty reduction | Forestry-based small industry | $\bullet$ Have you had financial or material support to develop your own industry? $\bullet$ Can the developed industries bring long-term stable income for poor households? $\bullet$ Has your business cooperated or linked with enterprises, cooperatives and large households? $\bullet$ Are you a member or shareholder of a cooperative? $\bullet$ How is the operation of the cooperative? $\bullet$ If the cooperative pays dividends, does it participate in the production and operation of the cooperative? $\bullet$ Is it helpful to increase the family’s income after receiving the industrial poverty alleviation and assistance measures? |
| Forestry-based employment | $\bullet$ How many family members have taken part in forestry employment training after filing as a poor household? $\bullet$ Is the training helpful for your finding jobs or increasing employment income? $\bullet$ How many people in your family have gone out to work or work locally through the government organization after filing? $\bullet$ Among them, how many family members participated in public welfare jobs? $\bullet$ Is it helpful to increase family income after obtaining employment assistance measures? | |
| Micro-finance | $\bullet$ Do you know about microfinance for poverty alleviation? $\bullet$ Has your family ever lent a small loan? If yes, how much and what is the loan interest? Did the bank require a mortgage and guarantee? $\bullet$ What is the main purpose of the loan? Does it help your family to increase income? Yes or no, and why? | |
| Village responsible assistance | $\bullet$ Is there a village pairing assistance team in the village? $\bullet$ What are the main tasks of the village team? Are you satisfied with its work? $\bullet$ Does your family have a responsible person in charge of helping? What did he do to help your family and is it helpful for your family? |
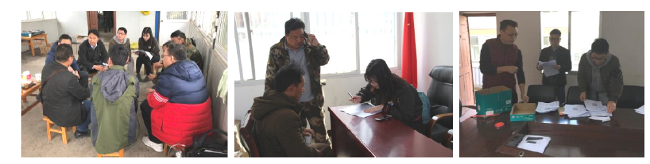
Fig. 1 Questionaire and interview conductions in Nujiang Prefecture |
Table 3 Hierarchical structure of forestry-based poverty alleviation policy assessment |
| First level (A) | Second level (B) | Third level (C) |
|---|---|---|
A1 Policy making | B1 Precise policy objectives 0.900(0.249) | C1 Income increase 1.00(0.199) |
| C2 Living condition improvement 1.00(0.201) | ||
| C3 Environment improvement 1.00(0.200) | ||
| C4 Management institution of forestry development 1.00(0.200) | ||
| C5 Improving social stability in poor areas 0.50(0.200) | ||
| B2 Scientific policy options 1.000(0.251) | C6 Orientation of policy making 1.000(0.250) | |
| C7Adaptability of policy making 1.000(0.200) | ||
| C8 Innovation of policy making 1.000(0.200) | ||
| C9 Flexibility of Policy making 0.500(0.200) | ||
| B3 Rational policy measurement 0.900(0.250) | C10 Poverty alleviation in agro-forestry industry 1.000(0.143) | |
| C11 Ecological transfer payment for poverty alleviation 1.000(0.143) | ||
| C12 Forestry vocational training 1.000(0.143) | ||
| C13 Ecological compensation for poverty alleviation 1.000(0.143) | ||
| C14 Social poverty alleviation 1.000(0.143) | ||
| C15 Forestry finance poverty alleviation 1.000(0.142) | ||
| C16 Forestry relocation 1.000(0.143) | ||
| B4 Complete decision making process 0.900(0.249) | C17 Public awareness of policy decision making 1.000(0.199) | |
| C18 Public participation in policy decision making 0.500(0.201) | ||
| C19 Scientific policy decision making method 1.000(0.200) | ||
| C20 Legal procedures for policy decision making 1.000(0.200) | ||
| C21 Transparency of policy decision making 1.000(0.200) | ||
A2 Policy implementation | B5 Precise identification of the poor population 0.685(0.331) | C22 Identification system for poor population 1.000(0.199) |
| C23 Information system of the poor population 1.000(0.201) | ||
| C24 Complete account of the poor population 1.000(0.200) | ||
| C25 Underreporting rate of poor people 0.185(0.200) | ||
| C26 Misreporting rate of poor people 0.105(0.200) | ||
| B6 Implementation of poverty alleviation 0.750(0.335) | C27 Reasonable poverty alleviation program 0.500(0.166) | |
| C28 Appropriate measures for poverty alleviation 0.500(0.167) | ||
| C29 Intervention means of poverty alleviation 1.000(0.167) | ||
| C30 Scientific cause analysis of poverty 1.000(0.166) | ||
| C31 Improving measures of poverty alleviation 1.000(0.167) | ||
| C32 Family visit records 0.500(0.167) | ||
| B7 Village staff of poverty alleviation 0.810(0.334) | C33 Cognitive level of poverty alleviation 1.000(0.143) | |
| C34 Willingness and attitudes towards poverty alleviation 1.000(0.143) | ||
| C35 Production technology level 1.000(0.143) | ||
| C36 Marketing skills of forestry products 0.500(0.143) | ||
| C37 Communicative competence and level 0.500(0.143) | ||
| C38 Mediation ability of forest right disputes 1.000(0.143) | ||
| C39 Number of staff 0.667(0.142) | ||
A3 Policy guarantee | B8 Policy guarantee 1.000(0.333) | C40 Policy completeness 1.000(0.498) |
| C41 Policy feasibility 1.000(0.502) | ||
| B9 Human resource guarantee 0.786(0.333) | C42 Personnel management system 0.500(0.143) | |
| C43 Implementation of main responsibility 1.000(0.143) | ||
| C44 Five level working mechanism 0.500(0.143) | ||
| C45 Organization construction 0.500(0.143) | ||
| C46 Service evaluation 1.000(0.143) | ||
| C47 Stationing of personnel 1.000(0.143) | ||
| C48 Connection of helper and the poor 1.000(0.142) | ||
| First level (A) | Second level (B) | Third level (C) |
| B10 Investment guarantee 0.750(0.334) | C49 Total investment 1.000(0.200) 1.000(0.498) | |
| C50 Diversity of funding sources 1.000(0.502) | ||
A4 Policy effectiveness | B11 Economic performance 0.857(0.249) | C51 Increase of forestry income level 1.000(0.143) |
| C52 Upgrading of rural forestry industry 0.500(0.143) | ||
| C53 Improvement of rural infrastructure 0.500(0.142) | ||
| C54 Growth of household income 1.000(0.143) | ||
| C55 Growth of household wealth stock 1.000(0.143) | ||
| C56 Improvement of farmers’ living conditions 1.000(0.0.143) | ||
| C57 Improvement of farmers’ drinking water conditions 1.00(0.143) | ||
| B12 Social performance 0.831(0.251) | C58 Reduction rate of file-recorded poor people 1.000(0.111) | |
| C59 The exit rate of poor towns 0.367(0.111) | ||
| C60 The exit rate of poor villages 0.667(0.111) | ||
| C61 The exit rate of the poor population 0.600(0.111) | ||
| C62 Coverage rate of rural endowment insurance 0.846(0.111) | ||
| C63 Coverage rate of rural cooperative medical system / serious illness medical treatment 1.000(0.112) | ||
| C64 Coverage rate of rural compulsory education 1.000(0.111) | ||
| C65 Social stability of forest area 1.000(0.111) | ||
| C66 Promotion of ecological awareness 1.000(0.111) | ||
| B13 Ecological performance 0.752(0.251) | C67 Forest coverage 1.000(0.111) | |
| C68 Green coverage rate of villages 0.667(0.111) | ||
| C69 Improvement of forest structure 1.000(0.111) | ||
| C70 Transformation of low quality forests 1.000(0.111) | ||
| C71 Prevention and control of forest diseases and insects 0.70(0.11) | ||
| C72 Growth rate of woodland area 0.300(0.111) | ||
| C73 Harmless treatment rate of feces 0.500(0.111) | ||
| C74 Effective sewage treatment rate 1.000(0.111) | ||
| C75 Effective garbage treatment rate 0.600(0.111) | ||
| B14 Subjective satisfaction 0.750(0.249) | C76 Satisfaction with policy making 1.000(0.249) | |
| C77 Satisfaction of policy implementation 0.500(0.251) | ||
| C78 Satisfaction of policy guarantee 1.000(0.250) | ||
| C79 Satisfaction of policy effect 1.000(0.250) |
Note: Data are the policy score and weight (in the parenthesis), respectively, at the different levels; B1-B4 belong to A1, B5-B7 belong to A2, B8-B10 belong to A3, B11-B14 belong to A4. |
Table 4 Basic characteristics of the respondents among the surveyed households |
| Variable | Characteristics | Percent (%) | Variable | Characteristics | Percent (%) |
|---|---|---|---|---|---|
| Gender | Male | 83.54 | File-recorded poor population | 0 | 7.60 |
| Female | 16.46 | 1-3 | 32.91 | ||
| Nationality | Lisu | 36.71 | 4-5 | 41.77 | |
| Han | 21.52 | 6-8 | 17.72 | ||
| Tibet | 18.99 | Number of members in the work force | 0 | 6.33 | |
| Bai | 15.19 | 1 | 18.99 | ||
| Nu | 7.59 | 2 | 44.30 | ||
| Age | <30 | 7.60 | 3 | 16.45 | |
| 31-40 | 26.58 | 4 | 10.13 | ||
| 41-50 | 26.58 | 5 | 3.80 | ||
| 51-60 | 25.32 | Number of migrant workers | 0 | 74.68 | |
| > 60 | 13.92 | 1 | 17.72 | ||
| Education level | < Primary school | 63.29 | 2 | 6.33 | |
| Secondary school or higher education | 36.71 | 3 | 1.27 |
Table 5 Sources of income for the poor households (N=79) |
| Sources of income | Proportion (%) | |
|---|---|---|
| Yes | No | |
| Poverty alleviation funds provided by the government | 20.25 | 79.75 |
| Minimum living standard guarantee provided by the government | 37.97 | 60.03 |
| Income from working in other provinces | 27.85 | 72.15 |
| Income from migrant working in the province of residence | 8.86 | 91.14 |
| Income from local working | 29.11 | 70.89 |
| Income from doing business | 1.27 | 98.73 |
| Income from animal husbandry | 20.25 | 79.75 |
| Income from farming | 64.56 | 35.44 |
Table 6 The structure of household annual net income |
| Source of income (yuan) | ≤5000 | 5001-10000 | 10001-15000 | >15000 |
|---|---|---|---|---|
| Family production income, including farm income and off farm income (N=52) | 48.08 | 21.15 | 7.69 | 23.08 |
| Salary income(N=50) | 28.00 | 46.00 | 12.00 | 14.00 |
| Property income(N=8) | 100.00 | 0.00 | 0.00 | 0.00 |
| Transfer income(N=49) | 34.68 | 26.53 | 10.20 | 28.57 |
Table 7 Household forestry income from public welfare forest and forest programs |
| Eco-compensation income from public welfare forests (N=53) | Income from Conversion of Cropland to Forestry Program (N=60) | Income from Natural Forest Protection Program (N=20) | |||
|---|---|---|---|---|---|
| Income range (yuan) | Proportion (%) | Income range (yuan) | Proportion (%) | Income range (yuan) | Proportion (%) |
| ≤ 200 | 28.30 | ≤ 1000 | 32.26 | ≤ 6000 | 18.75 |
| 200-400 | 20.75 | 1000-2500 | 27.42 | 6000-8000 | 18.75 |
| 400-600 | 15.09 | 2500-4000 | 9.68 | 8000-10000 | 56.25 |
| 600-800 | 3.77 | 4000-5500 | 16.13 | >10000 | 6.25 |
| 800-1000 | 7.54 | 5500-7000 | 1.61 | ||
| >1000 | 24.53 | 7000-8500 | 1.61 | ||
| >8500 | 11.29 | ||||
| [1] |
|
| [2] |
|
| [3] |
|
| [4] |
|
| [5] |
|
| [6] |
|
| [7] |
|
| [8] |
|
| [9] |
|
| [10] |
|
| [11] |
|
| [12] |
|
| [13] |
|
| [14] |
|
| [15] |
|
| [16] |
|
| [17] |
|
| [18] |
|
| [19] |
|
| [20] |
|
| [21] |
State Forestry-Grassland Administration of China. 2018. China Forestry Statistical Yearbook. Beijing, China: China Forestry Publishing House. (in Chinese)
|
| [22] |
|
| [23] |
|
| [24] |
|
| [25] |
|
| [26] |
|
| [27] |
|
| [28] |
|
| [29] |
|
| [30] |
|
/
| 〈 |
|
〉 |