
Journal of Resources and Ecology >
Community Structure and Diversity Distribution Pattern of Sandy Plants in the Middle and Upper Reaches of the Yarlung Zangbo River
|
LI Chao, E-mail: chaoli627@163.com |
Received date: 2020-05-02
Accepted date: 2020-07-08
Online published: 2021-03-30
Supported by
The National Key Research and Development Program of China(2016YFC0502006)
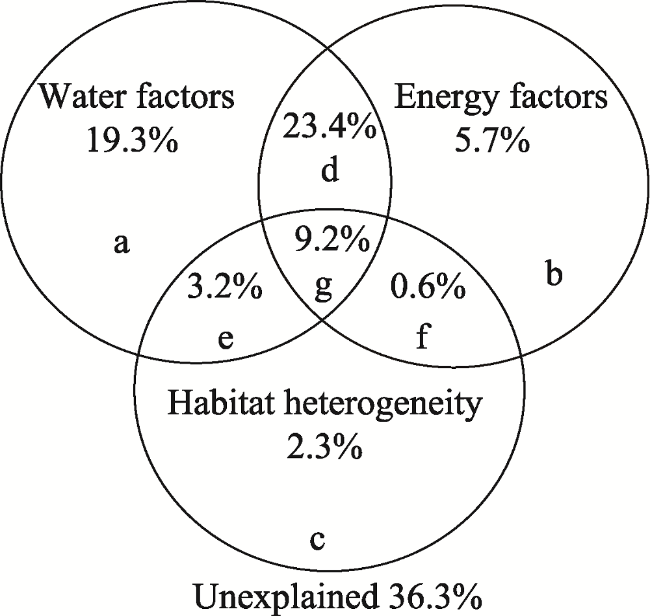
The Yarlung Zangbo River Basin is an important populated area in Tibet, and its plant community structure and diversity pattern have attracted the attention of many scholars. In this paper, the distribution pattern of plant diversity and the environmental factors impacting it in the middle and upper reaches of the Yarlung Zangbo River are revealed and discussed through sample surveys and climate and habitat data. The results show that the plant communities in the study area can be divided into seven types according to the dominant species: Artemisia minor + Stipa purpurea, Artemisia wellbyi + Festuca ovina, Potentilla fruticosa + Orinus thoroldii, Trikeraia hookeri + Artemisia frigida, Kobresia pygmaea, Sophora moorcroftiana + Artemisia hedinii, and Sophora moorcroftiana + Pennisetum centrasiaticum. Plant diversity decreases with decreasing longitude, increasing latitude, and increasing altitude; and the diversity distribution pattern in the study area has distinct zonal characteristics. Water and heat are the main factors which affect the distribution of vegetation types. The explanation rates of water and heat for the plant diversity distribution pattern were 19.3% and 5.7%, respectively, while the spatial variation explained by these two factors together was 60.8%. Therefore, the coupling effect is obvious.
Key words: Yarlung Zangbo River; community structure; diversity; pattern
LI Chao , XU Wenli , LI Qingkang , WANG Jingsheng . Community Structure and Diversity Distribution Pattern of Sandy Plants in the Middle and Upper Reaches of the Yarlung Zangbo River[J]. Journal of Resources and Ecology, 2021 , 12(1) : 11 -21 . DOI: 10.5814/j.issn.1674-764x.2021.01.002
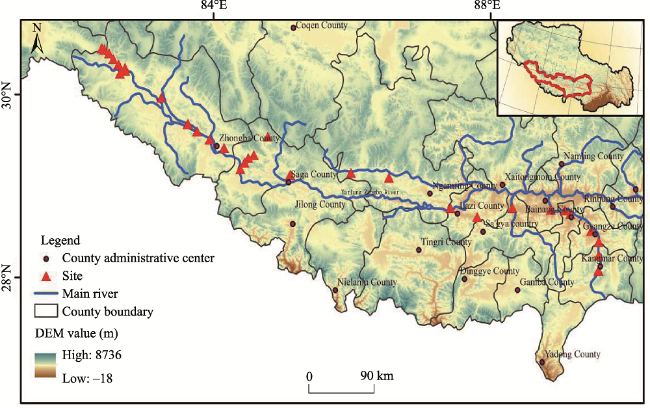
Fig. 1 Schematic diagram of the study site distribution in the middle and upper reaches of the Yarlung Zangbo River |
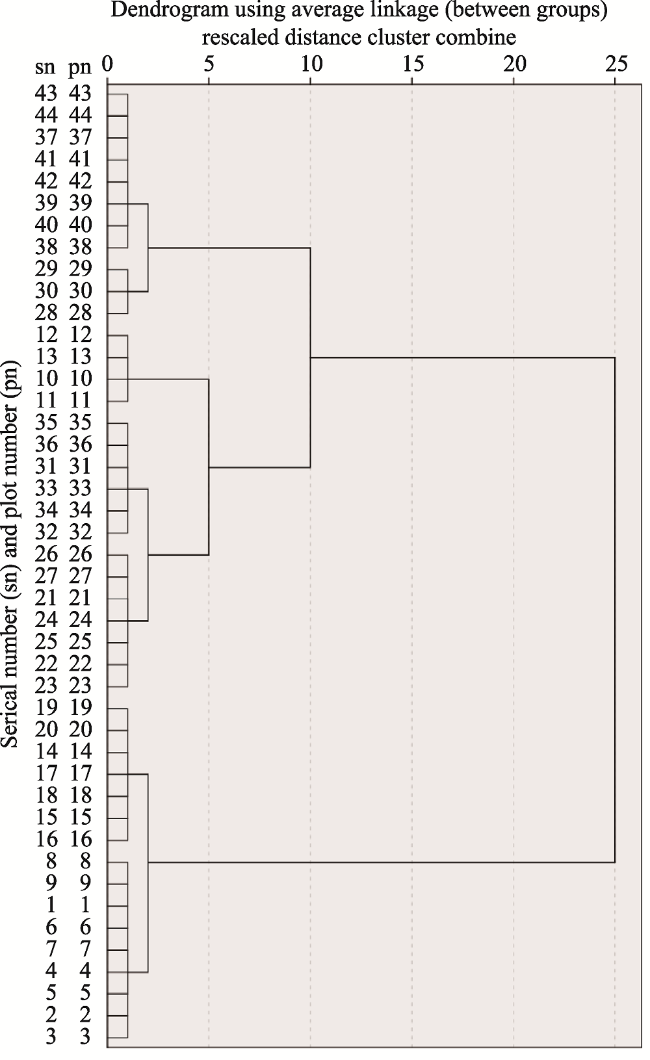
Fig. 2 Cluster analysis of plant associations in the middle and upper reaches of the Yarlung Zangbo River |
Table 1 Main dominant species in the plots |
| Association type | Plot number | Altitude range (m) | Main species | Average height (cm) | Average coverage (%) | Frequency | Importance value |
|---|---|---|---|---|---|---|---|
| Ⅰ Artemisia minor + Stipa purpurea | 1-5 | 5000-4750 | Artemisia minor | 4.2 | 2 | 0.136 | 0.08±0.04 |
| Stipa purpurea | 23.5 | 2 | 0.273 | 0.13±0.06 | |||
| Potentilla saundersiana | 4.4 | 1 | 0.159 | 0.07±0.03 | |||
| Saussurea tibetica | 6.8 | 1 | 0.113 | 0.04±0.02 | |||
| Lasiocaryum densiflorum | 5.2 | 1 | 0.113 | 0.04±0.03 | |||
| Ⅱ Artemisia wellbyi + Festuca ovina | 6-9 | 4800-4600 | Artemisia wellbyi | 18.7 | 5 | 0.227 | 0.38±0.12 |
| Festuca ovina | 6.5 | 4 | 0.159 | 0.29±0.16 | |||
| Stipa purpurea | 16.1 | 2 | 0.127 | 0.26±0.13 | |||
| Delphinium tangkulaense | 7.8 | 1 | 0.119 | 0.17±0.11 | |||
| Ⅲ Potentilla fruticosa + Orinus thoroldii | 14-20 | 4700-4500 | Potentilla fruticosa | 46.1 | 8 | 0.127 | 0.39±0.16 |
| Orinus thoroldii | 24.8 | 2 | 0.159 | 0.26±0.13 | |||
| Carex moorcroftii | 7.4 | 2 | 0.172 | 0.17±0.11 | |||
| Ⅳ Trikeraia hookeri+ Artemisia frigida | 10-13 | 4500-4300 | Trikeraia hookeri | 44.3 | 3 | 0.182 | 0.22±0.07 |
| Artemisia frigida | 37.1 | 5 | 0.205 | 0.28±0.14 | |||
| Elymus nutans | 36.6 | 2 | 0.168 | 0.14±0.06 | |||
| Kobresia tibetica | 8.7 | 5 | 0.263 | 0.09±0.04 | |||
| Poa tibetica | 18.7 | 3 | 0.145 | 0.11±0.06 | |||
| Anaphalis xylorhiza | 5.4 | 2 | 0.136 | 0.06±0.03 | |||
| Ⅴ Kobresia pygmaea | 21-28 | 4300-4000 | Kobresia pygmaea | 5.2 | 22 | 0.205 | 0.46±0.06 |
| Potentilla saundersiana | 4.7 | 5 | 0.182 | 0.15±0.07 | |||
| Astragalus arnoldii | 7.9 | 6 | 0.159 | 0.12±0.05 | |||
| Poa annua | 17.4 | 3 | 0.127 | 0.14±0.04 | |||
| Ⅵ Sophora moorcroftiana + Artemisia hedinii | 29-36 | 4200-3700 | Sophora moorcroftiana | 59.7 | 30 | 0.318 | 0.39±0.12 |
| Artemisia hedinii | 47.5 | 14 | 0.264 | 0.21±0.08 | |||
| Poa tibetica | 24.6 | 2 | 0.145 | 0.05±0.02 | |||
| Carex moorcroftii | 13.5 | 5 | 0.172 | 0.07±0.03 | |||
| Kobresia tibetica | 6.7 | 8 | 0.263 | 0.08±0.04 | |||
| Ⅶ Sophora moorcroftiana + Pennisetum centrasiaticum | 37-44 | 4100-3700 | Sophora moorcroftiana | 64.3 | 34 | 0.323 | 0.42±0.11 |
| Cotoneaster multiflorus | 56.4 | 27 | 0.264 | 0.27±0.08 | |||
| Artemisia wellbyi | 35.7 | 12 | 0.157 | 0.11±0.04 | |||
| Pennisetum centrasiaticum | 39.3 | 4 | 0.124 | 0.08±0.03 |
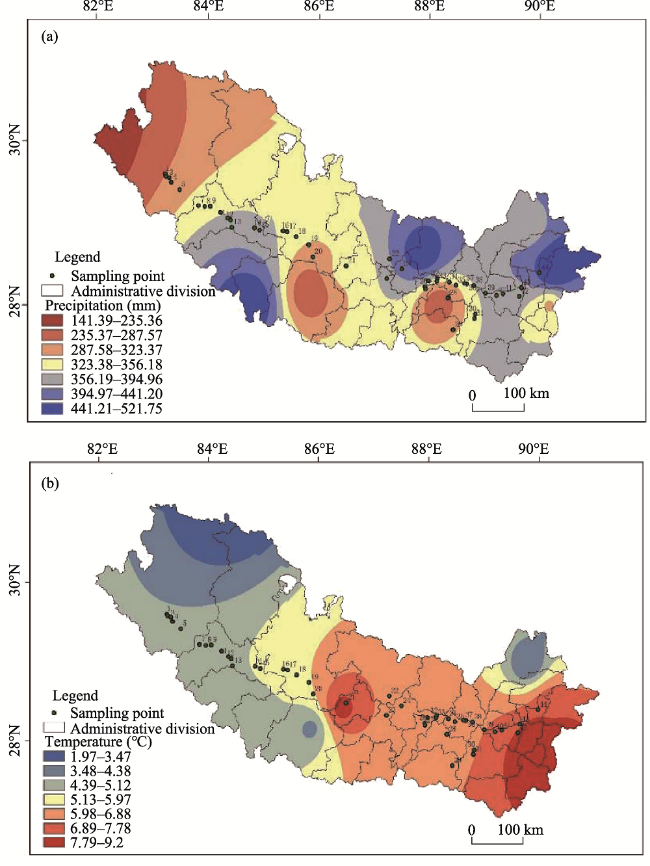
Fig. 3 Distribution in precipitation (a) and temperature (b) in the middle and upper reaches of the Yarlung Zangbo River |
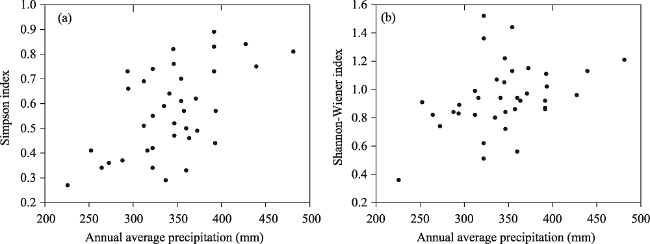
Fig. 4 Changes in two indexes of plant diversity with annual average precipitation |
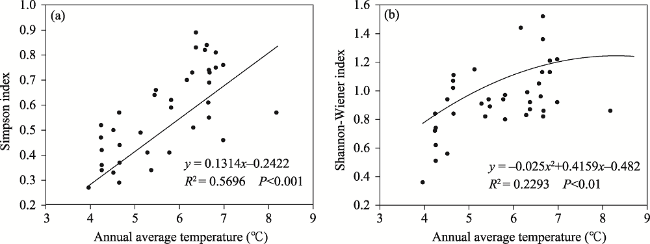
Fig. 5 Changes in two plant diversity indexes with annual average temperature |
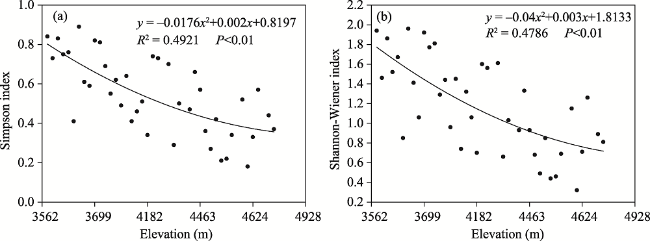
Fig. 6 Variation of two species diversity indexes along the vertical gradient |
Fig. 7 Relative influence of water, energy and habitat heterogeneity on species diversityNote: a: the independent influence of water factors; b: the independent influence of energy factors; c: the independent influence of habitat heterogeneity; d: the joint influence of water and energy factors; e: the joint influence of water and habitat heterogeneity factors; f: the joint influence of energy and habitat heterogeneity factors; g: the combined influence of all three groups of factors; unexplained, variation that is not explained by these specific factors. |
Table 2 Parameters and test values of thesemi-variogram model for species diversity indexes |
| Index | Model | Range | Nugget (C0) | Still (C0+C1) | C0/(C0+C1) | Rss | R2 | |
|---|---|---|---|---|---|---|---|---|
| D | Spheroid | 0.482 | 0.032 | 0.044 | 0.727 | 1.34×10⁻³ | 0.694 | |
| H | Spheroid | 0.335 | 0.137 | 0.273 | 0.502 | 1.79×10⁻³ | 0.753 | |
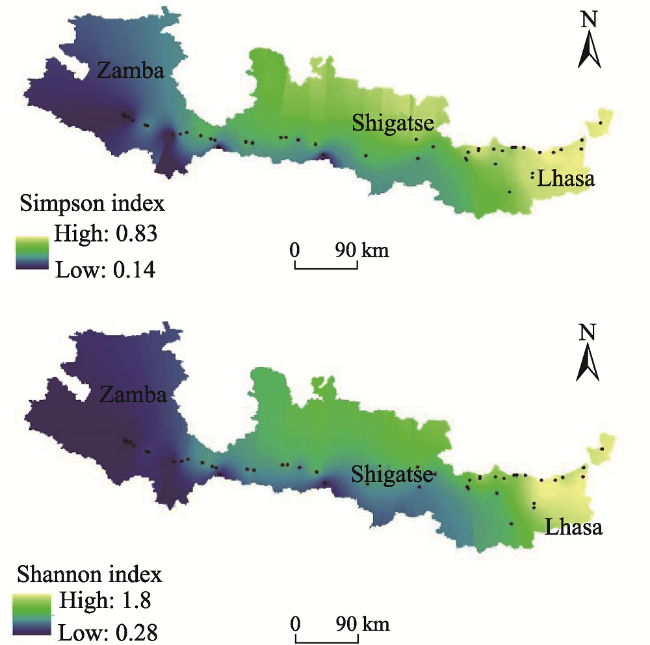
Fig. 8 Prediction maps of plant diversity in the middle and upper reaches of Yarlung Zangbo River |
The authors are grateful for the constructive and valuable comments from the anonymous reviewers. We thank Wang Tong and Jin Mingming for collecting field survey data and editing the English text of a draft of this manuscript.
| [1] |
|
| [2] |
|
| [3] |
|
| [4] |
|
| [5] |
|
| [6] |
|
| [7] |
|
| [8] |
|
| [9] |
|
| [10] |
|
| [11] |
|
| [12] |
|
| [13] |
|
| [14] |
|
| [15] |
|
| [16] |
|
| [17] |
|
| [18] |
|
| [19] |
|
| [20] |
|
| [21] |
|
| [22] |
|
| [23] |
|
| [24] |
|
| [25] |
|
| [26] |
|
| [27] |
|
| [28] |
|
| [29] |
|
| [30] |
|
| [31] |
|
| [32] |
|
| [33] |
|
| [34] |
|
| [35] |
|
| [36] |
|
| [37] |
|
| [38] |
|
| [39] |
|
| [40] |
|
| [41] |
|
| [42] |
|
| [43] |
|
/
| 〈 |
|
〉 |