
Journal of Resources and Ecology >
Implications of Anthropogenic Disturbances for Species Diversity, Recruitment and Carbon Density in the Mid-hills Forests of Nepal
Received date: 2020-07-18
Accepted date: 2020-09-07
Online published: 2021-03-30
Almost three-fourths of forests are experiencing anthropogenic disturbances globally, and more than two-thirds of the forests in Nepal receive different types of disturbances. In community forests (CFs), local communities are dependent on the ecosystem services provided by the forests for various aspects of their livelihoods, which disturb the forests’ natural conditions and ecosystem functioning in a variety of ways. This study tested the major disturbance factors that had influential roles on plant species diversity, recruitment (seedlings and saplings), biomass, soil organic carbon (SOC) and total carbon density in two community-managed forests in the Mid-hills of Nepal. The stump number, cut-off seedlings and saplings, lopping, dropping, and grazing/trampling were used as measures of the major anthropogenic disturbances. The necessary data were collected from 89 randomly selected sample plots, each with an area of 250 m2. The responses to anthropogenic disturbances were analyzed using Generalized Linear Models (GLM). The results showed that forest lopping was the most significant anthropogenic disturbance for biomass and total carbon density balance. A higher degree of lopping in the forests resulted in a lowering of the forests' carbon stock in the study area. SOC showed no significant response to any of the tested anthropogenic disturbances. Woody species richness and number of saplings increased with an increasing number of stumps, which signifies that intermediate disturbance was beneficial. However, a higher intensity of lopping reduced the sapling density. Grazing/trampling was the most significant disturbance for inhibiting seedling growth. Areas in the forests with a higher intensity of trampling showed lower numbers of seedlings and saplings. These results will be a guide for managing anthropogenic disturbances in multiple-use forests in Nepal, as well as those in similar socio-economic environments worldwide.
Hari Prasad PANDEY . Implications of Anthropogenic Disturbances for Species Diversity, Recruitment and Carbon Density in the Mid-hills Forests of Nepal[J]. Journal of Resources and Ecology, 2021 , 12(1) : 1 -10 . DOI: 10.5814/j.issn.1674-764x.2021.01.001
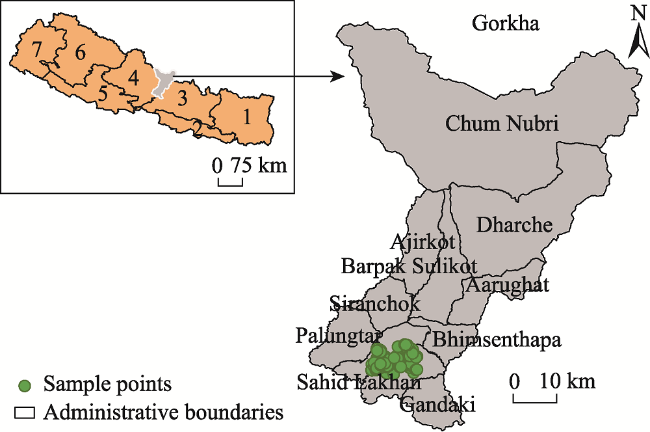
Fig. 1 Map showing the study areaNote: Numbers in the Nepal national map indicate the names of the seven Provinces; 1=Province 1; 2=Province 2; 3=Bagmati Province; 4=Gandaki Province; 5=Lumbini Province; 6=Karnali Province; and 7=Sudurpachhim Province. |
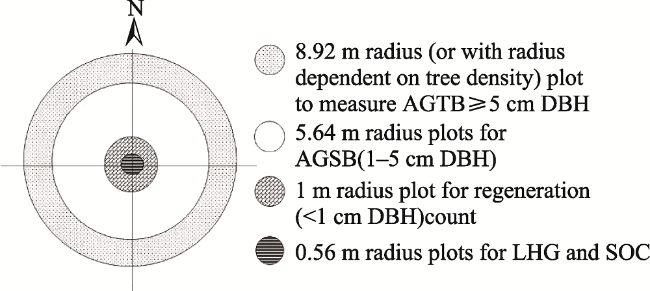
Fig. 2 Concentric sample plot layout in the forestsNote: AGTB= Above-ground tree biomass; AGSB= Above-ground sapling biomass; SOC= Soil organic carbon; LHG= Leaf-litter, herbs and grass; and DBH= Diameter at breast height. |
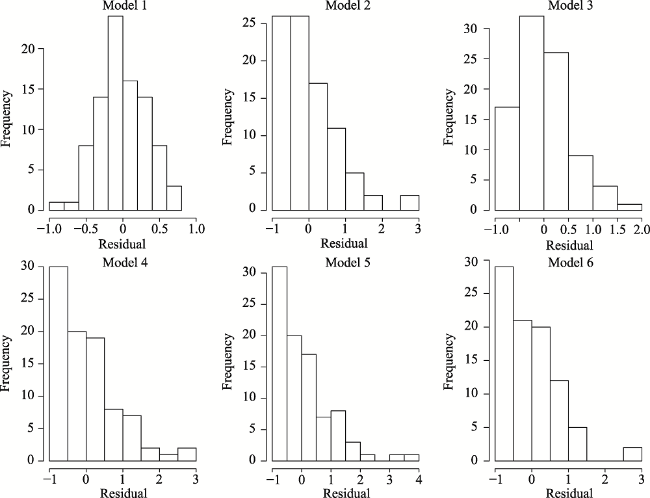
Fig. 3 The histograms of residuals of the final models based on the GLM as described in data analysis section |
Table 1 Basic characteristics of the forests surveyed in this study |
| S.N. | Variables | Unit | Quantity | Remarks |
|---|---|---|---|---|
| 1 | Species richness | number of species | 26.00 | Woody habit only |
| 2 | Tree density | number ha-1 | 1468.80 | |
| 3 | Sapling density | number ha-1 | 2695.80 | Recruitments or regeneration |
| 4 | Seedling density | number ha-1 | 32522.00 | |
| 5 | Biomass density | t ha-1 | 151.15 | |
| 6 | SOC density | t ha-1 | 46.76 | |
| 7 | Total carbon density | t ha-1 | 117.80 |
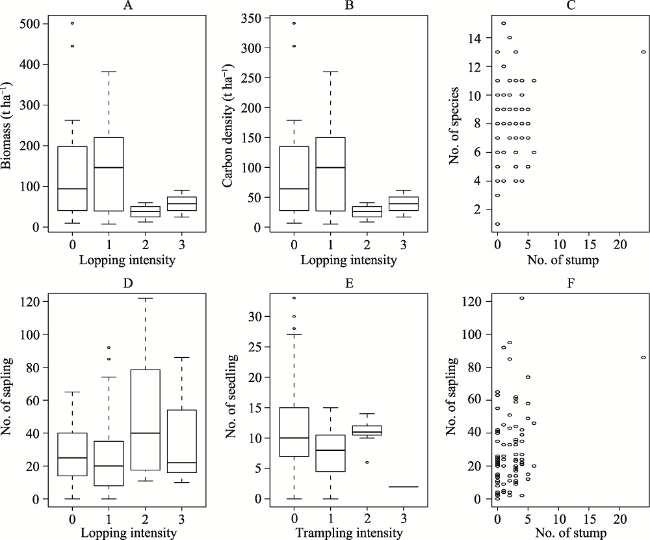
Fig. 4 Relationships between response variables and predictor variables, showing only the significant results among the variablesNote: A: Biomass density and lopping intensity; B: Carbon density and lopping intensity; C: Species richness and number of stumps; D: Saplings and lopping intensity; E: Seedlings and trampling intensity; F: Saplings and number of stumps. |
Table 2 Statistical test outputs on response variables against predictors |
| Attributes | Disturbances | DF | Deviance | Resid. DF | Resid. Deviance | F-value | P-value | Sig. |
|---|---|---|---|---|---|---|---|---|
| Species richness | Number of stumps | 1 | 5.796 | 87 | 83.82 | 6.5418 | 0.0125 | Yes |
| Degree of lopping | 3 | 0.408 | 84 | 83.41 | 0.1537 | 0.9270 | No | |
| Degree of cutting | 3 | 4.774 | 81 | 78.64 | 1.7964 | 0.1549 | No | |
| Dropping count | 1 | 0.219 | 80 | 78.42 | 0.2471 | 0.6205 | No | |
| Degree of trampling | 3 | 5.944 | 77 | 72.48 | 2.2365 | 0.0907 | No | |
| Number of saplings | Number of stumps | 1 | 148.035 | 87 | 1554.60 | 8.7686 | 0.0041 | Yes |
| Degree of lopping | 3 | 168.849 | 84 | 1385.70 | 3.3338 | 0.0237 | Yes | |
| Degree of cutting | 3 | 11.427 | 81 | 1374.30 | 0.2256 | 0.8783 | No | |
| Dropping count | 1 | 31.542 | 80 | 1342.80 | 1.8687 | 0.1756 | No | |
| Degree of trampling | 3 | 64.271 | 77 | 1278.50 | 1.2690 | 0.2901 | No | |
| Number of seedlings | Number of stumps | 1 | 2.348 | 87 | 345.69 | 0.6518 | 0.4220 | No |
| Degree of lopping | 3 | 3.197 | 84 | 342.49 | 0.2959 | 0.8283 | No | |
| Degree of cutting | 3 | 15.074 | 81 | 327.42 | 1.3950 | 0.2507 | No | |
| Dropping count | 1 | 2.807 | 80 | 324.61 | 0.7792 | 0.3801 | No | |
| Degree of trampling | 3 | 42.268 | 77 | 282.34 | 3.9116 | 0.0118 | Yes | |
| SOC density | Number of stumps | 1 | 0.576 | 87 | 267.18 | 0.1863 | 0.6672 | No |
| Degree of lopping | 3 | 19.920 | 84 | 247.26 | 2.1470 | 0.1011 | No | |
| Degree of cutting | 3 | 4.196 | 81 | 243.07 | 0.4523 | 0.7164 | No | |
| Dropping count | 1 | 1.272 | 80 | 241.80 | 0.4111 | 0.5233 | No | |
| Degree of trampling | 3 | 9.642 | 77 | 232.15 | 1.0392 | 0.3801 | No | |
| Total biomass density | Number of stumps | 1 | 0.240 | 87 | 9885.60 | 0.0022 | 0.9624 | No |
| Degree of lopping | 3 | 1048.380 | 84 | 8837.20 | 3.1911 | 0.0282 | Yes | |
| Degree of cutting | 3 | 380.290 | 81 | 8456.90 | 1.1575 | 0.3315 | No | |
| Dropping count | 1 | 57.820 | 80 | 8399.10 | 0.5280 | 0.4697 | No | |
| Degree of trampling | 3 | 488.810 | 77 | 7910.30 | 1.4879 | 0.2245 | No | |
| Total carbon density | Number of stumps | 1 | 0.050 | 87 | 2843.70 | 0.0014 | 0.9699 | No |
| Degree of lopping | 3 | 367.040 | 84 | 2476.70 | 3.7827 | 0.0138 | Yes | |
| Degree of cutting | 3 | 85.480 | 81 | 2391.20 | 0.8810 | 0.4548 | No | |
| Dropping count | 1 | 21.050 | 80 | 2370.20 | 0.6508 | 0.4223 | No | |
| Degree of trampling | 3 | 132.510 | 77 | 2237.60 | 1.3657 | 0.2596 | No |
Note: Significant level = 5%; Sig.= Significant; DF= Degree of freedom; Resid.= Residuals. |
| [1] |
|
| [2] |
|
| [3] |
ANSAB. 2010. Forest carbon stock measurement: Guidelines for measuring carbon stocks in the community-managed forest. Asia Network for Sustainable Agriculture and Bio-resources (ANSAB), Federation of Community Forest Users, Nepal (FECOFUN), International Centre for Integrated Mountain Development (ICIMOD), Norwegian Agency for Development Cooperation (NORAD), 76. www.ansab.org.
|
| [4] |
ANSAB. 2011. Forest carbon stock in community forests in three watersheds (Ludikhola, Kayarkhola and Charnawati). Asia Network for Sustainable Agriculture and Bio-resources (ANSAB), Federation of Community Forest Users, Nepal (FECOFUN), International Centre for Integrated Mountain Development (ICIMOD).
|
| [5] |
|
| [6] |
|
| [7] |
CFUG. 2008. Constitution and operational plan of community forest user groups. Gorkha: Community Forest User Groups (Ghaledanda Ranakhola CFUG and Ludi Damgade CFUG).
|
| [8] |
|
| [9] |
|
| [10] |
DDC. 2011. District profile of Gorkha. Gorkha: District Development Committee.
|
| [11] |
DFRS. 2015a. State of Nepal’s forests. Forest Resource Assessment (FRA) Nepal, Department of Forest Research and Survey (DFRS). Kathmandu, Nepal.
|
| [12] |
DFRS. 2015b. Middle mountains forests of Nepal. Forest Resource Assessment (FRA) Nepal, Department of Forest Research and Survey (DFRS). Kathmandu, Nepal.
|
| [13] |
FAO. 2020. Global forest resources assessment 2020—Key Findings. Rome.
|
| [14] |
|
| [15] |
|
| [16] |
IPCC. 2006. IPCC guidelines for national greenhouse gas inventories: Intergovernmental panel on climate change, national greenhouse inventory program. United Nations Environment Program (UNEP).
|
| [17] |
IPCC. 2007. Climate change: Impacts, adaptation and vulnerability. Contribution of Working Group II to the fourth assessment report of the Intergovernmental Panel on Climate Change. Cambridge, UK: Cambridge University Press.
|
| [18] |
|
| [19] |
|
| [20] |
|
| [21] |
|
| [22] |
|
| [23] |
|
| [24] |
|
| [25] |
|
| [26] |
|
| [27] |
|
| [28] |
|
| [29] |
|
| [30] |
|
| [31] |
|
| [32] |
|
| [33] |
|
| [34] |
|
| [35] |
|
| [36] |
|
| [37] |
|
/
| 〈 |
|
〉 |