
Journal of Resources and Ecology >
Supporting the Development of Homestay Tourism in the Yangtze River Delta: A Study based on Tourists’ Perceived Value
|
LONG Fei, E-mail: 81327821@qq.com |
Received date: 2020-05-07
Accepted date: 2020-07-02
Online published: 2020-10-25
Supported by
The Youth Program of National Natural Science Foundation of China(41801139)
The China Innovation Funding(2019YFC0507802)
Homestay tourism has begun to flourish throughout the country, becoming a model of tourism innovation and upgrading, and attracting increasing amounts of capital. Through the collection and analysis of tourist questionnaire data for key cities in the Yangtze River Delta, and based on the theory of tourists' perceived value,18 factors related to the perception of homestay tourism are examined. Through exploratory factor analysis, three main factors of facilities and environment perception, cultural experience perception and service value perception are extracted. Then, from the perspectives of each of these perceptions, this study determines the degree of support for homestay tourism development in the Yangtze River Delta, obtains the key factors that affect the development of homestay tourism, and constructs a structural equation model of tourist perception and the degree of homestay tourism support. By calculating the regression path of the structural equation, the standardized path coefficients of the facilities and environment perception, cultural experience perception and service value perception are found to be 0.724, 0.813 and 0.692, respectively. These three factors have a significant impact on the development of homestay tourism agglomeration. Positive facilities and environmental perception can effectively support the development of homestay tourism, while the cultural experience perception provides its basic condition, and the service value perception constitutes an important factor of homestay tourism development. To better guide the development of homestay tourism, attention must be paid to developing the tourism facilities and environment, to cultivating tourism cultural experiences, and to improving of tourism service value.
Key words: tourist perception; homestay tourism; support for development
LONG Fei , ZHU He . Supporting the Development of Homestay Tourism in the Yangtze River Delta: A Study based on Tourists’ Perceived Value[J]. Journal of Resources and Ecology, 2020 , 11(6) : 624 -632 . DOI: 10.5814/j.issn.1674-764x.2020.06.010
Table 1 Homestay tourist frequency to the Yangtze River Delta |
| Survey items | Response frequency of visitors | Percentage of visitors (%) |
|---|---|---|
| 1 time | 115 | 32.0 |
| 2 times | 61 | 17.0 |
| 3 times | 36 | 10.0 |
| 4 times | 10 | 2.7 |
| > 4 times | 137 | 38.2 |
Table 2 The purpose of choosing homestay for tourists |
| Survey items | Percentage of purposes (%) | Percentage of observed value of purposes (%) |
|---|---|---|
| Sightseeing | 15.3 | 34.4 |
| Cultural experience | 24.4 | 54.8 |
| Physical fitness | 3.9 | 8.9 |
| Relaxation | 31.6 | 71.0 |
| Purchase of local products | 2.7 | 6.2 |
| Tasting food | 11.8 | 26.6 |
| Team building activities | 3.4 | 7.7 |
| Festival activities | 1.0 | 2.3 |
| Commercial activity | 5.8 | 13.1 |
Table 3 Travelling companions of homestay tourism |
| Survey items | Percentage of travelling companions (%) | Percentage of observed value of travelling companions (%) |
|---|---|---|
| Family | 36.70 | 73.4 |
| Friends | 32.00 | 64.1 |
| Classmates | 12.20 | 24.3 |
| Colleagues | 12.40 | 24.7 |
| Business partners | 6.20 | 12.4 |
| Netizens | 0.60 | 1.2 |
Table 4 Access to homestay information |
| Survey items | Frequency of access | Percentage of access (%) |
|---|---|---|
| Encounter at arrival | 24 | 6.6 |
| Tour arrangement | 15 | 4.2 |
| Online travel website | 172 | 47.9 |
| Relatives and friends recommendations | 76 | 21.2 |
| Specific community recommendations | 50 | 13.9 |
| Magazines | 3 | 0.8 |
| Others | 19 | 5.4 |
Table 5 Accommodation rates acceptable to tourists |
| Survey items | Frequency of acceptable rates | Percentage of acceptable rates (%) |
|---|---|---|
| < 200 yuan | 43 | 16.6 |
| 200-300 yuan | 88 | 34.0 |
| 300-400 yuan | 67 | 25.9 |
| >400 yuan | 61 | 23.6 |
Table 6 KMO and Bartlett Inspection |
| Bartlett sphere verification | |||
|---|---|---|---|
| Chi-Square Test | df | Significance | |
| 0.931 | 3502.808 | 210 | 0.000 |
Table 7 Exploratory factor analysis |
| Exploratory factors of homestay tourism perception | Facilities and environmental perception (25.067%)* | Cultural experience perception (22.093%)* | Service value perception (15.149%)* | Mean value | Standard deviation |
|---|---|---|---|---|---|
| Specialty catering | 0.837 | 2.25 | 0.879 | ||
| Sanitary condition | 0.813 | 2.43 | 0.976 | ||
| Comfortable facilities | 0.794 | 2.38 | 0.954 | ||
| Local cultural characteristics | 0.696 | 2.04 | 0.796 | ||
| Rich and distinctive tourist commodities | 0.689 | 2.58 | 0.975 | ||
| Cost-effective homestay | 0.670 | 2.29 | 0.922 | ||
| Distinctive architectural style | 0.656 | 2.07 | 0.787 | ||
| Warm and friendly reception staff | 0.598 | 1.98 | 0.723 | ||
| Experience as expected | 0.579 | 2.36 | 0.839 | ||
| Experience of staying serving as a topic of conversation | 0.842 | 2.03 | 0.772 | ||
| Willing to make friends | 0.749 | 2.12 | 0.859 | ||
| Deeper understanding of local culture | 0.745 | 2.06 | 0.773 | ||
| Choose homestay next time | 0.688 | 2.21 | 0.764 | ||
| Experience local lifestyle | 0.676 | 2.04 | 0.816 | ||
| Satisfied with homestay experience | 0.582 | 2.12 | 0.706 | ||
| Easy access to the tourist destination | 0.859 | 2.34 | 0.894 | ||
| Easy access to homestay information and reservations | 0.819 | 2.21 | 0.837 | ||
| Supporting facilities around homestay | 0.692 | 2.56 | 0.960 | ||
| Brand awareness | 0.586 | 2.41 | 0.908 |
Note: * The numbers in brackets are variance contribution rates. |
Table 8 Model reliability and validity tests |
| Test potential variables | Cronbach’s Alpha | Average variation extraction | Combination reliability (CR) |
|---|---|---|---|
| Facilities and environmental perception | 0.917 | 0.5026 | 0.8996 |
| Cultural experience perception | 0.902 | 0.5247 | 0.8843 |
| Service value perception | 0.809 | 0.5045 | 0.8315 |
| Supporting development of homestay tourism | 0.827 | 0.5120 | 0.8231 |
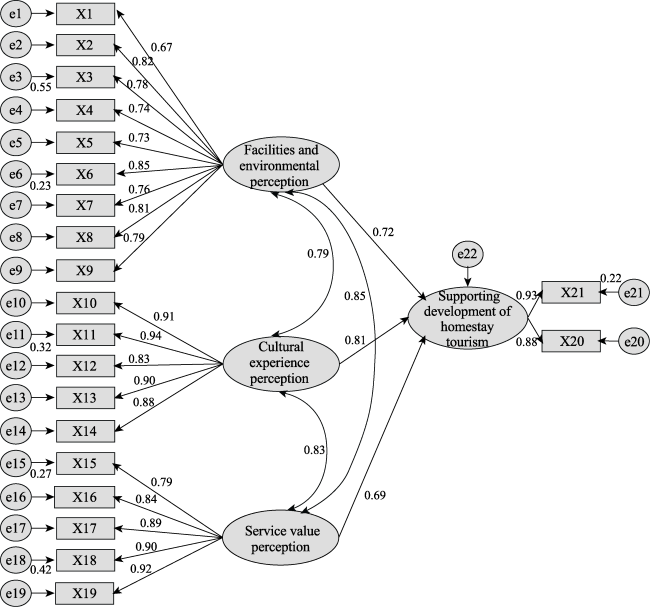
Fig. 1 The structure equation model of tourist perception and the degree of homestay tourism development support |
Table 9 Analysis of structural equations |
| Regression equation path | Standardized path coefficient | P value | Result |
|---|---|---|---|
| Facilities and environmental perception→Supporting development of homestay tourism agglomeration | 0.724 | 0.037* | Support |
| Cultural experience perception→Supporting development of homestay tourism agglomeration | 0.813 | 0.0097** | Support |
| Service value perception→Supporting development of homestay tourism agglomeration | 0.692 | 0.028* | Support |
Note: P<0.05, the significance level is acceptable (*); P<0.01 has a better significance level (**). |
| 1 |
|
| 2 |
|
| 3 |
|
| 4 |
|
| 5 |
|
| 6 |
|
| 7 |
|
| 8 |
|
| 9 |
|
| 10 |
|
| 11 |
|
| 12 |
|
| 13 |
|
| 14 |
|
| 15 |
|
| 16 |
|
| 17 |
|
| 18 |
|
| 19 |
|
| 20 |
|
| 21 |
|
| 22 |
|
| 23 |
|
| 24 |
|
/
| 〈 |
|
〉 |