
Journal of Resources and Ecology >
Effect of Land Use and Land Cover Change on the Changes in Net Primary Productivity in Karst Areas of Southwest China: A Case Study of Huanjiang Maonan Autonomous County
|
ZHANG Mengyu, E-mail: zhangmy.18s@igsnrr.ac.cn |
Received date: 2020-03-18
Accepted date: 2020-06-01
Online published: 2020-10-25
Supported by
The National Key Research & Development Program of China(2016YFC0500204)
The National Natural Science Foundation of China(41571130043)
The National Natural Science Foundation of China(31420103917)
The National Natural Science Foundation of China(31971512)
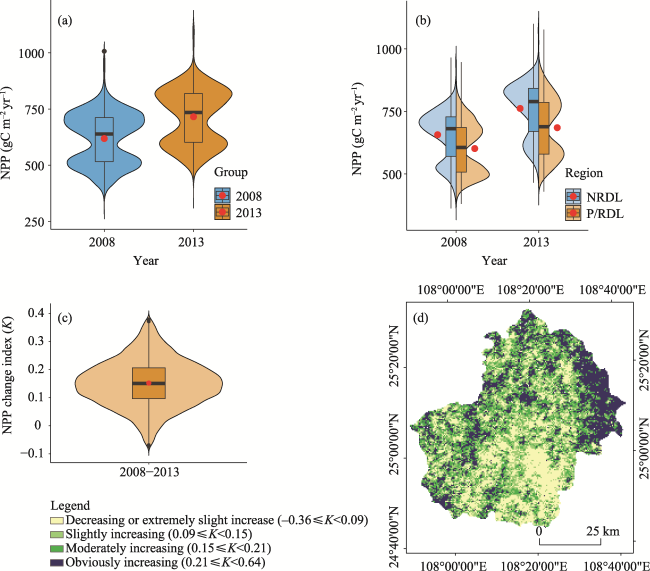
Karst areas in southwest China have experienced significant land cover and land use change (LUCC) due to utilization for human activity and a comprehensive rocky desertification control project (RDCP) since 2008. It is important to quantify the effect of LUCC on ecosystem productivity in this region for assessing the overall benefit of this ecological restoration project. In this study, we used using MODIS land cover and NPP products to investigate the relative contribution of LUCC to the change in net primary productivity (NPP) during 2008-2013 in Huanjiang County, one of first one hundred pilot counties to implement RDCP. Our results show that NPP increased in 95.53% of the county, and the average growth of NPP in non-rocky desertification area was higher than in rocky desertification or potential rocky desertification areas. LUCC has an important contribution (25.23%) to the NPP increase in the county, especially in the LUCC area (70.97%), which increased the average NPP by 3.9% and 10.5%, respectively. Across the six RDCP regions in the county, the average increase in NPP for the vegetation restoration measure of governed karst area is significantly greater than in the ungoverned karst area, and the positive change in NPP increased with the increasing implementation area of the vegetation restoration measure.
ZHANG Mengyu , ZHANG Li , REN Xiaoli , HE Honglin , LV Yan , WANG Junbang , YAN Huimin . Effect of Land Use and Land Cover Change on the Changes in Net Primary Productivity in Karst Areas of Southwest China: A Case Study of Huanjiang Maonan Autonomous County[J]. Journal of Resources and Ecology, 2020 , 11(6) : 606 -616 . DOI: 10.5814/j.issn.1674-764x.2020.06.008
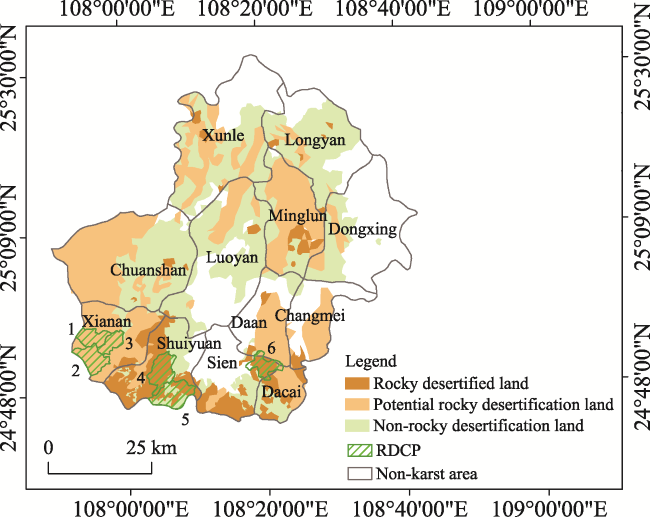
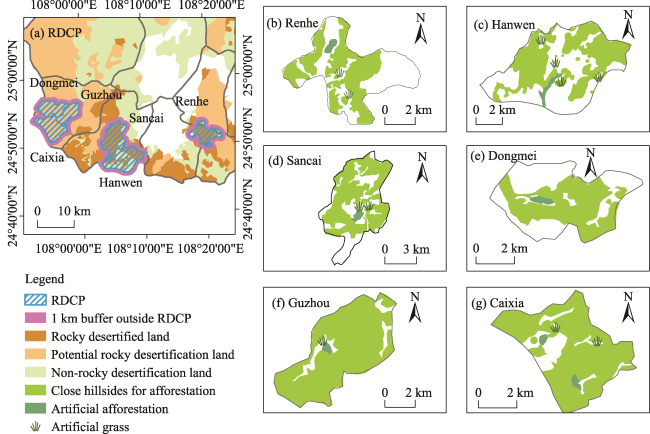
Fig. 1 Location of the study areaNote: Numbers 1 to 6 represent Dongmei, Caixia, Guzhou, Sancai, Hanwen, and Renhe small watersheds, respectively. The rocky desertification control project (referred to as RDCP) and the status of rocky desertification in all of the small watersheds were organized according to the “Huanjiang County Rock Desertification Comprehensive Management and Construction Project” and related implementation plans during 2008-2010. Due to the lag of the effect of project implementation, the RDCP activity during 2011-2013 was not considered in this study. |
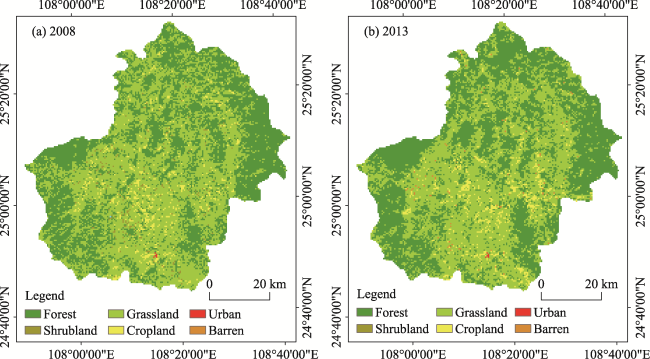
Table 1 Landuse types in the reclassification |
| Reclassified type | MODIS land cover type 2 (UMD) |
|---|---|
| Water | Water bodies |
| Forests | Evergreen needleleaf forest, Evergreen broadleaf forest, Deciduous needleleaf forest, Deciduous broadleaf forest, Mixed forest |
| Shrublands | Closed shrublands, Open shrublands |
| Grasslands | Woody savannas, Savannas, Grasslands |
| Croplands | Croplands |
| Urban | Urban and built-up lands |
| Barren | Barren or sparsely vegetated lands |
Fig. 2 Land use classification and mapping in Huanjiang County in (a) 2008 and (b) 2013 |
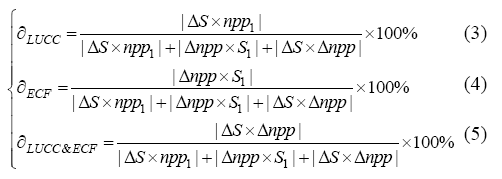
Fig. 3 NPP changes in Huanjiang County during 2008-2013. (a) Distribution of NPP values in the county, (b) Distribution of NPP values in non-rocky desertification area (NRDL) and the potential rocky desertification or rocky desertification land (P/RDL); (c) Distribution and (d) spatial pattern of the NPP change index (K). Red dots are the averages. |
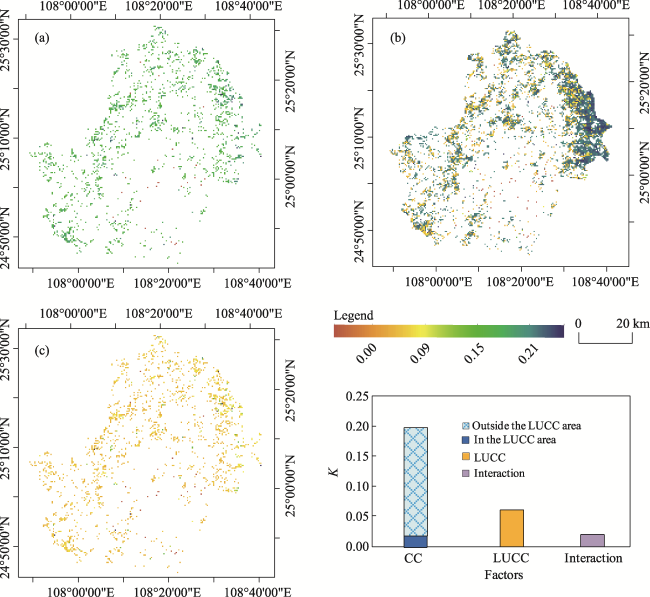
Fig. 4 Spatial patterns of effects of (a) LUCC, (b) ECF and (c) their interaction on NPP, and (d) statistics for the total effect of factors on the |K|≥0.21 (i.e. the third quantile of the NPP change index) area. |
Table 2 Statistics of K that are attributed to land use and land cover change (referred to as LUCC), the environmental comprehensive factor (ECF), and their interaction. |
| Region | K_LUCC | K_ECF | K_interaction | K mean | |||
|---|---|---|---|---|---|---|---|
| Effect | Contribution (%) | Effect | Contribution (%) | Effect | Contribution (%) | ||
| -0.36≤K<0.09 | 0.013 | 36.47 | 0.021 | 61.60 | 0.001 | 1.92 | 0.034 |
| 0.09≤K<0.15 | 0.037 | 30.28 | 0.080 | 65.90 | 0.005 | 3.82 | 0.121 |
| 0.15≤K<0.21 | 0.049 | 27.19 | 0.121 | 67.68 | 0.009 | 5.14 | 0.178 |
| |K|≥0.21 | 0.053 | 19.89 | 0.197 | 73.92 | 0.017 | 6.18 | 0.267 |
| Areas where LUCC occurs | 0.105 | 70.97 | 0.021 | 14.51 | 0.021 | 14.51 | 0.148 |
| Huanjiang County | 0.039 | 25.23 | 0.106 | 69.61 | 0.008 | 5.16 | 0.153 |
Table 3 Land use transfer matrix (2008-2013) (unit: km2) |
| 2008-2013 | Forests | Shrublands | Grasslands | Croplands | 2008 |
|---|---|---|---|---|---|
| Forests | — | 0.21 | 585.16 | 15.46 | 600.83 |
| Shrublands | 6.01 | — | 39.50 | 1.93 | 47.44 |
| Grasslands | 748.30 | 1.29 | — | 130.08 | 879.67 |
| Croplands | 18.03 | 0.00 | 104.75 | — | 122.78 |
| 2013 | 772.34 | 1.50 | 729.41 | 147.47 | — |
Fig. 5 Spatial distribution of (a) RDCP (see Fig. 1) and (b-g) vegetation restoration measures (referred to as VRM; i.e. closing hills for afforestation, artificial afforestation, and artificial grass) in each of the six small watersheds |
Table 4 Comparison of the NPP dynamic index (K) values between regions with the implementation of vegetation restoration measures and 1 km buffer areas outside of those governance regions in the six small watersheds |
| Regions | K | Watersheds | K of VRM | Areas (km2) | |
|---|---|---|---|---|---|
| VRM | Non-RDCP | ||||
| Region 1 | 0.174* | 0.161* | Guzhou | 0.151 | 18.43 |
| Dongmei | 0.131 | 13.16 | |||
| Caixia | 0.208 | 29.26 | |||
| Region 2 | 0.128** | 0.106** | Sancai | 0.108 | 27.41 |
| Hanwen | 0.162 | 26.08 | |||
| Region 3 | 0.137** | 0.078** | Renhe | 0.137 | 15.73 |
Note: * and ** indicate significant differences at the 0.05 and 0.01 levels, respectively. |
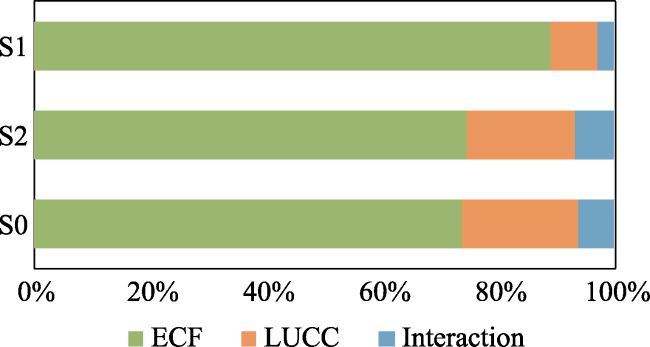
Fig. 6 The relative contributions of LUCC, ECF change and their interaction on NPP changes in the region with obviously changed NPP, i.e. the third quantile of the NPP change index (|K|≥0.21 during 2008-2013; |K|≥0.23 during 2005-2011). |
| 1 |
|
| 2 |
|
| 3 |
|
| 4 |
|
| 5 |
|
| 6 |
|
| 7 |
|
| 8 |
|
| 9 |
|
| 10 |
|
| 11 |
|
| 12 |
|
| 13 |
|
| 14 |
|
| 15 |
|
| 16 |
|
| 17 |
|
| 18 |
|
| 19 |
|
| 20 |
|
| 21 |
|
| 22 |
|
| 23 |
|
| 24 |
|
| 25 |
|
| 26 |
|
| 27 |
|
| 28 |
|
| 29 |
|
| 30 |
|
| 31 |
|
| 32 |
|
| 33 |
|
| 34 |
|
| 35 |
|
| 36 |
|
| 37 |
|
| 38 |
|
| 39 |
|
| 40 |
|
| 41 |
|
| 42 |
|
| 43 |
|
| 44 |
|
| 45 |
|
| 46 |
|
/
| 〈 |
|
〉 |