
Journal of Resources and Ecology >
Temporal and Spatial Characteristics and Optimization of the Intensive Use of Cultivated Land in Maoming City
Received date: 2020-05-27
Accepted date: 2020-07-16
Online published: 2020-10-25
Supported by
The Guangdong Province Education Science Planning Project(2019GXJK080)
The Guangdong Province Philosophy and Social Science Planning Project(GD19YYJ03)
Improving the level of intensive cultivated land use is an important measure to ensure food security and promote the sustainable development of the regional society and economy. Based on data from the statistical yearbook of Maoming City and its counties and districts from 2005 to 2018 and the land use change database of Maoming City for 2018, this study constructed an evaluation index system for four aspects: cultivated land use intensity, cultivated land use degree, cultivated land output benefit and cultivated land sustainable use status. The level of intensive use of cultivated land in Maoming City from 2004 to 2017 was evaluated by AHP, the range method and the comprehensive evaluation model, and its temporal and spatial characteristics were evaluated. The results revealed three major points. (1) The intensive use of cultivated land in Maoming City in the past 14 years was good, and its level showed an overall upward trend, with the intensive use degree of cultivated land rising from 0.4045 in 2004 to 1.3148 in 2017. (2) The levels of intensive use of cultivated land in each county and district of Maoming City were generally on the rise, with no significant differences between them. However, according to the regional distribution, the intensive use level of cultivated land was highest in Maonan District, while it was relatively low in Dianbai County. The largest increase in the level of cultivated land intensive use was in Gaozhou, and the smallest was in Dianbai County. (3) According to the existing problems of cultivated land utilization in Maoming City, combined with the current international and domestic measures to effectively improve the level of intensive use of cultivated land, four suggestions are put forward: to improve the efficiency of cultivated land utilization and effectively protect basic farmland; to improve the overall urban planning and rationally adjust the layout of construction land; to raise farmers’ awareness of the intensive use of cultivated land; and to increase agricultural investment and improve agricultural infrastructure.
CHEN Shiyin , MA Zhiyu . Temporal and Spatial Characteristics and Optimization of the Intensive Use of Cultivated Land in Maoming City[J]. Journal of Resources and Ecology, 2020 , 11(6) : 598 -605 . DOI: 10.5814/j.issn.1674-764x.2020.06.007
Table 1 Cultivated land spatial distribution of Maoming City in 2017(unit: ha) |
| Major types | |||||
|---|---|---|---|---|---|
| Paddy field | Irrigated land | Dryland | |||
| Maoming | 200214 | 100 | 134955 | 34848 | 30411 |
| Huazhou | 50620 | 25.3 | 34225 | 6431 | 9946 |
| Dianbai | 52665 | 26.3 | 33068 | 8234 | 10823 |
| Gaozhou | 47582 | 23.7 | 34877 | 5634 | 7071 |
| Xinyi | 32416 | 16.2 | 21665 | 6134 | 7071 |
| Maonan | 16931 | 8.5 | 11120 | 3420 | 2391 |
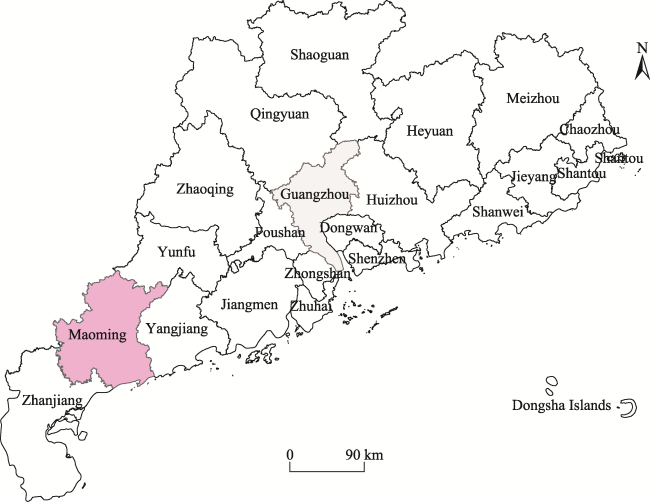
Fig. 1 Location map of Maoming City |
Table 2 Cultivated land intensive use index evaluation system |
| Target layer | Criterion layer | Index layer | Weight |
|---|---|---|---|
| Intensive use of cultivated land (A) | Cultivated land use intensity (B1) | Fertilizer input per unit area (C11) | 0.7112 |
| Labor input per unit area (C12) | 0.0790 | ||
| Mechanical input per unit area (C13) | 0.2098 | ||
| Cultivated land use degree (B2) | Cropland multiple cropping index (C21) | 0.1661 | |
| Farmland irrigation index (C22) | 0.2565 | ||
| Input of farmland plastic film (C23) | 0.1247 | ||
| Cultivated land use output benefit (B3) | Per unit area yield (C31) | 0.4527 | |
| Yield safety factor (C32) | 0.1423 | ||
| Average output value per worker (C33) | 0.5737 | ||
| Sustainable use of cultivated land (B4) | Forest coverage (C41) | 0.2840 | |
| Per capita arable land (C42) | 0.3457 | ||
| Non-agricultural index (C43) | 0.6543 |
Table 3 The average random consistency index RI |
| Order | 1 | 2 | 3 | 4 | 5 | 6 | 7 | 8 | 9 |
|---|---|---|---|---|---|---|---|---|---|
| RI | 0 | 0 | 0.58 | 0.9 | 1.12 | 1.24 | 1.32 | 1.41 | 1.45 |
Table 4 Index of cultivated land intensive use of Maoming in 2004-2017 |
| Year | Intensity | Degree | Output effect | Sustainable status | Intensive use of cultivated land |
|---|---|---|---|---|---|
| 2004 | 0.0614 | 0.1083 | 0.0214 | 0.2134 | 0.4045 |
| 2005 | 0.0991 | 0.2324 | 0.0234 | 0.3213 | 0.6762 |
| 2006 | 0.0221 | 0.2278 | 0.0354 | 0.3234 | 0.6087 |
| 2007 | 0.0321 | 0.0645 | 0.0137 | 0.1091 | 0.2194 |
| 2008 | 0.0423 | 0.0984 | 0.0534 | 0.2314 | 0.4255 |
| 2009 | 0.0712 | 0.1126 | 0.0837 | 0.2867 | 0.5542 |
| 2010 | 0.1118 | 0.1143 | 0.1143 | 0.3642 | 0.7046 |
| 2011 | 0.1377 | 0.1513 | 0.1421 | 0.4859 | 0.917 |
| 2012 | 0.1712 | 0.2542 | 0.1631 | 0.6643 | 1.2528 |
| 2013 | 0.1258 | 0.0872 | 0.1743 | 0.4231 | 0.8104 |
| 2014 | 0.1787 | 0.1452 | 0.2227 | 0.5121 | 1.0587 |
| 2015 | 0.2018 | 0.1423 | 0.2356 | 0.5345 | 1.1142 |
| 2016 | 0.256 | 0.1146 | 0.2539 | 0.6231 | 1.2476 |
| 2017 | 0.2622 | 0.1431 | 0.2741 | 0.6354 | 1.3148 |
Table 5 Cultivated land intensive use degree of cities/districts in Maoming in 2007, 2010, 2013, and 2017 |
| City/District | 2007 | 2010 | 2013 | 2017 |
|---|---|---|---|---|
| Huazhou | 0.9245 | 1.0340 | 1.1669 | 1.3452 |
| Gaozhou | 0.9236 | 0.9727 | 1.2505 | 1.3698 |
| Xinyi | 0.8992 | 1.0668 | 1.1837 | 1.3326 |
| Dianbai | 0.8848 | 1.0805 | 1.1865 | 1.3029 |
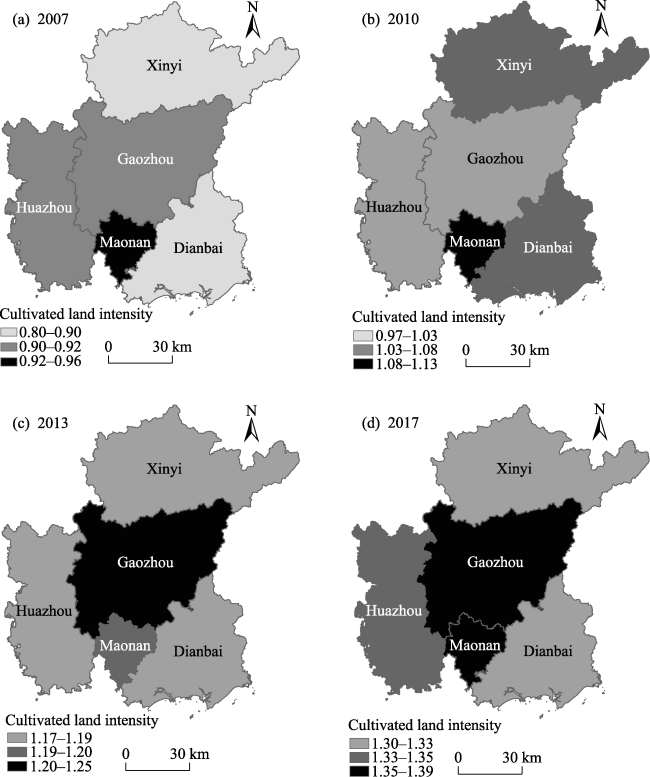
| Maonan | 0.9593 | 1.1330 | 1.1987 | 1.3928 |
Fig. 2 Spatial changes of cultivated land intensity in Maoming City in 2007, 2010, 2013 and 2017 |
| 1 |
|
| 2 |
|
| 3 |
|
| 4 |
|
| 5 |
|
| 6 |
|
| 7 |
|
| 8 |
|
| 9 |
|
| 10 |
|
| 11 |
|
| 12 |
|
| 13 |
|
/
| 〈 |
|
〉 |