
Journal of Resources and Ecology >
Impact of Wheat Price Changes on Farmers’ Willingness to Participate in Fallow
|
CHENG hao, E-mail: 2201820543@stu.jxufe.edu.cn |
Received date: 2020-05-30
Accepted date: 2020-07-30
Online published: 2020-10-25
Supported by
The National Natural Science Foundation of China(41961035)
The National Natural Science Foundation of China(41971243)
The Academic and Technical Leaders Funding Program for Major Disciplines in Jiangxi Province(20172BCB22011)
Natural Science Foundation in Jiangxi Province(20202BAB213014)
The Technology Foundation of Jiangxi Education Department of China(GJJ180285)
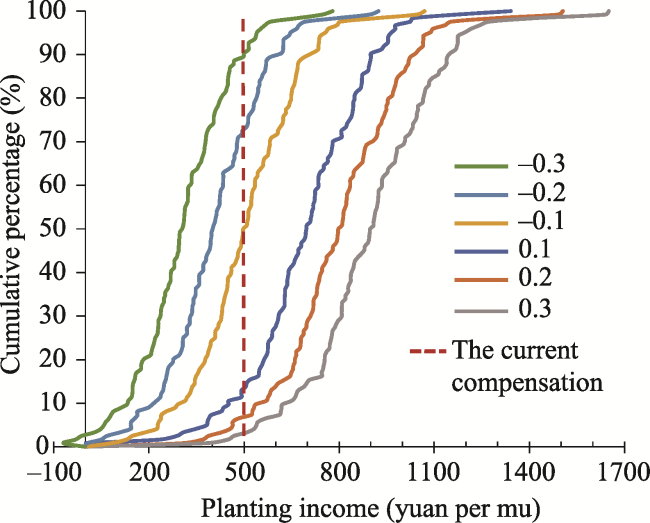
After operating for four years, the fallow project in the groundwater funnel area of the North China Plain has produced an initial water-saving effect. However, groundwater funnel remediation is a long-term process, and grain price changes over time may affect farmers’ willingness to participate in fallow. Based on the estimation by the Cobb-Douglas production function, the relationship between farmers’ satisfaction with fallow compensation and planting income is analyzed based on survey data collected from farming households in Hebei, a typical province located in the groundwater funnel area. Using this data, the impact of wheat price changes on farmers’ willingness to participate in fallow is simulated. The results indicate wheat price changes affect farmers' expected planting income and consequently their willingness to fallow; 88% of farmers would be unwilling to participate in fallow with a 0.1 yuan per 500 g increase in the wheat price, whereas 71.4% of farmers would be willing to participate in fallow with a 0.2 yuan per 500 g decrease in the price. Finally, some policy implications are proposed, such as the recommendation that the fallow compensation should be adjusted according to the wheat price multiplied by the average wheat yield of the three years before fallow in the North China Plain.
Key words: wheat price change; fallow; ecological compensation; farmers
CHENG Hao , XIE Hualin . Impact of Wheat Price Changes on Farmers’ Willingness to Participate in Fallow[J]. Journal of Resources and Ecology, 2020 , 11(6) : 589 -597 . DOI: 10.5814/j.issn.1674-764x.2020.06.006
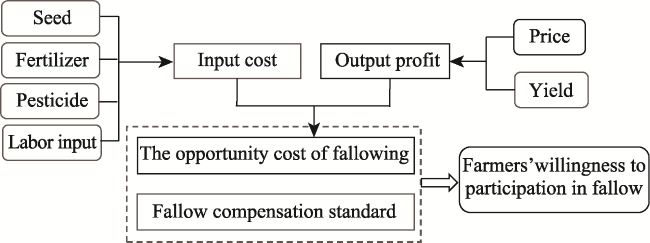
Fig. 1 The mechanism of wheat price change affecting fallow willingness |
Table 1 Farmers’ features and their expectations of fallow compensation |
| Farmer feature | Levels | Percentage (%) |
|---|---|---|
| Gender | Male | 80.1 |
| Female | 19.9 | |
| Age | 35 years old or below | 4.1 |
| 36-45 years old | 8.7 | |
| 46-55 years old | 31.1 | |
| 56-65 years old | 38.8 | |
| 66 years old or older | 17.3 | |
| Education level | Uneducated | 8.2 |
| Primary school | 33.2 | |
| Junior high school | 48.5 | |
| High school, Secondary school, Vocational college | 9.7 | |
| College or above | 0.1 | |
| Does the family have an off-farm income? | Yes | 28.6 |
| No | 71.4 | |
| The expectation of fallow compensation | < 400 yuan mu-1 | 24.2 |
| 400-500 yuan mu-1 | 26.6 | |
| 500-600 yuan mu-1 | 23.4 | |
| 600-700 yuan mu-1 | 18.7 | |
| > 700 yuan mu-1 | 7.1 |
Table 2 The satisfaction of fallow compensation as related to different farmer features |
| Farmer feature | Levels | Satisfied with the current compensation (%) | Unsatisfied with the current compensation (%) |
|---|---|---|---|
| Gender | Male | 55.45 | 44.55 |
| Female | 28.00 | 72.00 | |
| Age | 35 years old or below | 60.00 | 40.00 |
| 36-45 years old | 63.64 | 36.36 | |
| 46-55 years old | 53.85 | 46.15 | |
| 56-65 years old | 30.61 | 69.39 | |
| 66 years old or older | 77.27 | 22.73 | |
| Education level | Uneducated | 60.00 | 40.00 |
| Primary school | 32.31 | 67.69 | |
| Junior high school | 57.38 | 42.62 | |
| High school, secondary school, vocational college | 58.33 | 41.67 | |
| College or above | 100.00 | 0.00 | |
| Does the family have an off-farm income? | Yes | 63.89 | 36.11 |
| No | 44.44 | 55.56 |
Table 3 The estimation of the Cobb-Douglas production function |
| Variables | β | S.E. | Sig. |
|---|---|---|---|
| ln (sown area) | 0.999 | 0.075 | 0.000*** |
| ln (laborinput) | 0.033 | 0.019 | 0.019* |
| ln (capital input) | 0.030 | 0.070 | 0.038* |
| Age | 0.015 | 0.557 | 0.579 |
| Educational level | -0.13 | -0.497 | 0.620 |
| Constant | 7.153 | 0.473 | 0.000 |
| R2 | 0.935 | ||
Note: * means P < 0.1; *** means P < 0.01. |
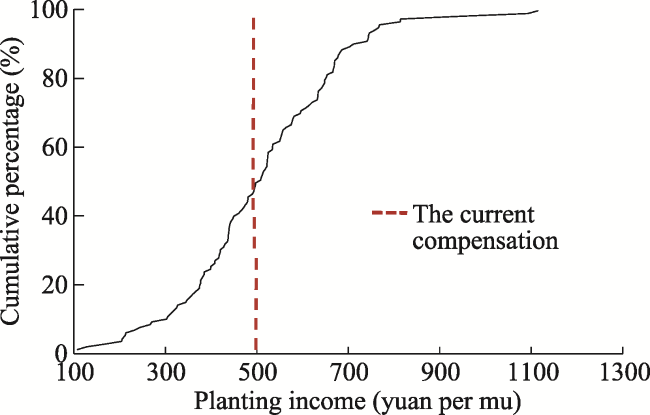
Fig. 2 Cumulative percentage of net income per mu |
Table 4 Comparison of farmers’ expected compensation and actual income per mu |
| Classification | Farmers’ expected compensation | Planting income | Gap |
|---|---|---|---|
| Number of households | Number of households | ||
| < 400 yuan | 30 | 32 | 2 |
| 400-500 yuan | 33 | 29 | -4 |
| 500-600 yuan | 29 | 27 | -2 |
| 600-700 yuan | 24 | 22 | -2 |
| > 700 yuan | 8 | 14 | 6 |
| Total | 124 | 124 | 0 |
Table 5 The effect of wheat price changes on planting income per mu |
| Winter wheat price (yuan per 500 g) | Price change (yuan per 500 g) | Shadow wage (yuan per day) | Average net income per mu (yuan) |
|---|---|---|---|
| 0.81 | -0.3 | 12.07 | 229.16 |
| 0.91 | -0.2 | 12.97 | 322.38 |
| 1.01 | -0.1 | 13.87 | 415.61 |
| 1.11 | 0 | 15.07 | 507.30 |
| 1.21 | 0.1 | 15.82 | 601.03 |
| 1.31 | 0.2 | 17.05 | 692.08 |
| 1.41 | 0.3 | 17.80 | 786.31 |
Fig. 3 Cumulative percentage of net income per mu under wheat price changes |
| 1 |
|
| 2 |
|
| 3 |
|
| 4 |
|
| 5 |
|
| 6 |
|
| 7 |
|
| 8 |
|
| 9 |
|
| 10 |
|
| 11 |
|
| 12 |
|
| 13 |
|
| 14 |
|
| 15 |
|
| 16 |
|
| 17 |
|
| 18 |
|
| 19 |
|
| 20 |
|
| 21 |
|
| 22 |
|
| 23 |
|
| 24 |
|
| 25 |
|
| 26 |
|
| 27 |
|
| 28 |
|
| 29 |
|
| 30 |
|
| 31 |
|
| 32 |
|
| 33 |
|
| 35 |
|
| 36 |
|
| 37 |
|
| 38 |
|
| 39 |
|
/
| 〈 |
|
〉 |