
Journal of Resources and Ecology >
Measurement and Comparison of Urban Haze Governance Level and Efficiency based on the DPSIR Model: A Case Study of 31 Cities in North China
|
XIAO Qinlin, E-mail: x853903799@163.com |
Received date: 2020-05-28
Accepted date: 2020-08-02
Online published: 2020-10-25
Supported by
The National Social Science Foundation of China(17BJY038)
Number of patent applications granted in different regions
Number of patent applications granted in different regions
In the decisive stage of developing of a moderately prosperous society in all aspects, hazy weather has become a major obstacle to the further advancement of China. Therefore, improving the level and efficiency of haze governance has become essential. Based on the DPSIR model, this paper builds a haze governance level and efficiency index system using the entropy method and the super-efficiency data envelope-analysis (DEA) model to analyze the data for 31 cities in North China from 2007 to 2016. From the aspects of spatial differences and influence factors influencing the comparative analysis, the results are as follows. (1) During the investigation period, the level and efficiency of city haze governance in North China showed a trend of fluctuation and decline, with obvious stages in their characteristics. Haze governance efficiency is much higher than its level, and its mean value reaches the DEA level which indicates that it is effective. (2) A significant regional gradient difference occurs between these two aspects. The haze governance level presents a convex distribution pattern of “east low-middle high-west low”, while the haze governance efficiency presents a concave distribution pattern of “east high-middle low-west high”. (3) The regression results show that economic growth has a negative effect on both haze governance level and efficiency. By contrast, the industrial structure has a positive effect on haze governance level and efficiency, but the significance of its effect on these two is different. On this basis, policy suggestions are proposed for improving the level and efficiency of haze governance in various cities in North China.
XIAO Qinlin , TIAN Chao , WANG Yanjun , LI Xiuqing , XIAO Liming . Measurement and Comparison of Urban Haze Governance Level and Efficiency based on the DPSIR Model: A Case Study of 31 Cities in North China[J]. Journal of Resources and Ecology, 2020 , 11(6) : 549 -561 . DOI: 10.5814/j.issn.1674-764x.2020.06.002
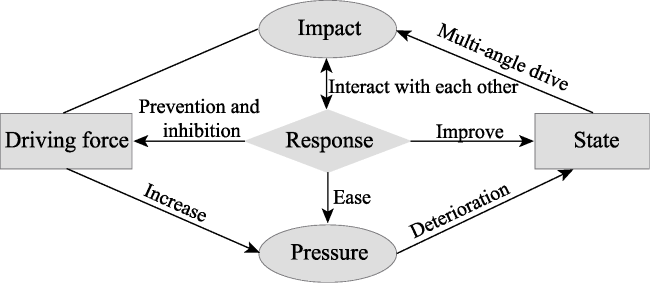
Fig. 1 DPSIR model as applied to haze governance |
Table 1 Index system of haze governance level |
| Target layer | Rule layer | Index layer | Unit | Direction |
|---|---|---|---|---|
| Haze governance level | Driving force | Municipal public infrastructure investment | ×104 yuan | positive |
| Urban personnel in the management of water conservancy, environment, and public facilities | ×104 person | positive | ||
| Energy consumption per unit of GDP | tons of standard coal (×104 yuan)-1 | negative | ||
| Pressure | Effluent discharge | t | negative | |
| Sulfur dioxide emission | t | negative | ||
| Dust discharge | t | negative | ||
| State | Proportion of secondary industry | % | negative | |
| Mean of PM2.5 | μg m-3 | negative | ||
| Impact | Domestic tourism revenue | ×104 yuan | positive | |
| Comprehensive utilization rate of solid waste | % | positive | ||
| Green coverage in built-up areas | % | positive | ||
| Response | Spending on science and technology as a share of GDP | % | positive | |
| Spending on education as a share of GDP | % | positive | ||
| Number of patent applications granted in different regions | number | positive |
Table 2 Index system of haze governance efficiency |
| Index type | Primary index | Secondary indicators | Unit | Direction |
|---|---|---|---|---|
| Input indicators | Capital investment | Municipal public infrastructure investment | ×104 yuan | positive |
| Spending on science and technology as a share of GDP | % | positive | ||
| Spending on education as a share of GDP | % | positive | ||
| Labor input | Urban personnel in the management of water conservancy, the environment, and public facilities | ×104 person | positive | |
| Technology input | Number of patent applications granted in different regions | number | positive | |
| Resources input | Energy consumption per unit of GDP | tons of standard coal (×104 yuan)-1 | negative | |
| Output indicators | Desirable output | Domestic tourism revenue | ×104 yuan | positive |
| Comprehensive utilization rate of solid waste | % | positive | ||
| Green coverage in built-up areas | % | positive | ||
| Undesirable output | Industrial wastewater discharge | t | negative | |
| Industrial sulfur dioxide emissions | t | negative | ||
| Industrial dust emission | t | negative | ||
| PM2.5 | μg m-3 | negative |
Fig. 2 Overall changes in the level and efficiency of urban haze governance in North China from 2007 to 2016 |
Table 3 Comparisons of haze governance level and efficiency for 31 cities in North China |
| Region | Haze governance level | Haze governance efficiency | Indifference between rank of level versus efficiency | ||||||||||||||||||||||||
|---|---|---|---|---|---|---|---|---|---|---|---|---|---|---|---|---|---|---|---|---|---|---|---|---|---|---|---|
| 2007 | 2010 | 2013 | 2016 | Mean | Ranking for level | 2007 | 2010 | 2013 | 2016 | Mean | Ranking for efficiency | ||||||||||||||||
| Taiyuan | 0.736 | 0.696 | 0.871 | 0.855 | 0.777 | 1 | 1.042 | 1.066 | 1.212 | 1.279 | 1.165 | 16 | ↑ | ||||||||||||||
| Shijiazhuang | 0.652 | 0.604 | 0.524 | 0.650 | 0.629 | 2 | 1.003 | 1.036 | 1.040 | 1.029 | 1.011 | 24 | ↑ | ||||||||||||||
| Hohhot | 0.458 | 0.456 | 0.364 | 0.483 | 0.471 | 3 | 1.334 | 1.427 | 1.398 | 1.117 | 1.401 | 4 | ↑ | ||||||||||||||
| Tangshan | 0.485 | 0.510 | 0.339 | 0.342 | 0.448 | 4 | 1.023 | 1.033 | 1.022 | 1.013 | 0.945 | 26 | ↑ | ||||||||||||||
| Baotou | 0.434 | 0.407 | 0.342 | 0.392 | 0.419 | 5 | 1.235 | 1.328 | 1.183 | 1.242 | 1.214 | 13 | ↑ | ||||||||||||||
| Handan | 0.422 | 0.433 | 0.353 | 0.362 | 0.409 | 6 | 1.009 | 1.031 | 1.040 | 0.764 | 0.963 | 25 | ↑ | ||||||||||||||
| Baoding | 0.433 | 0.413 | 0.366 | 0.414 | 0.401 | 7 | 1.109 | 1.089 | 1.353 | 1.668 | 1.275 | 9 | ↑ | ||||||||||||||
| Qinhuangdao | 0.488 | 0.393 | 0.305 | 0.406 | 0.382 | 8 | 1.605 | 1.240 | 1.208 | 1.044 | 1.278 | 8 | no change | ||||||||||||||
| Changzhi | 0.354 | 0.378 | 0.336 | 0.361 | 0.365 | 9 | 1.006 | 0.733 | 0.691 | 1.006 | 0.810 | 29 | ↑ | ||||||||||||||
| Datong | 0.368 | 0.390 | 0.319 | 0.334 | 0.362 | 10 | 1.001 | 1.053 | 1.049 | 1.144 | 1.028 | 22 | ↑ | ||||||||||||||
| Ordos | 0.328 | 0.379 | 0.276 | 0.248 | 0.359 | 11 | 1.468 | 1.672 | 1.345 | 1.364 | 1.437 | 3 | ↓ | ||||||||||||||
| Zhangjiakou | 0.380 | 0.324 | 0.284 | 0.355 | 0.343 | 12 | 1.004 | 1.038 | 1.096 | 1.152 | 1.053 | 21 | ↑ | ||||||||||||||
| Jinzhong | 0.334 | 0.352 | 0.318 | 0.342 | 0.340 | 13 | 1.072 | 1.200 | 1.374 | 1.370 | 1.194 | 14 | ↑ | ||||||||||||||
| Xinzhou | 0.350 | 0.376 | 0.366 | 0.303 | 0.339 | 14 | 1.729 | 1.297 | 1.125 | 0.738 | 1.157 | 18 | ↑ | ||||||||||||||
| Langfang | 0.464 | 0.373 | 0.258 | 0.358 | 0.336 | 15 | 1.280 | 1.049 | 1.069 | 1.091 | 1.088 | 20 | ↑ | ||||||||||||||
| Hulun Buir | 0.312 | 0.321 | 0.282 | 0.289 | 0.327 | 16 | 2.251 | 2.394 | 1.955 | 1.211 | 1.912 | 1 | ↓ | ||||||||||||||
| Chifeng | 0.389 | 0.331 | 0.266 | 0.323 | 0.321 | 17 | 1.361 | 1.138 | 1.135 | 1.206 | 1.170 | 15 | ↓ | ||||||||||||||
| Linfen | 0.330 | 0.352 | 0.290 | 0.299 | 0.319 | 18 | 1.039 | 1.053 | 0.721 | 0.701 | 0.839 | 28 | ↑ | ||||||||||||||
| Chengde | 0.362 | 0.330 | 0.264 | 0.319 | 0.316 | 19 | 1.012 | 1.094 | 1.212 | 1.104 | 1.159 | 17 | ↓ | ||||||||||||||
| Lvliang | 0.285 | 0.320 | 0.314 | 0.313 | 0.313 | 20 | 1.398 | 1.058 | 0.725 | 1.001 | 1.138 | 19 | ↓ | ||||||||||||||
| Jincheng | 0.329 | 0.315 | 0.287 | 0.261 | 0.309 | 21 | 1.080 | 1.007 | 1.018 | 1.049 | 1.026 | 23 | ↑ | ||||||||||||||
| Ulanqab | 0.290 | 0.277 | 0.251 | 0.248 | 0.282 | 22 | 1.835 | 1.224 | 1.473 | 1.748 | 1.580 | 2 | ↓ | ||||||||||||||
| Xingtai | 0.309 | 0.305 | 0.211 | 0.296 | 0.275 | 23 | 1.084 | 1.048 | 1.003 | 0.562 | 0.865 | 27 | ↑ | ||||||||||||||
| Wuhai | 0.290 | 0.305 | 0.257 | 0.306 | 0.273 | 24 | 1.591 | 1.238 | 1.319 | 1.318 | 1.283 | 7 | ↓ | ||||||||||||||
| Cangzhou | 0.333 | 0.281 | 0.207 | 0.271 | 0.269 | 25 | 1.389 | 1.577 | 1.078 | 1.029 | 1.249 | 11 | ↓ | ||||||||||||||
| Yuncheng | 0.274 | 0.261 | 0.258 | 0.242 | 0.264 | 26 | 0.494 | 1.010 | 0.664 | 1.001 | 0.799 | 31 | ↑ | ||||||||||||||
| Shuozhou | 0.251 | 0.270 | 0.258 | 0.196 | 0.256 | 27 | 1.390 | 1.248 | 1.328 | 1.236 | 1.345 | 5 | ↓ | ||||||||||||||
| Yangquan | 0.285 | 0.302 | 0.227 | 0.210 | 0.255 | 28 | 1.106 | 1.132 | 1.251 | 1.232 | 1.263 | 10 | ↓ | ||||||||||||||
| Bayan Nur | 0.257 | 0.353 | 0.232 | 0.225 | 0.255 | 29 | 1.008 | 1.473 | 1.139 | 1.117 | 1.216 | 12 | ↓ | ||||||||||||||
| Tongliao | 0.281 | 0.303 | 0.229 | 0.219 | 0.252 | 30 | 0.662 | 1.182 | 1.081 | 0.840 | 0.808 | 30 | no change | ||||||||||||||
| Hengshui | 0.298 | 0.256 | 0.177 | 0.237 | 0.222 | 31 | 1.268 | 1.137 | 1.459 | 1.745 | 1.323 | 6 | ↓ | ||||||||||||||
| Hebei | 0.421 | 0.384 | 0.299 | 0.365 | 0.366 | Ⅰ | 1.162 | 1.125 | 1.144 | 1.109 | 1.110 | Ⅱ | ↑ | ||||||||||||||
| Shanxi | 0.354 | 0.365 | 0.349 | 0.338 | 0.354 | Ⅱ | 1.123 | 1.078 | 1.014 | 1.069 | 1.069 | Ⅲ | ↑ | ||||||||||||||
| Inner Mongolia | 0.338 | 0.348 | 0.278 | 0.304 | 0.329 | Ⅲ | 1.416 | 1.453 | 1.337 | 1.240 | 1.336 | Ⅰ | ↓ | ||||||||||||||
| North China | 0.373 | 0.367 | 0.311 | 0.337 | 0.351 | ‒ | 1.222 | 1.203 | 1.154 | 1.133 | 1.161 | ‒ | ‒ | ||||||||||||||
Note: Due to the length of this table, only the calculation results of some years are shown. ↑and ↓ represent the rise and fall of the rankings, respectively. |
Fig. 3 Distribution of urban haze governance level (a) and efficiency (b) in North China from 2007 to 2016 |
Table 4 Descriptive statistics of the main variables |
| Variable | Variable name | Unit | Observations | Mean | S.D. | Minimum value | Maximum value |
|---|---|---|---|---|---|---|---|
| hgl | Haze governance level | - | 310 | 0.35 | 0.12 | 0.177 | 0.87 |
| hge | Haze governance efficiency | - | 310 | 1.16 | 0.31 | 0.484 | 2.66 |
| pgdp | GDP per capita | yuan person-1 | 310 | 48973.99 | 46015.47 | 8395 | 371725 |
| is | Proportion of secondary industry | % | 310 | 51.74 | 8.30 | 27.87 | 73.71 |
| fdi | Actual utilization of foreign capital | ×104 yuan | 310 | 228000 | 245000 | 1328.46 | 1300000 |
| ds | Population density | person km-2 | 310 | 4467.28 | 3429.06 | 248 | 12968 |
| js | Proportion of construction land in urban area | % | 310 | 13.15 | 14.21 | 0.67 | 97.18 |
Table 5 Analysis of factors affecting the level and efficiency of haze governance |
| Variables | ln hgl | ln hge | ||
|---|---|---|---|---|
| Regression coefficient | T statistic | Regression coefficient | T statistic | |
| C | 0.2759** | 2.35 | 0.4642 | 0.74 |
| ln pgdp | -0.0141*** | -3.48 | -0.0786*** | -3.63 |
| ln is | 0.0530** | 2.19 | 0.1264 | 0.98 |
| ln fdi | -0.0067** | -2.15 | 0.0174 | 1.04 |
| ln ds | 0.0052 | 1.09 | -0.0125 | -0.49 |
| ln js | -0.0008 | -0.14 | -0.0604** | -2.02 |
| R2 | 0.0935 | 0.0723 | ||
| F-statistic | 5.65 | 4.27 | ||
| Prob(F-statistic) | 0.0000 | 0.0000 | ||
| N | 310 | 310 | ||
Note: *, ** and *** indicate significance at the 10%, 5% and 1% levels, respectively. |
| 1 |
|
| 2 |
|
| 3 |
|
| 4 |
|
| 5 |
|
| 6 |
|
| 7 |
|
| 8 |
|
| 9 |
|
| 10 |
|
| 11 |
|
| 12 |
|
| 13 |
|
| 14 |
|
| 15 |
|
| 16 |
|
| 17 |
|
| 18 |
|
| 19 |
|
| 20 |
|
| 21 |
|
| 22 |
|
| 23 |
|
| 24 |
|
| 25 |
|
| 26 |
|
| 27 |
|
| 28 |
|
| 29 |
|
| 30 |
|
| 31 |
|
| 32 |
|
/
| 〈 |
|
〉 |

