
Journal of Resources and Ecology >
Economic Development Status of the Countries along the Belt and Road and Their Correlations with Population and Carbon Emissions
|
ZHONG Yang, E-mail: zhongyang9093@whu.edu.cn |
Received date: 2020-04-16
Accepted date: 2020-06-15
Online published: 2020-10-25
Supported by
The National Social Science Foundation of China(18ZDA040)
The construction of the Silk Road Economic Belt and the 21st Century Maritime Silk Road are important measures for allowing China to expand its opening up to the outside world under the background of economic globalization. Based on this consideration, and from the perspective of geo-economics, this study uses a variety of mathematical statistical methods to analyze the economic development status and differences among the 30 countries along the Belt and Road. In addition, the correlations between GDP, population and carbon emissions in these countries are also analyzed. The results show that the current economic development levels of the countries along the Belt and Road are quite variable; the gaps between the indicators of the economic development of the countries along the Belt and Road are convergent; the GDP, population, and carbon emissions of the countries along the Belt and Road each showed an overall upward trend during the study period, and the changes in these three values showed significant correlations. Across all countries, the correlation coefficients between GDP and population (0.989), between GDP and carbon emissions (0.995), and between population and carbon emissions (0.993), all indicate that the correlations between GDP, population and carbon emissions are very high. Among them, GDP has the highest correlation with carbon emissions, reaching 0.995. Regression analysis shows that the value of R² reached 0.995, indicating that the regression fitting effect is very good and the calculation result is highly reliable. Based on these results, this paper proposes the following two suggestions: (1) Promoting the Belt and Road initiative should handle the relationship between developing and developed countries; and (2) Promoting the Belt and Road initiative should also be linked to China's domestic regional development strategy.
Key words: the Belt and Road; geo-economics; correlation; globalization; China
ZHONG Yang , LIN Aiwen , ZHOU Zhigao , HE Lijie , YUAN Moxi . Economic Development Status of the Countries along the Belt and Road and Their Correlations with Population and Carbon Emissions[J]. Journal of Resources and Ecology, 2020 , 11(6) : 539 -548 . DOI: 10.5814/j.issn.1674-764x.2020.06.001
Table 1 Criteria for Chennai’s economic development stage divisions |
| Phase I | Phase II | Phase III | Remarks | ||||
|---|---|---|---|---|---|---|---|
| Primary product | Industrialization | Developed economy | |||||
| Production stage I | Production stage II | Initial | Medium term | Late | Initial | Era | |
| 100-140 | 140-280 | 280-560 | 560-1120 | 1120-2100 | 2100-3360 | 3360-5040 | US dollars in 1970 |
| 340-470 | 470-940 | 940-1890 | 1890-3770 | 3770-7070 | 7070-11310 | 11310-16970 | US dollars in 1990 |
| 393-550 | 550-1100 | 1100-2200 | 2200-4400 | 4400-8250 | 8250-13200 | 13200-19800 | US dollars in 1995 |
| 440-620 | 620-1240 | 1240-2490 | 2490-4970 | 4970-9320 | 9320-14910 | 14910-22380 | US dollars in 2000 |
| 500-710 | 710-1410 | 1410-2820 | 2820-5640 | 5640-10570 | 10570-16920 | 16920-25380 | US dollars in 2005 |
| 560-790 | 790-1570 | 1570-3150 | 3150-6300 | 6300-11810 | 11810-18900 | 18900-28350 | US dollars in 2015 |
Table 2 Classification of economic growth rates along the Belt and Road* |
| Economic growth rate | >7% | 5%-7% | 2%-5% | <2% |
|---|---|---|---|---|
| Countries and regions | Laos, China, Tajikistan, Afghanistan, Cambodia, Indonesia, Kyrgyzstan, Thailand | Kazakhstan, Uzbekistan, Bangladesh, Saudi Arabia, Russia, Pakistan | Italy, Malaysia, Philippines, Sweden, Vietnam, Turkmenistan | United Kingdom, France, Germany, Singapore, Netherlands, Japan, Iran |
Note: * There are lacks of data for a few countries (regions) and the countries (regions) did not participate in the classification. |
Table 3 Classification of national industrial competitiveness along the Belt and Road |
| Stage | Industrialization starting stage | Industrial process | Late industrialization |
|---|---|---|---|
| Countries and regions | Myanmar, Cambodia, Laos, Tajikistan, Pakistan, Afghanistan | Uzbekistan, Vietnam, India, Kyrgyzstan, Bangladesh, Philippines, Turkmenistan, Kazakhstan, Indonesia, Thailand, Iran, China | Malaysia, Russia, South Korea, Italy, Saudi Arabia, Netherlands, France, Sweden, Japan, Germany, United Kingdom, Singapore |
Table 4 Stages of urbanization along the Belt and Road* |
| Stages of urbanization | First level (>70%) | Second level (30%-70%) | Third level (<30%) |
|---|---|---|---|
| Countries and regions | Singapore, Japan, Netherlands, Sweden, Saudi Arabia, South Korea, United Kingdom, France, Germany, Malaysia, Russia, Iran | Italy, China, Kazakhstan, Indonesia, Turkmenistan, Thailand, Philippines, Pakistan, Uzbekistan, Kyrgyzstan, Myanmar, Bangladesh, India | Tajikistan, Afghanistan, Cambodia |
Note: * There are lacks of data for a few countries (regions) and the countries (regions) did not participate in the classification. |
Table 5 Coefficients of variation for some economic indicators of the countries along the Belt and Road from 2003 to 2014 |
| Years | GDP per capita | Exports as a share of GDP | Service industry added value as a share of GDP | Industrial added value as a share of GDP | Imports as a share of GDP | Agricultural added value as a share of GDP | Total capital formation |
|---|---|---|---|---|---|---|---|
| 2003 | 1.341 | 0.875 | 0.270 | 0.296 | 0.791 | 0.963 | 0.316 |
| 2004 | 1.337 | 0.884 | 0.261 | 0.289 | 0.791 | 0.965 | 0.317 |
| 2005 | 1.296 | 0.900 | 0.253 | 0.285 | 0.778 | 0.983 | 0.281 |
| 2006 | 1.267 | 0.902 | 0.253 | 0.287 | 0.772 | 0.990 | 0.287 |
| 2007 | 1.258 | 0.871 | 0.251 | 0.279 | 0.731 | 0.981 | 0.292 |
| 2008 | 1.229 | 0.917 | 0.252 | 0.283 | 0.783 | 0.988 | 0.271 |
| 2009 | 1.223 | 0.874 | 0.242 | 0.289 | 0.735 | 0.998 | 0.322 |
| 2010 | 1.181 | 0.881 | 0.248 | 0.290 | 0.739 | 1.006 | 0.305 |
| 2011 | 1.158 | 0.856 | 0.258 | 0.301 | 0.724 | 0.993 | 0.333 |
| 2012 | 1.159 | 0.855 | 0.251 | 0.293 | 0.712 | 0.975 | 0.364 |
| 2013 | 1.156 | 0.849 | 0.237 | 0.272 | 0.709 | 0.951 | 0.347 |
| 2014 | 1.159 | 0.855 | 0.231 | 0.265 | 0.706 | 0.938 | 0.322 |
Table 6 Changes of GDP, population and carbon emissions of countries along the Belt and Road in 2002-2014 |
| Countries | 2002 | 2014 | Average annual growth rate (%) | ||||||
|---|---|---|---|---|---|---|---|---|---|
| GDP (×108 USD) | Population (×104 person) | Carbon emission (×104 t) | GDP (×108 USD) | Population (×104 person) | Carbon emission (×104 t) | GDP | Population | Carbon emission | |
| Afghanistan | 40.55 | 2260.08 | 107.08 | 204.85 | 3337.08 | 980.92 | 31.17 | 3.67 | 62.78 |
| Bangladesh | 547.24 | 13247.81 | 3370.71 | 1728.85 | 15452.02 | 7318.97 | 16.61 | 1.28 | 9.01 |
| China | 14705.50 | 128040 | 385026.93 | 104385.29 | 136427.00 | 1029192.69 | 46.91 | 0.50 | 12.87 |
| Germany | 20791.36 | 8248.85 | 82972.48 | 38987.27 | 8098.25 | 71988.34 | 6.73 | -0.14 | -1.02 |
| France | 14942.87 | 6180.53 | 37507.54 | 28521.66 | 6631.61 | 30327.56 | 6.99 | 0.56 | -1.47 |
| United Kingdom | 17730.16 | 5937.05 | 52864.21 | 30347.29 | 6461.32 | 41982.02 | 5.47 | 0.68 | -1.58 |
| Indonesia | 1956.61 | 21735.78 | 30673.72 | 8908.15 | 25512.90 | 46417.62 | 27.33 | 1.34 | 3.95 |
| India | 5149.38 | 109331.72 | 105425.88 | 20391.27 | 129560.42 | 223837.71 | 22.77 | 1.42 | 8.64 |
| Iran | 1286.27 | 6728.48 | 40176.02 | 4344.75 | 7746.58 | 64948.07 | 18.29 | 1.16 | 4.74 |
| Italy | 12665.11 | 5705.90 | 45261.05 | 21517.33 | 6078.91 | 32041.15 | 5.38 | 0.50 | -2.25 |
| Japan | 41151.16 | 12744.50 | 122004.76 | 48504.14 | 12727.60 | 121404.84 | 1.37 | -0.01 | -0.04 |
| Kazakhstan | 246.37 | 1485.89 | 13373.55 | 2214.16 | 1728.83 | 24831.46 | 61.44 | 1.26 | 6.59 |
| Kyrgyzstan | 16.06 | 499.07 | 495.78 | 74.68 | 583.55 | 960.75 | 28.09 | 1.30 | 7.21 |
| Cambodia | 42.84 | 1263.77 | 220.75 | 167.03 | 1527.45 | 668.49 | 22.30 | 1.60 | 15.60 |
| South Korea | 6090.20 | 4764.47 | 46563.20 | 14113.34 | 5074.67 | 58715.64 | 10.13 | 0.50 | 2.01 |
| Laos | 17.58 | 549.32 | 115.14 | 132.68 | 663.98 | 195.45 | 50.36 | 1.61 | 5.37 |
| Myanmar | 67.78 | 4770.22 | 920.78 | 654.46 | 5228.08 | 2163.16 | 66.59 | 0.74 | 10.38 |
| Malaysia | 1008.45 | 2420.84 | 13374.28 | 3380.62 | 2986.66 | 24282.14 | 18.09 | 1.80 | 6.27 |
| Netherlands | 4716.14 | 1614.89 | 18166.32 | 8909.81 | 1686.50 | 16730.32 | 6.84 | 0.34 | -0.61 |
| Pakistan | 723.07 | 14954.97 | 11408.40 | 2443.61 | 19530.68 | 16629.85 | 18.30 | 2.35 | 3.52 |
| Philippines | 813.58 | 8136.53 | 7133.78 | 2845.85 | 10051.31 | 10565.36 | 19.21 | 1.81 | 3.70 |
| Russia | 3454.70 | 14530.60 | 155708.52 | 20599.84 | 14381.97 | 170534.57 | 38.18 | -0.08 | 0.73 |
| Saudi Arabia | 1896.06 | 2180.53 | 32640.70 | 7563.50 | 3091.70 | 60104.70 | 22.99 | 3.21 | 6.47 |
| Singapore | 925.38 | 417.60 | 4723.10 | 3148.51 | 546.97 | 5637.28 | 18.48 | 2.38 | 1.49 |
| Sweden | 2643.46 | 892.50 | 5742.52 | 5744.13 | 969.61 | 4342.09 | 9.02 | 0.66 | -1.88 |
| Thailand | 1343.01 | 6406.91 | 20832.23 | 4073.39 | 6843.87 | 31621.27 | 15.64 | 0.52 | 3.98 |
| Tajikistan | 12.21 | 642.69 | 188.12 | 91.13 | 825.28 | 518.88 | 49.71 | 2.19 | 13.53 |
| Turkmenistan | 44.62 | 461.00 | 3996.66 | 435.24 | 546.63 | 6842.26 | 67.34 | 1.43 | 5.48 |
| Uzbekistan | 96.88 | 2527.19 | 12834.87 | 766.59 | 3075.77 | 10521.36 | 53.18 | 1.67 | -1.39 |
| Vietnam | 350.64 | 8153.44 | 7080.61 | 1862.05 | 9171.46 | 16691.08 | 33.16 | 0.96 | 10.44 |
| Total | 138093.97 | 396833.12 | 1260909.7 | 387061.46 | 446548.65 | 2132995.99 | 13.87 | 0.96 | 5.32 |
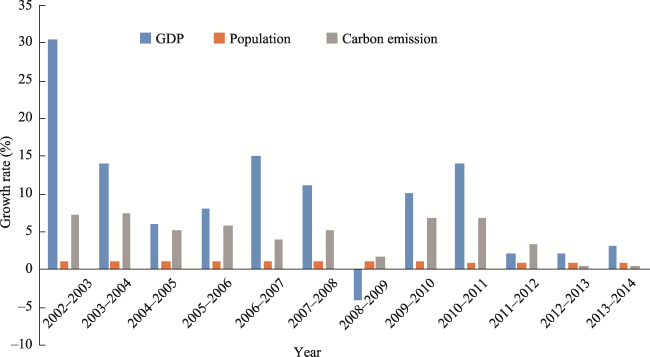
Fig. 1 Annual growth of GDP, population, and carbon emission in the countries along the Belt and Road in 2002-2014. |
| 1 |
|
| 2 |
|
| 3 |
|
| 4 |
|
| 5 |
|
| 6 |
|
| 7 |
|
| 8 |
|
| 9 |
|
| 10 |
|
| 11 |
|
| 12 |
|
| 13 |
|
| 14 |
|
| 15 |
|
| 16 |
|
| 17 |
|
| 18 |
|
| 20 |
|
| 21 |
|
| 22 |
|
| 23 |
|
| 24 |
|
| 25 |
|
| 26 |
|
| 27 |
|
| 28 |
|
| 29 |
|
| 30 |
|
| 31 |
|
| 32 |
|
| 33 |
|
| 34 |
|
| 35 |
|
/
| 〈 |
|
〉 |