
Journal of Resources and Ecology >
Physiological Responses of Pistia stratiotes and Its Fluoride
Removal Efficiency
Received date: 2020-04-01
Accepted date: 2020-05-25
Online published: 2020-09-30
Supported by
The National Natural Science Foundation of China(E080402)
Two High Foundation of Xichang College(LGLZ201906)
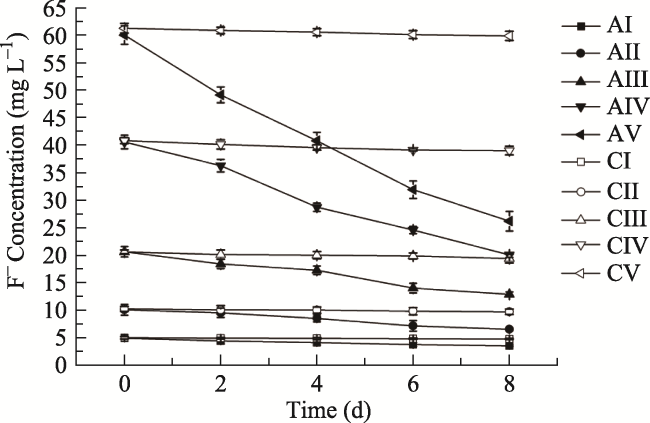
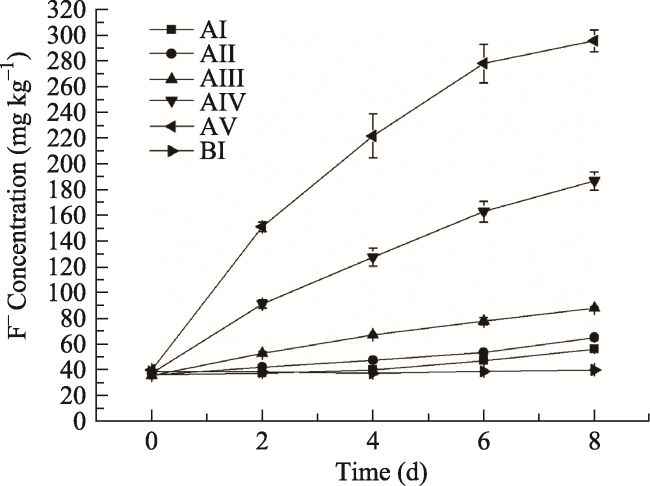
Phytoremediation technology using aquatic plants is being used increasingly in constructed wetlands to purify wastewater. The physiological responses of water lettuce (Pistia stratiotes) and its effectiveness in removing fluoride (F -) from water are described in this article. The results indicate that Pistia stratiotes has the ability to accumulate F -. The removal efficiency ranged from 27.79% to 56.32% for the various initial F -concentrations tested, and was highest (56.32%) in the highest initial concentration group 60mg/L. The F - concentrations in control groups (without Pistia stratiotes) changed very little, from -1.135% to -0.007% of the initial concentrations. At the highest removal rate, the bioconcentration factor was 7.84. The rate of purification conformed to the Michaelis-Menten equation, and the correlation coefficients (R 2) were all greater than 0.97. The Specific Growth Rates (SGR) of the treatment groups were -8.03% to -1.22%, and the SGR of plants under F -stress decreased during the experimental period. The partial correlation analysis showed that concentrations of F - in water were strongly linearly correlated with peroxidase.
Key words: P. stratiotes; antioxidant enzyme; fluoride; dynamic; POD
ZHANG Yun
,
CHEN Jinfa
. Physiological Responses of Pistia stratiotes and Its Fluoride
Removal Efficiency[J]. Journal of Resources and Ecology, 2020
, 11(5)
: 525
-530
.
DOI: 10.5814/j.issn.1674-764x.2020.05.010
Fig. 1 Variation of F- concentrations over time starting from different initial F- concentrations for treatment groups (AI-AV) and control groups without plants (CI-CV).Note: Error bars represent one standard deviation from the mean, n = 3. |
Table 1 Kinetic parameters of fluoride removal from treated water |
| Group | C0 (mg L-1) | Vmax (mg L-1 h-1) | Km (mg L-1) | R2 |
|---|---|---|---|---|
| AI | 5 | 0.2533 | -3.4237 | 0.9806 |
| AII | 10 | 0.485 | -7.1748 | 0.9808 |
| AIII | 20 | 1.1145 | -16.4028 | 0.9766 |
| AIV | 40 | 2.96 | -43.6132 | 0.9895 |
| AV | 60 | 5.427 | -77.0471 | 0.9898 |
Table 2 Effect of different concentrations of fluoride on the growth characteristics of P. stratiotes |
| Treatment groups | AI | AII | AIII | AIV | AV | BI | |
|---|---|---|---|---|---|---|---|
| Fresh weight (g) | Initial | 101.4 | 101.8 | 101.9 | 101.5 | 103.0 | 102.8 |
| Ending | 92.0 | 86.9 | 76.3 | 65.6 | 54.2 | 143.6 | |
| SGR (% d-1) | -1.22 | -1.98 | -3.62 | -5.46 | -8.03 | 4.18 | |
Note: Specific Growth Rate (SGR) = (lnWt-InW0)/t×100%. Wt is the weight of P. stratiotes at t days, g; W0 is the initial weight of P. stratiotes, g. |
Fig. 2 Effect of initial F- concentration on fluoride concentration in P. stratiotes leaves.Note: Error bars represent one standard deviation from the mean, n = 3 (for treatments with F- concentrations of 0, 5, 10, 20, 40 and 60 mg L-1) |
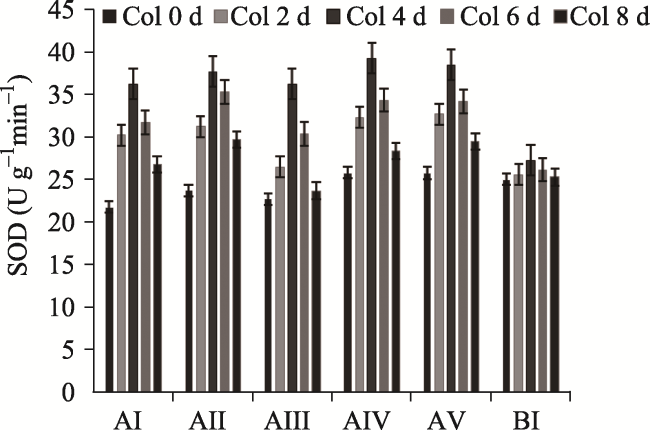
Fig. 3 Effects of different concentrations of F- on the activities of SOD in P. stratiotes (treated with F- concentrations of 0, 5, 10, 20, 40 and 60 mg L-1) |
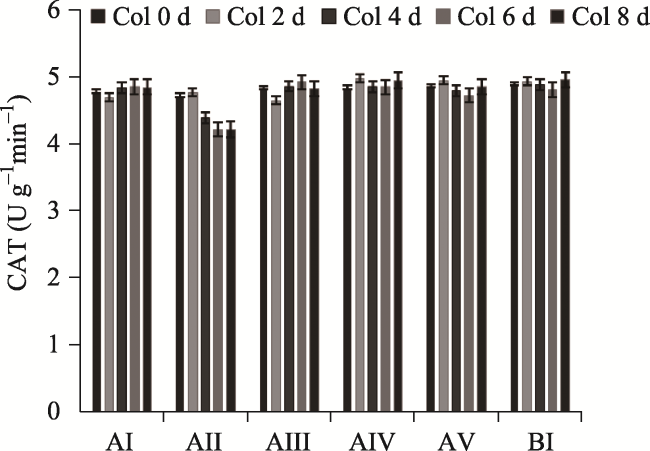
Fig. 4 Effects of different concentrations of F- on the activities of CAT in P. stratiotes (treated with F- concentration of 0, 5, 10, 20, 40 and 60 mg L-1) |
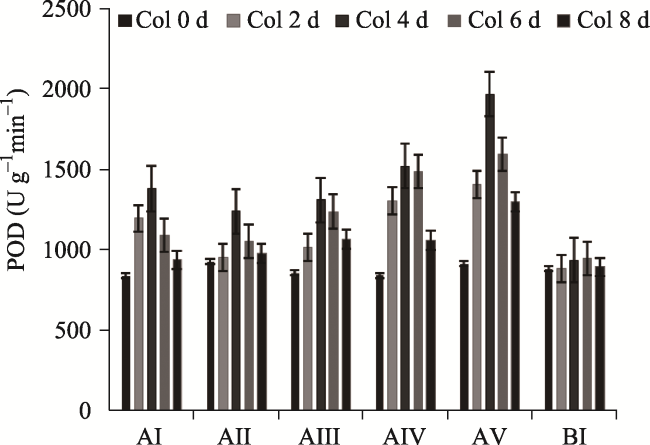
Fig. 5 Effects of different concentrations of F- on the activities of POD in P. stratiotes (treated with F- concentration of 0, 5, 10, 20, 40 and 60 mg L-1) |
Table 3 Significance and PCCs between fluoride and the physiological indexes of the plant |
| Treatment groups | AI | AII | AIII | AIV | AV | ||
|---|---|---|---|---|---|---|---|
| Variable Significance coefficient P | 0.0057 | 0.0097 | 0.0095 | 0.0012 | 0.0167 | ||
| PCCs | Control SOD&CAT | F- in water / Fluoride in leaves | 0.999 | 1.000 | 0.804 | 0.989 | 0.999 |
| Control SOD&POD | 0.982 | 0.967 | 0.995 | 0.995 | 1.000 | ||
| Control CAT&POD | 1.000 | 1.000 | 0.987 | 0.993 | 0.997 | ||
| Control SOD&CAT | F- in water / POD | 0.900 | 0.848 | 0.999 | 0.781 | 0.706 | |
| Control SOD&POD | F- in water / CAT | 0.653 | 0.645 | 0.990 | 0.486 | 0.958 | |
| Control CAT&POD | F- in water / SOD | 0.911 | 0.804 | 1.000 | 0.855 | 0.672 | |
Notes: P: Significance coefficient; 0.01< P < 0.05: significant difference; P < 0.01: highly significant difference; PCCs: 0-0.19: very low correlation; 0.2-0.39: low correlation; 0.4-0.69: medium correlation; 0.7-0.89: high correlation; 0.9-1.0: very high correlation. |
| 1 |
|
| 2 |
|
| 3 |
|
| 4 |
|
| 5 |
|
| 6 |
|
| 7 |
|
| 8 |
|
| 9 |
|
| 10 |
|
| 11 |
|
| 12 |
|
| 13 |
|
| 14 |
|
| 15 |
|
| 16 |
|
| 17 |
|
| 18 |
|
| 19 |
|
| 20 |
|
| 21 |
|
| 22 |
|
| 23 |
|
| 24 |
|
| 25 |
|
| 26 |
|
| 27 |
|
| 28 |
|
| 29 |
|
| 30 |
|
| 31 |
|
| 32 |
|
| 33 |
|
| 34 |
|
| 35 |
|
/
| 〈 |
|
〉 |