
Journal of Resources and Ecology >
Effect of Long-term Experimental Warming on the Nutritional Quality of Alpine Meadows in the Northern Tibet
Received date: 2020-03-27
Accepted date: 2020-06-02
Online published: 2020-09-30
Supported by
Foundation: The Youth Innovation Promotion Association of Chinese Academy of Sciences(2020054)
The National Key Research Projects of China(2016YFC0502005)
The National Key Research Projects of China(2017YFA0604801)
The Second Comprehensive Scientific Investigation of the Tibetan Plateau(2019QZKK0302)
The National Natural Science Foundation of China(31600432)
Bingwei Outstanding Young Talents Program of Institute of Geographic Sciences and Natural Resources Research, Chinese Academy of Sciences(2018RC202)
Tibet Science and Technology Major Projects of the Pratacultural Industry(XZ201901NA03)
The nutritional quality of grasslands is closely related to recruitment of young and population dynamics of livestock and wild herbivores. However, the response of nutritional quality to climate warming has not been fully understood in the alpine meadow on the Tibetan Plateau, especially in the Northern Tibet. Here, we investigated the effect of experimental warming ( beginning in 2008) on nutritional quality in three alpine meadows (site A: 4313 m, B: 4513 m and C: 4693 m) in the Northern Tibet. Crude protein (CP), neutral detergent fiber (NDF), acid detergent fiber (ADF), crude ash (Ash), ether extract (EE) and water-soluble carbohydrate (WSC) were examined in 2018-2019. Experimental warming only increased the content of CP by 27.25%, ADF by 89.93% and NDF by 41.20%, but it decreased the content of Ash by 57.76% in 2019 at site B. The contents of CP and WSC both increased with soil moisture (SM). The content of CP decreased with vapor pressure deficit (VPD). The combined effect of SM and VPD was greater than air temperature (Ta) in controlling the variations of the CP content, ADF content and nutritional quality. Compared to Ta, VPD explained more of the variation in NDF and Ash content. All of these findings suggest that warming effects on nutritional quality may vary with site and year, and water availability may have a stronger effect on the nutritional quality than temperature in the alpine meadow of the Northern Tibet.
SUN Wei , LI Shaowei , ZHANG Yangjian , FU Gang . Effect of Long-term Experimental Warming on the Nutritional Quality of Alpine Meadows in the Northern Tibet[J]. Journal of Resources and Ecology, 2020 , 11(5) : 516 -524 . DOI: 10.5814/j.issn.1674-764x.2020.05.009
Table 1 Annual mean temperature (AT) and precipitation (AP), and growing season (June-September) temperature (GST) and precipitation (GSP) in 1963-2019, 2018 and 2019 in the Damxung County, Lhasa City, Tibet, China |
| Year | AT (℃) | AP (mm) | GST (℃) | GSP (mm) |
|---|---|---|---|---|
| 1963-2019 | 1.96±0.80 | 476.36±96.69 | 10.02±0.62 | 400.45±86.83 |
| 2018 | 2.67 | 667.00 | 10.82 | 589.10 |
| 2019 | 3.08 | 426.20 | 11.14 | 372.40 |
Table 2 Repeated analysis of variance for the main and interactive effects of experimental warming (W) and measurement year on soil temperature (Ts), soil moisture (SM), air temperature (Ta) and vapor pressure deficit (VPD) |
| Site Model | Ts | SM | Ta | VPD | |||||
|---|---|---|---|---|---|---|---|---|---|
| F | P | F | P | F | P | F | P | ||
| A | W | 25.01 | 0.007 | 1.22 | 0.331 | 0.95 | 0.385 | 0.14 | 0.731 |
| Y | 12.11 | 0.025 | 1.60 | 0.275 | 0.09 | 0.774 | 5.29 | 0.083 | |
| W×Y | 0.02 | 0.891 | 0.11 | 0.753 | 0.02 | 0.897 | 0.79 | 0.425 | |
| B | W | 215.52 | <0.001 | 3.41 | 0.139 | 4.33 | 0.106 | 17.07 | 0.014 |
| Y | 5.00 | 0.089 | 6.62 | 0.062 | 0.42 | 0.554 | 81.01 | 0.001 | |
| W×Y | 1.93 | 0.237 | 0.00 | 0.952 | 0.02 | 0.883 | 2.90 | 0.164 | |
| C | W | 43.26 | 0.003 | 1.78 | 0.253 | 10.09 | 0.034 | 149.08 | <0.001 |
| Y | 0.19 | 0.683 | 14.93 | 0.018 | 0.15 | 0.718 | 379.35 | <0.001 | |
| W×Y | 5.49 | 0.079 | 1.21 | 0.334 | 1.10 | 0.355 | 25.49 | 0.007 | |
Note: F: f values; P: significance probability. |
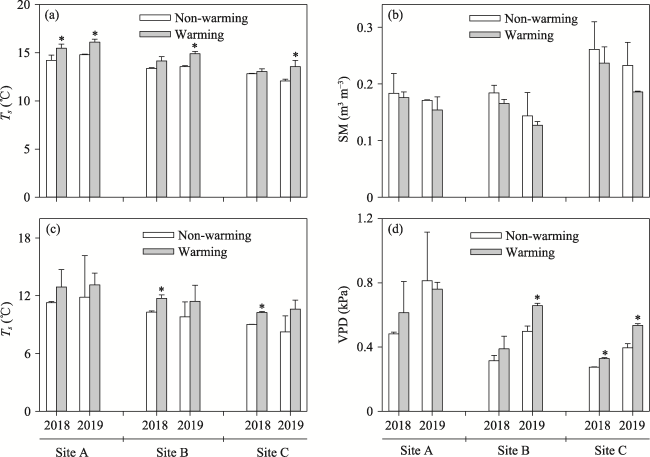
Fig. 1 Comparisons of (a) soil temperature (Ts), (b) soil moisture (SM), (c) air temperature (Ta) and (d) vapor pressure deficit (VPD) between non-warming and warming treatments at sites A, B and C in 2018 and 2019Note: * indicates P<0.05. |
Table 3 Repeated analysis of variance for the main and interactive effects of experimental warming (W) and measurement year on the content of crude protein (CP), acid detergent fiber (ADF), neutral detergent fiber (NDF), crude ash (Ash), ether extract (EE) and water-soluble carbohydrate (WSC) |
Site Model | CP | ADF | NDF | Ash | EE | WSC | |||||||
|---|---|---|---|---|---|---|---|---|---|---|---|---|---|
| F | P | F | P | F | P | F | P | F | P | F | P | ||
| A | W | 2.40 | 0.197 | 6.71 | 0.061 | 0.15 | 0.716 | 0.25 | 0.645 | 0.01 | 0.919 | 0.11 | 0.761 |
| Y | 32.37 | 0.005 | 5.86 | 0.073 | 8.59 | 0.043 | 3.86 | 0.121 | 2.75 | 0.172 | 1.36 | 0.308 | |
| W×Y | 0.85 | 0.410 | 2.29 | 0.205 | 0.05 | 0.841 | 0.03 | 0.870 | 2.12 | 0.220 | 0.21 | 0.670 | |
| B | W | 79.22 | 0.001 | 4.99 | 0.089 | 23.00 | 0.009 | 24.52 | 0.008 | 5.73 | 0.075 | 0.85 | 0.409 |
| Y | 24.56 | 0.008 | 1.61 | 0.273 | 15.18 | 0.018 | 0.65 | 0.467 | 0.44 | 0.545 | 10.49 | 0.032 | |
| W×Y | 0.00 | 0.975 | 0.08 | 0.793 | 2.38 | 0.198 | 2.78 | 0.171 | 1.07 | 0.360 | 9.33 | 0.038 | |
| C | W | 0.21 | 0.668 | 3.98 | 0.117 | 0.77 | 0.429 | 1.14 | 0.346 | 0.06 | 0.813 | 0.79 | 0.423 |
| Y | 77.38 | 0.001 | 17.92 | 0.013 | 41.27 | 0.003 | 1.00 | 0.373 | 0.53 | 0.506 | 1.38 | 0.306 | |
| W×Y | 4.21 | 0.109 | 0.01 | 0.926 | 1.33 | 0.313 | 2.96 | 0.161 | 0.64 | 0.470 | 0.18 | 0.690 | |
Note: F: f values; P: significance probability. |
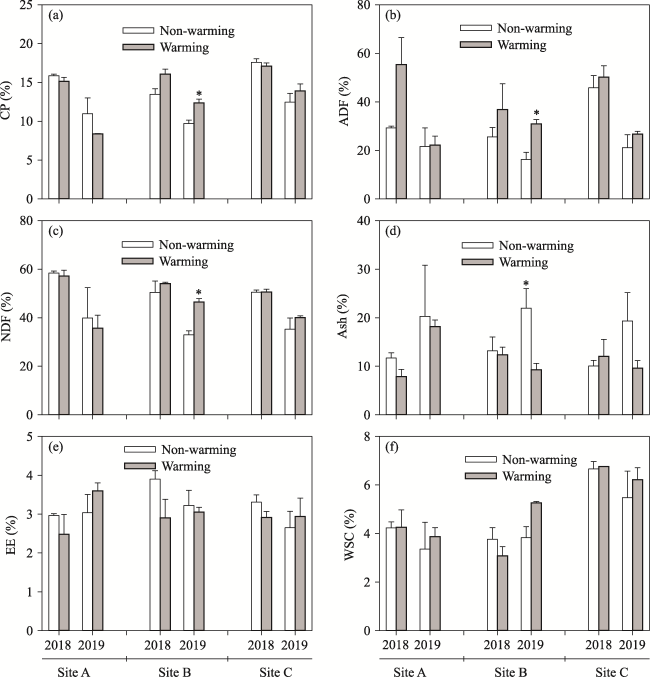
Fig. 2 Comparisons of (a) crude protein (CP), (b) acid detergent fiber (ADF), (c) neutral detergent fiber (NDF), (d) crude ash (Ash), (e) ether extract (EE) and (f) water-soluble carbohydrate (WSC) between non-warming and warming treatments at sites A, B and C in 2018 and 2019Note: * indicates P<0.05. |
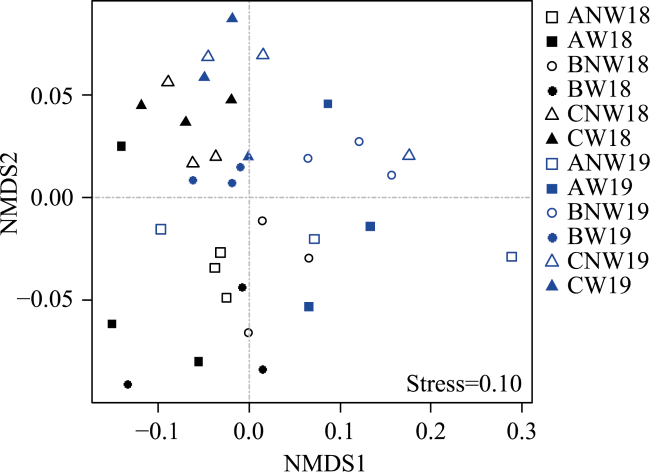
Fig. 3 Nonmetric multidimensional scaling (NMDS) analysis of the nutritional qualityNote: Legend abbreviations: ANW18: site A of non-warming treatment in 2018; AW18: site A of warming treatment in 2018; BNW18: site B of non- warming treatment in 2018; BW18: site B of warming treatment in 2018; CNW18: site C of non-warming treatment in 2018; CW18: site C of warming treatment in 2018; ANW19: site A of non-warming treatment in 2019; AW19: site A of warming treatment in 2019; BNW19: site B of non-warming treatment in 2019; BW19: site B of warming treatment in 2019; CNW19: site C of non-warming treatment in 2019; CW19: site C of warming treatment in 2019. |
Table 4 The permutational multivariate analysis of variance of experimental warming (W), measurement year (Y) and measurement site (S) on nutritional quality |
| Model | F | P |
|---|---|---|
| W | 4.59 | 0.028 |
| Y | 21.71 | 0.001 |
| S | 1.52 | 0.231 |
| W×Y | 1.75 | 0.173 |
| W×S | 0.76 | 0.542 |
| Y×S | 1.51 | 0.214 |
| W×Y×S | 1.29 | 0.287 |
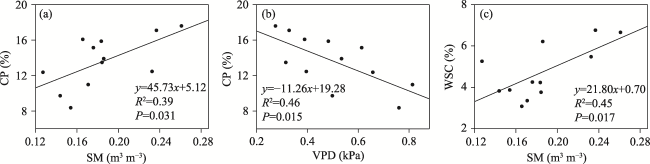
Fig. 4 Univariate regression analysis between the contents of (a) crude protein (CP) and soil moisture (SM), (b) CP and vapor pressure deficit (VPD), and (c) water-soluble carbohydrate (WSC) and SM |
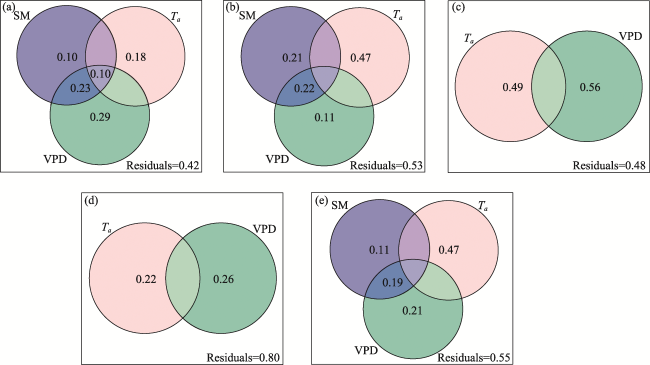
Fig. 5 Variation partitioning analysis (VPA), showing the shared and exclusive effects of soil moisture (SM), air temperature (Ta) and vapor pressure deficit (VPD) on (a) crude protein (CP), (b) acid detergent fiber (ADF), (c) neutral detergent fiber (NDF), (d) crude ash (Ash), and (e) the nutritional quality Note: The fractions of unexplained variation are not illustrated. |
| 1 |
|
| 2 |
|
| 3 |
|
| 4 |
|
| 5 |
|
| 6 |
|
| 7 |
|
| 8 |
|
| 9 |
|
| 10 |
|
| 11 |
|
| 12 |
|
| 13 |
|
| 14 |
|
| 15 |
|
| 16 |
|
| 17 |
|
| 18 |
|
| 19 |
|
| 20 |
|
| 21 |
|
| 22 |
|
| 23 |
|
| 24 |
|
| 25 |
|
| 26 |
|
| 27 |
|
| 28 |
|
| 29 |
|
| 30 |
|
| 31 |
|
| 32 |
|
| 33 |
|
| 34 |
|
| 35 |
|
| 36 |
|
| 37 |
|
| 38 |
|
| 39 |
|
| 40 |
|
| 41 |
|
| 42 |
|
| 43 |
|
| 44 |
|
| 45 |
|
| 46 |
|
| 47 |
|
| 48 |
|
| 49 |
|
| 50 |
|
| 51 |
|
| 52 |
|
| 53 |
|
| 54 |
|
| 55 |
|
| 56 |
|
| 57 |
|
| 58 |
|
| 59 |
|
/
| 〈 |
|
〉 |