
Journal of Resources and Ecology >
Spatial Distribution of Surface Soil Organic Carbon Density and Related Factors along an Urbanization Gradient in Beijing
Received date: 2019-05-23
Accepted date: 2020-03-20
Online published: 2020-09-30
Supported by
The Key Projects of National Natural Science Foundation of China(41530747)
The State Key Laboratory of Earth Surface Processes and Resources Ecology(2017-FX-01(1))
Urban surface soil has a unique set of structures and processes that affect surface soil organic carbon density (SOCdensity) and its spatial variations. Using Beijing as a case study, and assisted by field investigations and experiments, we analyzed the spatial distribution of SOCdensity in different land use types and functional regions, and assessed associated factors such as urbanization level, the physiochemical properties of soil and plant configurations. The present study aims to provide useful information about the mechanisms driving soil organic carbon and climate change in developing and developed areas in urbanized regions like Beijing. Results indicate that P is the main factor positively influencing SOCdensity in most regions. Because of the specific interference directly related to human beings in urban areas, with decreases in the urbanization level, more physiochemical factors of soil can influence SOCdensity. SOCdensity under grasses is not significantly different from that under other plant compositions. Urbanization processes decrease the heterogeneity of the spatial pattern of SOCdensity in most land use types, but increased its contents when the area reached a developed level in Beijing. More factors related to human interference and spatial variation of surface soil carbon storage, especially under impervious land in urban areas, should be considered in future studies.
TIAN Yuhong , LIU Fenghua , WANG Tiantian . Spatial Distribution of Surface Soil Organic Carbon Density and Related Factors along an Urbanization Gradient in Beijing[J]. Journal of Resources and Ecology, 2020 , 11(5) : 508 -515 . DOI: 10.5814/j.issn.1674-764x.2020.05.008
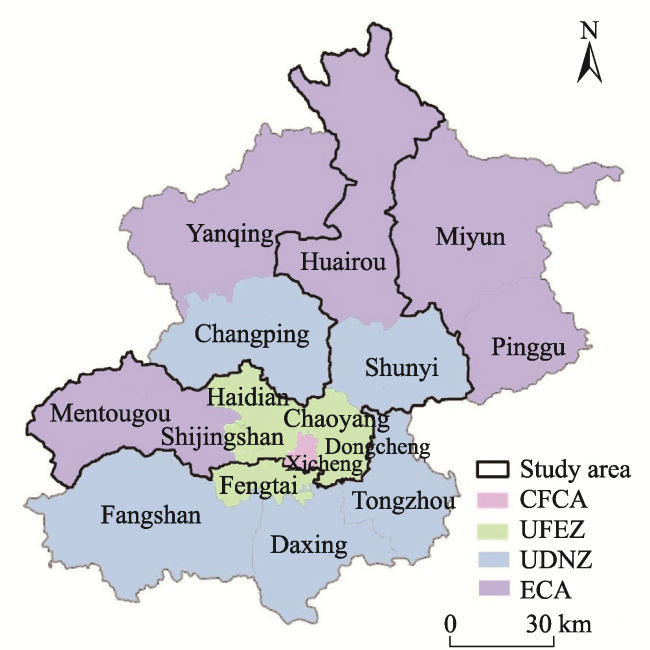
Fig. 1 Location of study area Note: CFCA, capital function core area; UFEZ, urban function expansion zone; UDNZ, urban development new zone; ECA, ecological conservation area. |
Table 1 Population, GDP and industry structure in different functional regions |
| Items | CFCA | UFEZ | UDNZ | ECA | |
|---|---|---|---|---|---|
| Population (×106) | 1982 | 241.70 | 283.99 | 143.57 | 49.36 |
| 1990 | 233.64 | 398.90 | 167.44 | 53.17 | |
| 2000 | 229.43 | 638.86 | 198.17 | 56.25 | |
| 2012 | 226.90 | 1012.72 | 362.40 | 70.82 | |
| Population density (person km-2) | 2012 | 24232.46 | 7742.29 | 1226.40 | 199.71 |
| Total area (km2) | 91.99 | 1275.61 | 6299.22 | 8743.73 | |
| GDP (×108 Yuan) | 2009 | 2791 | 5140 | 1590 | 478 |
| GDP per capita (Yuan) | 2009 | 27668 | 72205 | 5709 | 3653 |
| Economy density (×108 Yuan km-2) | 2009 | 29.99 | 3.99 | 0.25 | 0.05 |
| Industry structure (%) | Primary | 0 | 0.10 | 5.76 | 9.21 |
| Second | 7.95 | 26.55 | 52.36 | 44.91 | |
| Third | 92.05 | 73.36 | 41.88 | 45.89 | |
Note: CFCA: Capital function core area; UFEZ: Urban function expansion zone; UDNZ: Urban development new zone; ECA: Ecological conservation area; GDP: Gross domestic product. |
Table 2 Sample numbers of different green space types in different functional regions |
| Functional region | Park | Roadside | Residential | Farmland/plantation | Woodland | Others | Total |
|---|---|---|---|---|---|---|---|
| CFCA | 4 | 16 | 6 | 3 | 29 | ||
| UFEZ | 3 | 14 | 7 | 2 | 3 | 8 | 37 |
| UDNZ | 1 | 14 | 4 | 4 | 7 | 2 | 32 |
| ECA | 5 | 7 | 5 | 13 | 10 | 2 | 42 |
| Total | 13 | 51 | 22 | 19 | 20 | 15 | 140 |
Note: The means of the abbreviations see Table 1. |
Table 3 Measurement methods of indices for soil physiochemical properties |
| Observation index | Abbreviation | Measurement method | References |
|---|---|---|---|
| Soil organic carbon | TOC | Walkley-Black method | Bremmer and Mulvaney, 1982 |
| Total carbon | TC | Kjeldahl digestion method | Anderson and Ingram, 1993 |
| pH | pH | pH meter method | Thomas, 1996 |
| Total nitrogen | TN | Kjeldahl digestion method | Anderson and Ingram, 1993 |
| Total phosphorus | P | Ammonium molybdate method | Li et al., 2015 |
| Available potassium | K | NH4OAc digestion | SCS-USDA, 1972 |
| Content of gravel | Gravel | Pipette method | Baver et al., 1972 |
| Content of coarse sand | CS | Pipette method | Baver et al., 1972 |
| Content of fine sand | FS | Pipette method | Baver et al., 1972 |
| Content of silt | Silt | Pipette method | Baver et al., 1972 |
| Content of clay | Clay | Pipette method | Baver et al., 1972 |
| Water content | Oven drying method | ||
| Bulk density | Ring blade method |
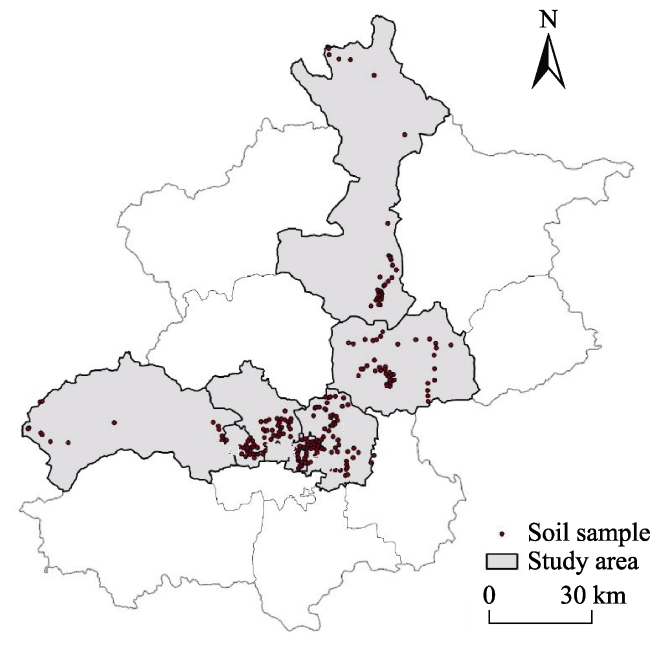
Fig. 2 Sample distribution of the field survey |
Table 4 Duncan’s multiple comparison of TOC and SOCdensity in different functional regions |
| Functional region | TOC (g kg-1) | SOCdensity (kg m-2) | Variation coefficient of SOCdensity (%) |
|---|---|---|---|
| CFCA | 5.74b | 0.82b | 68.11 |
| UFEZ | 1.87a | 0.29a | 93.64 |
| UDNZ | 7.01b | 0.92b | 35.11 |
| ECA | 5.33b | 0.88b | 69.29 |
| Total | 4.99 | 0.77 | 83.80 |
Note: a/b mean the class group induced by Duncan’s multiple comparison. |
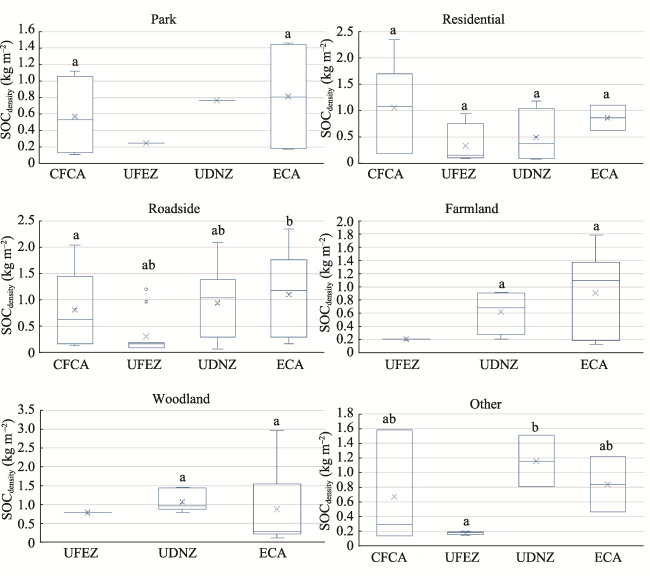
Table 5 Duncan’s multiple comparison of SOCdensity in different functional regions by land uses |
| Functional region | Park | Roadside | Residential | Farmland | Woodland | Other |
|---|---|---|---|---|---|---|
| CFCA | 0.57a | 0.82a | 1.06a | 0.67a | ||
| UFEZ | 0.24 | 0.31a | 0.35a | 0.21 | 0.79 | 0.18a |
| UDNZ | 0.76 | 0.94a | 0.50a | 0.63a | 1.07a | 1.16a |
| ECA | 0.81a | 1.11a | 0.86a | 0.91a | 0.87a | 0.84a |
| Total | 0.65a | 0.79a | 0.72a | 0.80a | 0.94a | 0.54a |
Note: Horizontal comparison of SOCdensity in different land uses. a/b mean the class group induced by Duncan’s multiple comparison. |
Fig. 3 Box plots of SOCdensity in functional regions by land use Note: a/b displays whether the values significantly differ from others, which was calculated using Duncan’s multiple comparison test in ANOVA in SPSS 19.0. |
Table 6 The Pearson correlation coefficients between SOCdensity and soil physiochemical properties |
| Region | TC (%) | TN (g kg-1) | C/N | P (mg kg-1) | K (mg kg-1) | pH | CS (%) | FS (%) | Silt (%) | Clay (%) | Water content (%) |
|---|---|---|---|---|---|---|---|---|---|---|---|
| CFCA | 0.22 | 0.15 | 0.04 | 0.55** | 0.05 | -0.65** | 0.29 | -0.36 | -0.26 | 0.05 | -0.26 |
| UFEZ | 0.19 | -0.35 | -0.41* | 0.23 | -0.10 | -0.37 | -0.49* | 0.35 | 0.42* | 0.30 | -0.03 |
| UDNZ | 0.32* | 0.44* | -0.09 | 0.75** | 0.39* | -0.21 | -0.07 | 0.11 | -0.26 | -0.15 | -0.28 |
| ECA | -0.33* | -0.07 | -0.27 | 0.42** | 0.27 | -0.37* | 0.31* | -0.53** | -0.15 | 0.19 | 0.05 |
| Total | -0.02 | 0.12 | -0.13 | 0.49** | 0.18* | -0.11 | 0.10 | -0.18* | -0.15 | 0.01 | -0.22* |
Note: BD: bulk density; TC: total carbon; TN: total nitrogen; P: available phosphorus; K: available potassium; C/N is the ratio of TC and TN; CS: coarse sand; FS: fine sand; * means correlation is significant at the 0.05 level (two-tailed); ** means correlation is significant at the 0.01 level (two-tailed). |
Table 7 The Pearson correlation coefficients between SOCdensity and urbanization indicators |
| Urbanization indicator | Population density | Economic density | Urbanization rate |
|---|---|---|---|
| SOCdensity | -0.15 | 0.11 | 0.43** |
Note: ** means correlation is significant at the 0.01 level (two-tailed). |
Table 8 Duncan’s multiple comparison of SOCdensity in different plant configurations |
| Plant configuration | Grass | Shrub+ grass | Tree | Tree+ grass | Tree+shrub+ grass |
|---|---|---|---|---|---|
| SOCdensity | 2.42ab | 1.72a | 2.50b | 2.65b | 2.84b |
Note: a/b mean the class group induced by Duncan’s multiple comparison. |
| 1 |
|
| 2 |
|
| 3 |
|
| 4 |
|
| 5 |
|
| 6 |
|
| 7 |
|
| 8 |
|
| 9 |
|
| 10 |
|
| 11 |
|
| 12 |
|
| 13 |
|
| 14 |
|
| 15 |
|
| 16 |
|
| 17 |
|
| 18 |
|
| 19 |
|
| 20 |
|
| 21 |
|
| 22 |
|
| 23 |
|
| 24 |
|
| 25 |
|
| 26 |
SCS-USDA(Soil Conservation Service-U. S. Department of Agriculture). 1972. National engineering handbook. Washington D C:USDA.
|
| 27 |
|
| 28 |
The Census Office of the State Council of China. 2010. Tabulation on the 2010 Population Census of the People’s Republic of China. Beijing, China: Chinese Statistics Press. (in Chinese)
|
| 29 |
|
| 30 |
|
| 31 |
|
| 32 |
|
| 33 |
|
/
| 〈 |
|
〉 |