
Journal of Resources and Ecology >
Genetic Diversity of Toona ciliata Populations based on SSR Markers
Received date: 2020-02-19
Accepted date: 2020-06-03
Online published: 2020-09-30
Supported by
Foundation: The Public Welfare Research Project of Department of Science and Technology in Hubei Province(402012DBA40001)
The Scientific Research Project of Department of Education in Hubei Province(B20160555)
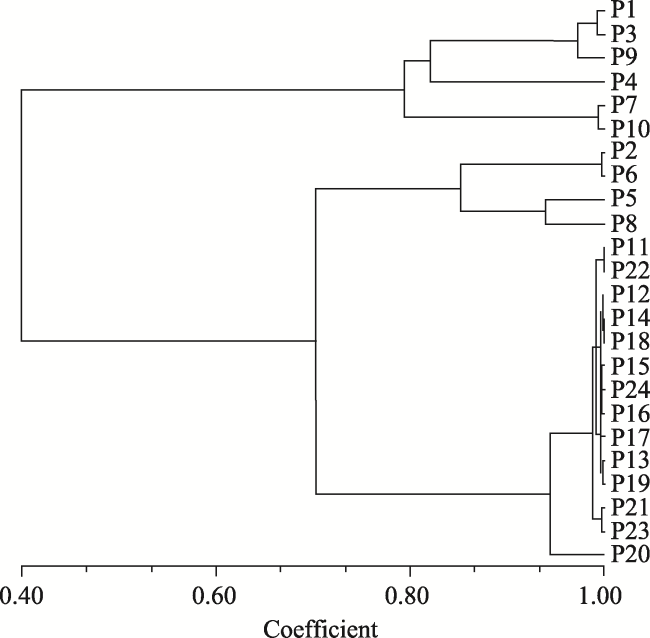
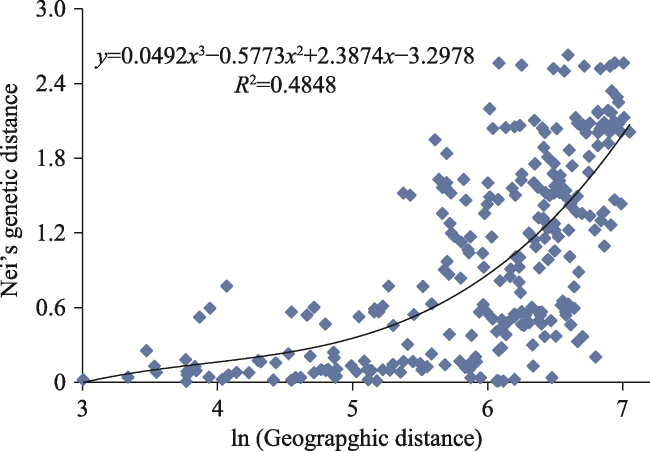
In order to provide a theoretical basis for the protection and development of T. ciliata germplasm resources, we studied the genetic diversity of T. ciliata by using SSR (Simple Sequence Repeat) primers to evaluate the genetic diversity of 192 T. ciliata germplasm samples from 24 populations of 5 provinces. DataFormater, Popgene, NTSYS, TFPGA and other software were used for genetic data conversion, genetic parameter estimation, dendrogram construction and genetic variation analysis. The results showed that: 1) a total of 17 alleles (Na) were detected in seven pairs of primers, with an average of 2.260 for each primer. Among them, the highest numbers of alleles (4) were detected in primers S11 and S422.The mean value of Nei’s genetic diversity index (H) was 0.4909, the mean value of Shannon information index (I) was 0.7321, and the mean value of polymorphic information content (PIC) was 0.5182. The mean expected heterozygosity (He) and observed heterozygosity (Ho) were 0.1055 and 0.4956, respectively. The Nei°s genetic distances of the populations ranged between 0.0002 and 2.6346, and the mean was 0.5477. The average genetic diversity level (H=0.1044) of the 24 populations was lower than that of the species (H=0.4909). 2) The genetic differentiation coefficients (Fst) varied from 0.2374 to 0.9148, with an average value of 0.7727. The mean of population gene flow (Nm) was 0.0735, indicating a low level of genetic exchange between populations, and suggesting that the genetic variation mainly came from within populations. 3) With the UPGMA method, the 24 populations were clustered into 3 groups at Nei’s genetic identity (0.99): the populations from Guizhou Province and Guangxi Zhuang Autonomous Region were clustered into one group, the populations from Hunan Province were in another group, and the populations from Hubei Province were in the third group. The Mantel test analysis showed a significant correlation between Nei’s genetic distance and geographic distance (r=0.6318, P=0.009˂0.05). The genetic diversity of the 24 populations of T. ciliata was at a low level. Geographic isolation was the main reason for genetic differentiation among T. ciliata provenances. In the protection of germplasm resources of T. ciliata, emphasis should be placed on breeding genetic resources from the populations with higher genetic diversity (P14, for example). As for the populations with low genetic diversity, an ex-situ protection strategy as well as ecological and timber objectives, should be taken into account to maximize the conservation and utilization of the diversity of T. ciliata.
WANG Yang , YUE Dan , LI Xinzhi . Genetic Diversity of Toona ciliata Populations based on SSR Markers[J]. Journal of Resources and Ecology, 2020 , 11(5) : 466 -474 . DOI: 10.5814/j.issn.1674-764x.2020.05.004
Table 1 Locations and altitudes of the 24 sampled populations of Toona ciliata |
| Population | Location | East longitude | North latitude | Altitude (m) | Population | Location | East longitude | North latitude | Altitude (m) |
|---|---|---|---|---|---|---|---|---|---|
| P1 | Xingyi of Guizhou | 105°02°08 | 24°58°03 | 779 | P13 | Laifeng of Hubei | 109°15°57 | 29°25°58 | 521 |
| P2 | Changde of Hunan | 111°31°08 | 29°18°54 | 399 | P14 | Hefeng of Hubei | 110o12°29 | 30o10°12 | 559 |
| P3 | Ceheng of Guizhou | 105°52°38 | 24°52°16 | 972 | P15 | Enshi of Hubei | 109°14°51 | 30°01°13 | 738 |
| P4 | Tianlin of Guangxi | 106°39°08 | 24°02°12 | 311 | P16 | Xuan’en of Hubei | 109°41°59 | 30o02°26 | 1013 |
| P5 | Shaoyang of Hunan | 111°22°15 | 27°22°30 | 540 | P17 | Lichuan of Hubei | 108°33°49 | 29°51°22 | 521 |
| P6 | Jinggangshan of Jiangxi | 114°09°37 | 26°39°20 | 907 | P18 | Zhushan of Hubei | 110°01°59 | 31°39°58 | 660 |
| P7 | Zhenfeng of Guizhou | 105°46°17 | 25°22°46 | 477 | P19 | Gucheng of Hubei | 111°15°49 | 32°01°36 | 402 |
| P8 | Huaihua of Hunan | 110°05°14 | 27°31°47 | 613 | P20 | Badong of Hubei | 110°23°44 | 30°36°49 | 720 |
| P9 | Anlong of Guizhou | 105°26°25 | 25°06°23 | 1377 | P21 | Chongyang of Hubei | 113°46°25 | 29°26°37 | 338 |
| P10 | Youmai of Guizhou | 105°59°41 | 25°03°19 | 695 | P22 | Tongshan of Hubei | 114°38°39 | 29°24°18 | 567 |
| P11 | Xian°an of Hubei | 114°19°18 | 29°45°42 | 356 | P23 | Huangshi of Hubei | 115°04°51 | 30°11°26 | 356 |
| P12 | Xianfeng of Hubei | 109°00°07 | 29°47°59 | 806 | P24 | Jianshi of Hubei | 110°05°59 | 30°19°26 | 541 |
Table 2 Primer sequences used in the SSR analysis of T. ciliata |
| Primer | Primer combination sequences | |
|---|---|---|
| S5 | F: GTGGCGTAACAGACCAAAAC | R: CCAGAGATACTCCATTCCAG |
| S11 | F: AGTAATAGCCTGTAGAGCAG | R: GAAGAAGGGTGAGCGAGA |
| S22 | F: GAAACCAGCAGGCAGAGC | R: ACCGCATTAGTACCAGTAG |
| T02 | F: TAGGAAAGGCAAGGTGGG | R: GGGTGGTCGATGAGGGTT |
| T05 | F: AGTAATAGCCTGTAGAGCAG | R: AGAGTGGGGTGGTCGATGAG |
| T07 | F: ATGGATGAGTGTGCGATAGG | R: TGTGATGTAGGAGTCTGAAC |
| S422 | F: ATGGATGAGTGTGCGATAGG | R: TGTGATGTAGGAGTCTGAAC |
Table 3 Summary of genetic variation statistics of the seven Loci |
| Locus | Na | Ne | PPB (%) | PIC | Ho | He | H | I |
|---|---|---|---|---|---|---|---|---|
| S5 | 2 | 2.1460 | 89.30 | 0.5340 | 0.0000 | 0.4444 | 0.4401 | 0.6603 |
| S11 | 4 | 3.9574 | 75.20 | 0.7473 | 0.0870 | 0.6749 | 0.6675 | 1.2094 |
| S22 | 2 | 1.7950 | 86.63 | 0.4429 | 0.0000 | 0.4266 | 0.4228 | 0.6205 |
| T02 | 2 | 1.4102 | 93.53 | 0.2909 | 0.5965 | 0.4695 | 0.4654 | 0.1447 |
| T07 | 3 | 2.3750 | 63.50 | 0.5789 | 0.0192 | 0.4796 | 0.4750 | 0.8395 |
| T05 | 2 | 2.0880 | 93.70 | 0.5211 | 0.0000 | 0.4708 | 0.4664 | 0.6757 |
| S422 | 4 | 2.0498 | 49.92 | 0.5122 | 0.0357 | 0.5037 | 0.4992 | 0.9745 |
| Mean | 2.7143 | 2.2602 | 78.82 | 0.5182 | 0.1055 | 0.4956 | 0.4909 | 0.7321 |
Note:Na: the number of alleles; Ne: the number of effective alleles; PPB: the percentage of polymorphic bands; PIC: the polymorphic information content; Ho: the observed heterozygosity; He: the expected heterozygosity; H: Nei’s genetic diversity index; I: Shannon diversity index. |
Table 4 Genetic diversity parameters of 24 T. ciliata populations |
| Population | Na | Ne | PIC | Ho | He | H | I |
|---|---|---|---|---|---|---|---|
| P1 | 1.1429 | 1.1429 | 14.29% | 0.1429 | 0.1429 | 0.0714 | 0.0990 |
| P2 | 1.1429 | 1.1429 | 14.29% | 0.1429 | 0.1429 | 0.0714 | 0.0990 |
| P3 | 1.1429 | 1.1429 | 14.29% | 0.1429 | 0.1429 | 0.0714 | 0.0990 |
| P4 | 1.1429 | 1.1429 | 14.29% | 0.1429 | 0.1429 | 0.0714 | 0.0990 |
| P5 | 1.1429 | 1.1429 | 14.29% | 0.1429 | 0.1429 | 0.0714 | 0.0990 |
| P6 | 2.2857 | 1.8138 | 100.00% | 0.0714 | 0.4481 | 0.4107 | 0.6533 |
| P7 | 1.1429 | 1.1429 | 14.29% | 0.1429 | 0.0952 | 0.0714 | 0.0990 |
| P8 | 1.2857 | 1.1829 | 28.57% | 0.0357 | 0.1310 | 0.1027 | 0.1528 |
| P9 | 1.1667 | 1.1000 | 14.29% | 0.0833 | 0.0714 | 0.0625 | 0.0937 |
| P10 | 1.2857 | 1.2101 | 28.57% | 0.0857 | 0.1302 | 0.1171 | 0.1705 |
| P11 | 1.1429 | 1.1429 | 14.29% | 0.1429 | 0.1429 | 0.0714 | 0.0990 |
| P12 | 1.1429 | 1.1213 | 14.29% | 0.1020 | 0.0706 | 0.0656 | 0.0931 |
| P13 | 1.4286 | 1.2527 | 42.86% | 0.2381 | 0.1810 | 0.1508 | 0.2278 |
| P14 | 1.0000 | 1.0000 | 0.00% | 0.0000 | 0.0000 | 0.0000 | 0.0000 |
| P15 | 1.2857 | 1.2857 | 28.57% | 0.2857 | 0.2857 | 0.1429 | 0.1980 |
| P16 | 2.4286 | 2.2286 | 0.00% | 0.1429 | 0.6190 | 0.5159 | 0.8015 |
| P17 | 1.0000 | 1.0000 | 0.00% | 0.0000 | 0.0000 | 0.0000 | 0.0000 |
| P18 | 1.1429 | 1.1143 | 14.29% | 0.0952 | 0.0762 | 0.0635 | 0.0909 |
| P19 | 1.1429 | 1.1429 | 14.29% | 0.1429 | 0.1429 | 0.0714 | 0.0990 |
| P20 | 1.1429 | 1.1429 | 14.29% | 0.1429 | 0.1429 | 0.0714 | 0.0990 |
| P21 | 1.0000 | 1.0000 | 0.00% | 0.0000 | 0.0000 | 0.0000 | 0.0000 |
| P22 | 1.2857 | 1.1708 | 28.57% | 0.0857 | 0.1175 | 0.1057 | 0.1588 |
| P23 | 1.1429 | 1.0857 | 14.29% | 0.0714 | 0.0714 | 0.0536 | 0.0803 |
| P24 | 1.1429 | 1.1429 | 14.29% | 0.1429 | 0.1429 | 0.0714 | 0.0990 |
| Mean | 1.2629 | 1.2081 | 19.05% | 0.1136 | 0.1493 | 0.1044 | 0.1546 |
Note:Na: the number of alleles; Ne: the number of effective alleles; PIC: the polymorphic information content; Ho: the observed heterozygosity; He: the expected heterozygosity; H: Nei’s genetic diversity index; I: Shannon diversity index. |
Table 5 Coefficients of genetic differentiation and gene flow between T. ciliata populations |
| Locus | Fis | Fst | Nm |
|---|---|---|---|
| S5 | 1.0000 | 0.9148 | 0.0233 |
| S11 | -0.1232 | 0.8288 | 0.0516 |
| S22 | 1.0000 | 0.9148 | 0.0233 |
| T02 | -0.7084 | 0.2374 | 0.8029 |
| T07 | 0.7857 | 0.8233 | 0.0537 |
| T05 | 1.0000 | 0.8921 | 0.0302 |
| S422 | 0.6548 | 0.7914 | 0.0659 |
| Mean | -0.0096 | 0.7727 | 0.0735 |
Note:Fis: population inbreeding coefficient; Fst: genetic differentiation coefficient; Nm: number of migrants per generation. |
Table 6 Geographic distance and Nei’s measures of genetic distance between the different populations |
| Population | P1 | P2 | P3 | P 4 | P5 | P 6 | P7 | P8 | P9 | P10 | P11 | P12 |
|---|---|---|---|---|---|---|---|---|---|---|---|---|
| P1 | 0.000 | 0.184 | 0.000 | 0.169 | 0.164 | 1.427 | 0.023 | 0.191 | 0.048 | 0.020 | 1.250 | 1.495 |
| P2 | 813.899 | 0.000 | 0.502 | 0.284 | 0.224 | 0.000 | 0.253 | 0.136 | 0.321 | 0.355 | 0.151 | 0.397 |
| P3 | 94.239 | 745.562 | 0.000 | 0.134 | 0.238 | 1.499 | 0.087 | 0.624 | 0.010 | 0.079 | 1.559 | 0.914 |
| P4 | 200.399 | 764.182 | 121.327 | 0.000 | 0.261 | 0.379 | 0.357 | 0.191 | 0.321 | 0.251 | 0.679 | 0.759 |
| P5 | 694.831 | 216.008 | 615.055 | 600.545 | 0.000 | 0.128 | 1.861 | 0.076 | 0.321 | 0.251 | 0.151 | 0.397 |
| P6 | 942.630 | 394.233 | 854.178 | 809.441 | 288.084 | 0.000 | 0.594 | 0.220 | 1.261 | 1.101 | 0.100 | 0.317 |
| P7 | 94.373 | 717.911 | 58.421 | 174.249 | 600.937 | 851.510 | 0.000 | 1.852 | 1.826 | 0.001 | 1.482 | 1.338 |
| P8 | 588.999 | 244.576 | 513.711 | 518.222 | 128.105 | 415.348 | 491.837 | 0.000 | 0.273 | 0.250 | 0.150 | 1.033 |
| P9 | 51.623 | 764.833 | 51.287 | 170.344 | 643.819 | 890.660 | 46.619 | 536.283 | 0.000 | 0.011 | 1.826 | 1.624 |
| P10 | 105.825 | 719.245 | 28.112 | 130.579 | 595.541 | 937.695 | 43.327 | 491.987 | 56.546 | 0.000 | 1.378 | 1.329 |
| P11 | 1102.194 | 295.379 | 1031.610 | 1033.003 | 438.119 | 409.258 | 1006.608 | 518.472 | 1051.834 | 1009.778 | 0.000 | 0.092 |
| P12 | 667.923 | 249.735 | 627.351 | 679.819 | 354.799 | 614.673 | 584.291 | 273.074 | 628.524 | 603.785 | 518.927 | 0.000 |
| P13 | 658.233 | 215.922 | 610.919 | 655.850 | 306.996 | 569.457 | 570.941 | 227.165 | 615.754 | 587.346 | 496.102 | 47.796 |
| P14 | 784.345 | 155.414 | 734.238 | 772.719 | 331.558 | 547.032 | 685.329 | 297.541 | 740.855 | 710.735 | 390.338 | 131.978 |
| P15 | 702.516 | 233.378 | 660.920 | 711.379 | 351.351 | 608.949 | 618.035 | 288.427 | 662.272 | 637.127 | 491.349 | 34.232 |
| P16 | 731.596 | 193.604 | 686.204 | 730.671 | 337.601 | 576.007 | 645.371 | 280.881 | 690.102 | 662.422 | 447.588 | 32.267 |
| P17 | 648.599 | 292.523 | 612.780 | 672.126 | 388.540 | 653.713 | 567.327 | 297.783 | 610.703 | 662.329 | 559.069 | 43.109 |
| P18 | 896.381 | 298.413 | 859.041 | 911.302 | 494.726 | 686.210 | 814.512 | 460.657 | 858.245 | 835.246 | 435.728 | 231.839 |
| P19 | 997.076 | 302.490 | 952.453 | 995.339 | 516.427 | 659.615 | 911.266 | 511.782 | 955.825 | 928.686 | 348.442 | 328.029 |
| P20 | 824.102 | 180.008 | 777.377 | 817.424 | 371.063 | 572.418 | 737.151 | 343.091 | 782.254 | 753.221 | 379.222 | 161.860 |
| P21 | 1004.299 | 222.903 | 932.128 | 926.337 | 329.956 | 305.026 | 910.554 | 418.748 | 955.163 | 910.704 | 117.445 | 467.081 |
| P22 | 1078.720 | 303.619 | 1003.264 | 992.667 | 391.714 | 308.371 | 984.091 | 492.168 | 1028.344 | 982.642 | 108.409 | 548.314 |
| P23 | 1154.471 | 357.847 | 1082.811 | 1077.884 | 477.909 | 401.988 | 1060.605 | 569.301 | 1105.364 | 1061.561 | 73.747 | 588.123 |
| P24 | 789.9930 | 174.5340 | 742.3150 | 783.321 | 351.456 | 409.226 | 702.080 | 314.612 | 747.541 | 718.582 | 399.826 | 129.477 |
| Population | P13 | P14 | P15 | P16 | P17 | P18 | P19 | P20 | P21 | P22 | P23 | P24 |
| P1 | 1.321 | 1.320 | 1.411 | 1.550 | 1.398 | 1.254 | 1.283 | 1.279 | 1.264 | 1.260 | 1.339 | 1.269 |
| P2 | 0.353 | 0.147 | 0.376 | 0.514 | 0.315 | 0.547 | 0.540 | 0.184 | 0.081 | 0.087 | 0.103 | 0.208 |
| P3 | 1.506 | 1.234 | 1.006 | 0.503 | 1.075 | 1.176 | 0.903 | 0.645 | 0.549 | 0.504 | 0.538 | 0.527 |
| P4 | 0.671 | 0.484 | 0.515 | 0.565 | 0.372 | 0.461 | 0.460 | 0.349 | 0.266 | 0.345 | 0.342 | 0.582 |
| P5 | 1.321 | 0.670 | 0.716 | 0.565 | 0.996 | 0.893 | 0.789 | 0.338 | 0.166 | 0.139 | 0.136 | 0.423 |
| P6 | 0.266 | 0.330 | 0.262 | 0.317 | 0.354 | 0.368 | 0.379 | 0.272 | 0.114 | 0.125 | 0.120 | 0.305 |
| P7 | 0.172 | 1.322 | 1.322 | 0.249 | 1.349 | 1.338 | 1.337 | 1.337 | 1.349 | 2.305 | 1.340 | 1.337 |
| P8 | 0.668 | 0.725 | 0.080 | 0.564 | 0.514 | 0.526 | 0.553 | 0.191 | 0.135 | 0.063 | 0.128 | 0.289 |
| P9 | 2.477 | 1.784 | 2.050 | 1.641 | 1.636 | 2.635 | 2.624 | 1.672 | 1.636 | 1.670 | 1.839 | 0.981 |
| P10 | 1.299 | 0.935 | 1.314 | 1.719 | 1.866 | 1.329 | 1.328 | 1.328 | 1.866 | 2.285 | 1.331 | 1.328 |
| P11 | 0.100 | 0.103 | 0.096 | 0.092 | 0.093 | 0.097 | 0.123 | 0.138 | 0.156 | 0.087 | 0.093 | 0.092 |
| P12 | 0.090 | 0.089 | 0.090 | 0.090 | 0.090 | 0.090 | 0.097 | 0.093 | 0.097 | 0.091 | 0.095 | 0.100 |
| P13 | 0.000 | 0.097 | 0.097 | 0.090 | 0.091 | 0.092 | 0.089 | 0.102 | 0.107 | 0.111 | 0.103 | 0.091 |
| P14 | 126.121 | 0.000 | 0.092 | 0.091 | 0.094 | 0.088 | 0.089 | 0.236 | 0.094 | 0.107 | 0.114 | 0.091 |
| P15 | 62.808 | 43.537 | 0.000 | 0.091 | 0.094 | 0.092 | 0.093 | 0.236 | 0.094 | 0.093 | 0.100 | 0.090 |
| P16 | 75.212 | 59.243 | 43.576 | 0.000 | 0.091 | 0.095 | 0.099 | 0.233 | 0.099 | 0.116 | 0.118 | 0.091 |
| P17 | 84.077 | 111.518 | 68.878 | 111.545 | 0.000 | 0.096 | 0.090 | 0.232 | 0.100 | 0.115 | 0.095 | 0.094 |
| P18 | 257.393 | 185.494 | 199.733 | 185.395 | 247.608 | 0.000 | 0.094 | 0.206 | 0.156 | 0.097 | 0.097 | 0.091 |
| P19 | 341.271 | 266.155 | 293.889 | 266.143 | 352.536 | 121.514 | 0.000 | 0.154 | 0.024 | 0.018 | 0.029 | 0.009 |
| P20 | 166.455 | 46.169 | 128.776 | 92.379 | 195.463 | 123.627 | 177.363 | 0.000 | 0.018 | 0.017 | 0.028 | 0.008 |
| P21 | 437.295 | 352.559 | 446.745 | 404.053 | 510.539 | 441.607 | 381.901 | 355.899 | 0.000 | 0.100 | 0.090 | 0.094 |
| P22 | 518.364 | 430.732 | 526.568 | 483.493 | 590.942 | 508.314 | 436.324 | 430.933 | 82.506 | 0.000 | 0.099 | 0.090 |
| P23 | 564.382 | 461.774 | 562.455 | 518.883 | 629.691 | 508.818 | 418.347 | 452.369 | 152.414 | 101.020 | 0.000 | 0.096 |
| P24 | 131.412 | 20.202 | 97.204 | 58.386 | 165.387 | 146.899 | 211.513 | 34.708 | 368.508 | 443.241 | 475.439 | 0.000 |
Note: Nei’s genetic distance (above diagonal) and geographic distance (below diagonal) of the 24 T. ciliata populations. |
Fig. 1 UPGMA dendrogram based on Nei’s genetic distance |
Fig. 2 Spatial genetic correlation of the 24 T. ciliata populations |
| 1 |
|
| 2 |
|
| 3 |
|
| 4 |
|
| 5 |
|
| 6 |
|
| 7 |
|
| 8 |
|
| 9 |
|
| 10 |
|
| 11 |
|
| 12 |
|
| 13 |
|
| 14 |
|
| 15 |
|
| 16 |
|
| 17 |
|
| 18 |
|
| 19 |
|
| 20 |
|
| 21 |
|
| 22 |
|
| 23 |
|
| 24 |
|
| 25 |
|
| 26 |
|
| 27 |
|
| 28 |
|
| 29 |
|
| 30 |
|
| 31 |
|
| 32 |
|
| 33 |
|
| 34 |
|
| 35 |
|
| 36 |
|
| 37 |
|
| 38 |
|
| 39 |
|
| 40 |
|
/
| 〈 |
|
〉 |