
Journal of Resources and Ecology >
Effects of Forest Types and Environmental Factors on Soil Microbial Biomass in a Coastal Sand Dune of Subtropical China
Received date: 2020-03-15
Accepted date: 2020-05-21
Online published: 2020-09-30
Supported by
The Science and Technology Major Project of Fujian Province(2018NZ0001-1)
The Basal Research Fund of Fujian Province Public Scientific Research Institution(2019R1009-6)
The Casuarina Research Center of Engineering and Technology
The Key Laboratory of Forest Culture and Forest Product Processing Utilization of Fujian Province.
Coastal sand dune ecosystems generally have infertile soil with low water-holding capacity and high salinity. However, many plant species have adapted to the harsh sand environment along the southeastern coast of China. Studying the microbial biomass in such an ecosystem can improve our understanding of the roles that microbes play in soil fertility and nutrient cycling. We investigated the differences in soil microbial biomass carbon (MBC) and nitrogen (MBN) contents and their seasonal dynamics in five forest types (a secondary forest and plantations of Casuarinas, Pine, Acacia, and Eucalyptus). The results indicated that the seasonal variations of soil MBC and MBN contents in all five forest stands were higher in spring and winter, but lower in summer and autumn. The MBC content was lower in the Casuarinas plantation than in the other plantations in the same soil layer. However, no significant differences were observed in MBN contents among the different forest types. The MBC and MBN concentrations were positively correlated with soil moisture, but negatively correlated with soil temperature. The MBC and MBN contents also decreased with increasing soil depth. Across all soil layers, secondary forest had the highest MBC and MBN concentrations. Our study also showed that the MBC and MBN contents were positively affected by total soil carbon (TC), pH, and litter N content, but were negatively impacted by soil bulk density and litter C content. Moreover, the MBN content was positively correlated with root N content. In summary, environmental factors and the differences in litter and fine roots, soil nutrient contents, as well as the soil physical and chemical properties caused by different tree species collectively affected the concentrations of the soil MBC and MBN.
GAO Wei , LIN Meimei , HUANG Yongrong , HUANG Shide , YE Gongfu , HUANG Zhiqun . Effects of Forest Types and Environmental Factors on Soil Microbial Biomass in a Coastal Sand Dune of Subtropical China[J]. Journal of Resources and Ecology, 2020 , 11(5) : 454 -465 . DOI: 10.5814/j.issn.1674-764x.2020.05.003
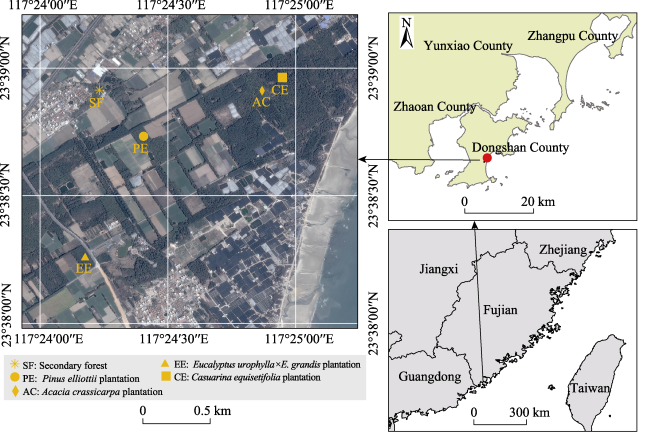
Fig. 1 The location of the study area in Fujian Province, Southern China |
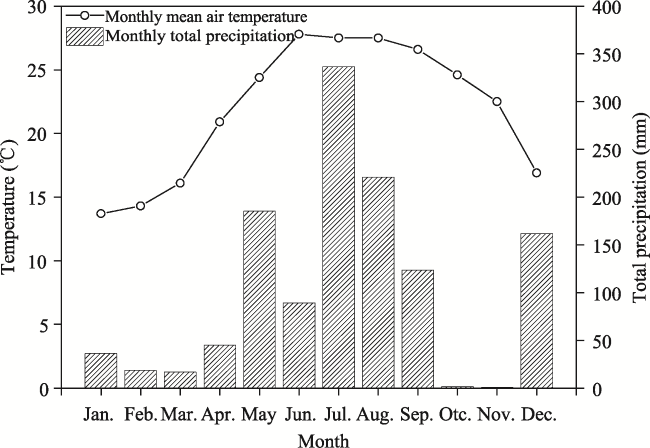
Fig. 2 Monthly cumulative precipitation and monthly mean air temperature in 2015 |
Table 1 Detailed site characteristics and topsoil properties of the five forest stands on the southeastern coast of China |
| Variable | Eucalyptus | Pine | Acacia | Casuarinas | Secondary forest |
|---|---|---|---|---|---|
| Stand age (yr) | 11 | 21 | 22 | 22 | >50 |
| Forest average DBH (cm) | 15.60 | 21.00 | 21.10 | 17.90 | 9.70 |
| Mean tree height (m) | 11.40 | 13.90 | 12.50 | 14.90 | 5.60 |
| Tree density (ind ha-1) | 1300 | 1500 | 950 | 1600 | 1400 |
| Litterfall (mg ha-1 yr-1) | 12.32ab | 12.99a | 10.06b | 10.08b | 12.67a |
| Litter C (g kg-1) | 473.40bc | 499.70ab | 513.60a | 497.70ab | 495.80c |
| Litter N (g kg-1) | 9.21c | 6.58d | 15.10b | 8.83c | 16.41a |
| Litter C:N ratio | 51.55b | 77.12a | 34.07c | 56.43b | 28.05c |
| Litter cellulose (g kg-1) | 114.80d | 217.90b | 172.10c | 275.20a | 157.40c |
| Litter lignin (g kg-1) | 179.90e | 365.90b | 449.30a | 227.50d | 300.60c |
| Litter lignin: N ratio | 19.60c | 56.50a | 29.80b | 25.80b | 18.30c |
| Root Biomass (mg ha-1) | 2.16ab | 1.05b | 1.84ab | 3.04a | 2.77a |
| Root C (g kg-1) | 376.40ab | 365.10b | 304.80c | 412.70a | 378.00ab |
| Root N (g kg-1) | 5.70c | 6.30c | 10.50b | 19.70a | 19.20a |
| Root C: N ratio | 69.90a | 63.50a | 29.00b | 20.90b | 19.80b |
| Bulk density (g cm-3) | 1.36b | 1.23cd | 1.28bc | 1.45a | 1.17d |
| pH | 5.00b | 4.65c | 4.73c | 4.71c | 6.57a |
| Total C (g kg-1) | 6.65b | 4.33b | 4.08b | 3.17b | 12.71a |
| Total N (g kg-1) | 0.54b | 0.53bc | 0.53bc | 0.27c | 1.26a |
| Soil C: N ratio | 11.97a | 8.12b | 7.70b | 11.58a | 9.91ab |
| Soil NH4+-N concentration (μg g-1) | 3.52c | 3.78c | 6.27b | 4.38c | 7.00a |
| Soil NO3--N concentration (μg g-1) | 0.20b | 1.14b | 1.47b | 0.87b | 18.20a |
| Total inorganic N (μg g-1) | 2.30b | 3.90b | 6.50b | 3.10b | 25.80a |
| Soil DOC (mg kg-1) | 56.20b | 40.40b | 42.20b | 53.30b | 84.80a |
| Soil DON (mg kg-1) | 2.80bc | 3.30bc | 6.80b | 0.60c | 22.5a0 |
| Available P (mg kg-1) | 0.57b | 0.61b | 1.26b | 0.89b | 20.49a |
| Exchangeable Mg (mg kg-1) | 0.28b | 0.33b | 0.26b | 0.32b | 0.71a |
Note: Data are the averages of the replicate plots taken from each forest stand; different letters in the same row represent significant differences at the 0.05 level, and the same below. |
Table 2 Soil pH, soil bulk density, soil C and N content, and soil C: N ratio for the different forests (N=4) |
| Soil depth (cm) | Forest types | Soil pH | Bulk density (g cm-3) | Soil C content (g kg-1) | Soil N content (g kg-1) | Soil C: N |
|---|---|---|---|---|---|---|
| 0-10 | Eucalyptus | 5.00±0.08b | 1.36±0.04b | 6.65±2.67b | 0.54±0.09b | 11.97±2.91a |
| Pine | 4.65±0.13c | 1.23±0.06cd | 4.33±1.21b | 0.53±0.04bc | 8.12±1.80b | |
| Acacia | 4.73±0.12c | 1.28±0.10bc | 4.08±0.35b | 0.53±0.05bc | 7.7±0.08b | |
| Casuarinas | 4.71±0.08c | 1.45±0.04a | 3.17±0.69b | 0.27±0.05c | 11.58±1.08a | |
| Secondary forest | 6.57±0.22a | 1.17±0.04d | 12.71±4.94a | 1.26±0.34a | 9.91±1.23ab | |
| 10-20 | Eucalyptus | 4.71±0.18b | 1.47±0.04a | 1.85±0.34b | 0.31±0.07b | 6.16±0.91a |
| Pine | 4.72±0.19b | 1.43±0.02a | 1.96±0.51b | 0.31±0.02b | 6.32±1.50a | |
| Acacia | 4.76±0.09b | 1.39±0.09a | 1.68±0.13b | 0.31±0.03b | 5.46±0.30a | |
| Casuarinas | 4.92±0.05b | 1.47±0.04a | 1.25±0.22b | 0.14±0.02c | 9.27±1.26a | |
| Secondary forest | 6.50±0.69a | 1.31±0.02b | 4.57±0.93a | 0.54±0.09a | 8.44±1.15a |
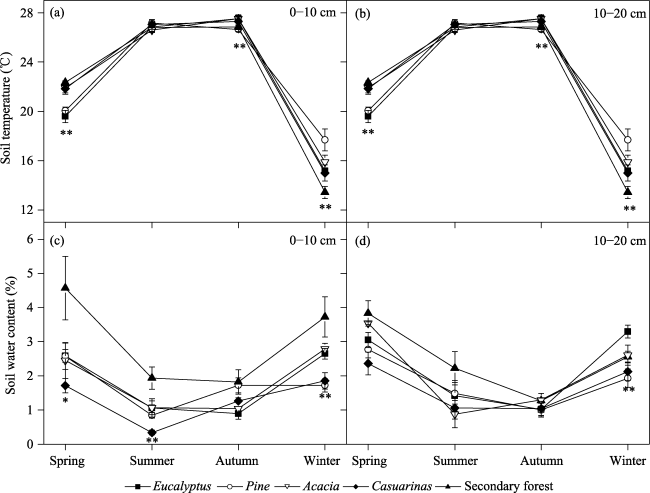
Fig. 3 Seasonal variations of soil temperature and soil water content under different forest types Note: * significant difference at P<0.05; ** significant difference at P<0.01. |
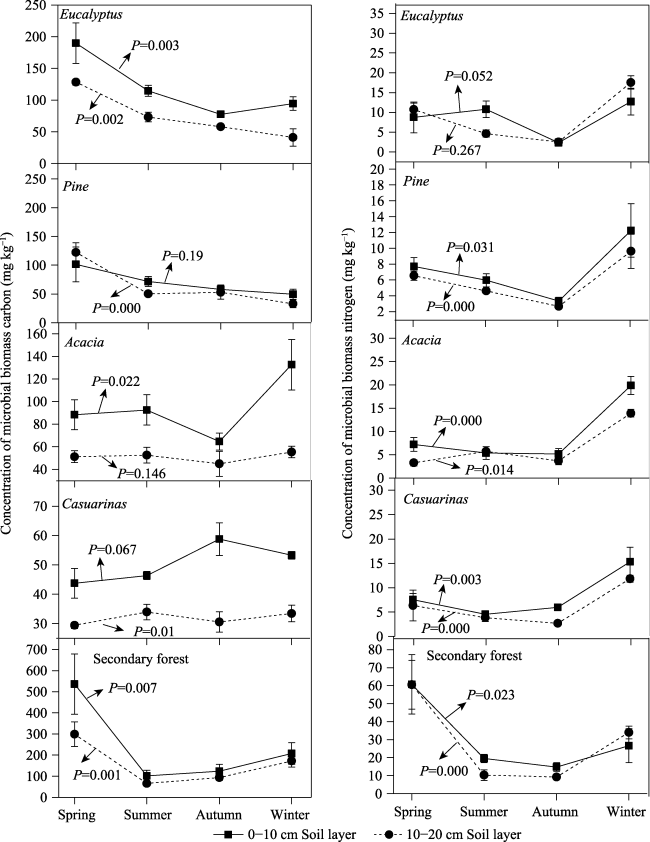
Fig. 4 Seasonal variations of MBC and MBN under different forests |
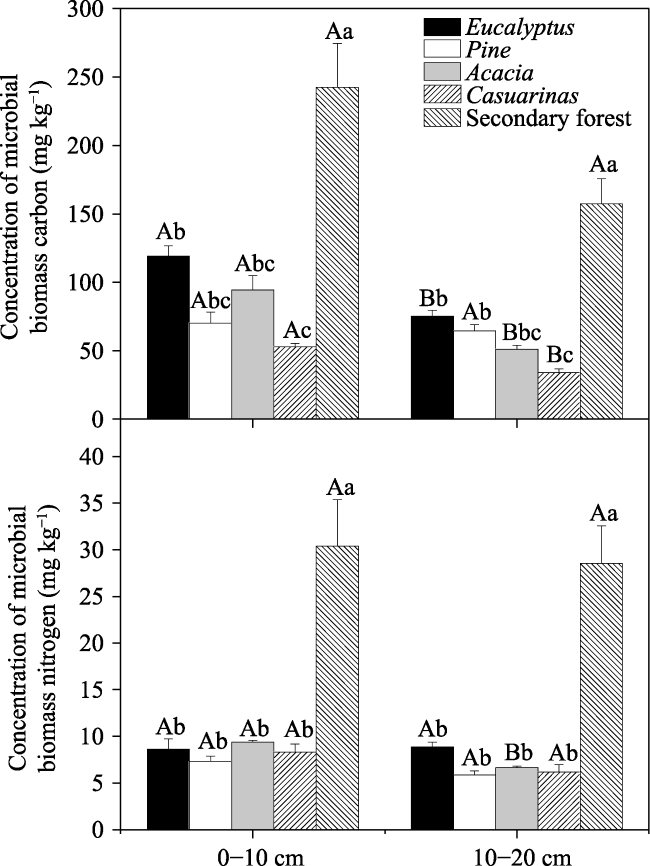
Fig. 5 Annual mean MBC and MBN contents under different forests Note: Different capital letters indicate significant differences between topsoil and subsoil under the same forest type, and different small letters indicate significant differences among different forests in the same soil layer, the same below. |
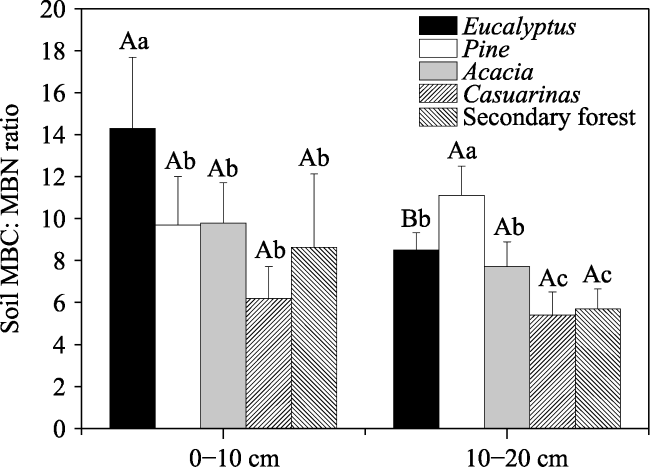
Fig. 6 Soil MBC: MBN ratio under different forests |
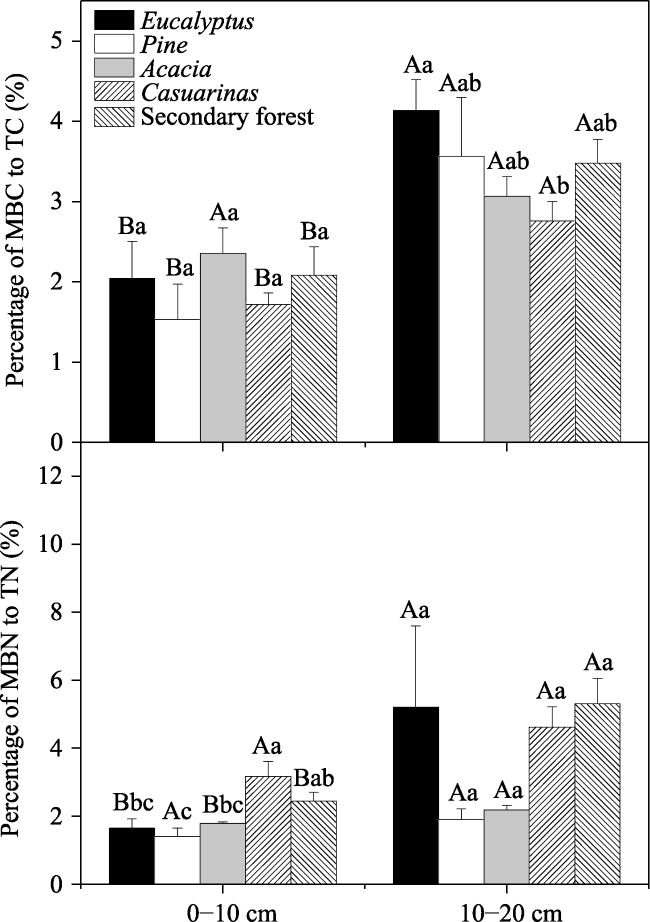
Fig. 7 Percentages of soil MBC and MBN within TC and TN, respectively, under different forests |
Table 3 Pearson correlations between seasonal variations of soil MBC and MBN and soil temperature as well as water content |
| Forest types | T—MBC | T—MBN | W—MBC | W—MBN | ||||
|---|---|---|---|---|---|---|---|---|
| 0-10 cm | 10-20 cm | 0-10 cm | 10-20 cm | 0-10 cm | 10-20 cm | 0-10 cm | 10-20 cm | |
| Eucalyptus | -0.216 | -0.007 | -0.421 | -0.937** | 0.388 | 0.170 | 0.346 | 0.760** |
| Pine | -0.027 | -0.151 | -0.629** | -0.709** | 0.257 | 0.576* | 0.066 | 0.522* |
| Acacia | -0.640** | -0.217 | -0.857** | -0.786** | 0.537* | 0.057 | 0.553* | 0.082 |
| Casuarinas | -0.269 | -0.132 | -0.785** | -0.773** | 0.100 | 0.352 | 0.619* | 0.592* |
| Secondary forest | -0.178 | -0.346 | -0.158 | -0.413 | 0.734** | 0.713** | 0.618* | 0.819** |
Note: * significant correlations at P<0.05; ** significant correlations at P<0.01; the same below. |
Table 4 Pearson correlations between soil MBC and MBN and properties of soil, litter and fine roots |
| Soil depth (cm) | Variable | MBN | TC | TN | Bulk density | pH | Litterfall | Litter C | Litter N | Root biomass | Root C | Root N |
|---|---|---|---|---|---|---|---|---|---|---|---|---|
| 0-10 | MBC | 0.750** | 0.697** | -0.030 | -0.609** | 0.899** | 0.202 | -0.500* | 0.651** | 0.301 | -0.388 | 0.326 |
| MBN | 1 | 0.820** | -0.050 | -0.586** | 0.915** | 0.408 | -0.624** | 0.671** | 0.151 | -0.188 | 0.505* | |
| 10-20 | MBC | 0.855** | 0.904** | 0.274 | -0.585** | 0.787** | 0.474* | -0.459* | 0.447* | 0.113 | -0.453* | 0.178 |
| MBN | 1 | 0.926** | -0.130 | -0.646** | 0.952** | 0.419 | -0.593** | 0.643** | 0.243 | -0.215 | 0.510* |
| 1 |
|
| 2 |
|
| 3 |
|
| 4 |
|
| 5 |
|
| 6 |
|
| 7 |
|
| 8 |
|
| 9 |
|
| 10 |
|
| 11 |
|
| 12 |
|
| 13 |
|
| 14 |
|
| 15 |
|
| 16 |
|
| 17 |
|
| 18 |
|
| 19 |
|
| 20 |
|
| 21 |
|
| 22 |
|
| 23 |
|
| 24 |
|
| 25 |
|
| 26 |
|
| 27 |
|
| 28 |
|
| 29 |
|
| 30 |
|
| 31 |
|
| 32 |
|
| 33 |
|
| 34 |
|
| 35 |
|
| 36 |
|
| 37 |
|
| 38 |
|
| 39 |
|
| 40 |
|
| 41 |
|
| 42 |
|
| 43 |
|
| 44 |
|
| 45 |
|
| 46 |
|
| 47 |
|
| 48 |
|
| 49 |
|
| 50 |
|
| 51 |
|
| 52 |
|
| 53 |
|
| 54 |
|
| 55 |
|
| 56 |
|
| 57 |
|
/
| 〈 |
|
〉 |