
Journal of Resources and Ecology >
Values of the Farmland Ecosystem Services of Qingdao City, China, and their Changes
Received date: 2020-02-23
Accepted date: 2020-04-28
Online published: 2020-09-30
Supported by
The National Key Research and Development Plan of China(2016YFC0503503)
The Natural Science Foundation of Shandong Province, China(ZR2016DM11)
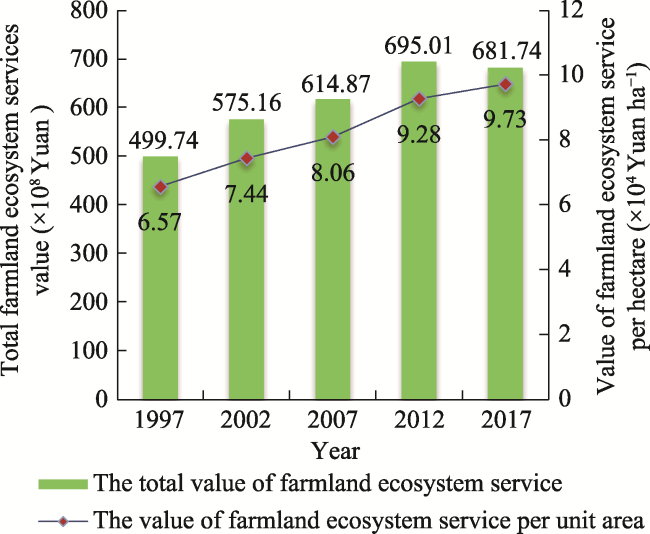
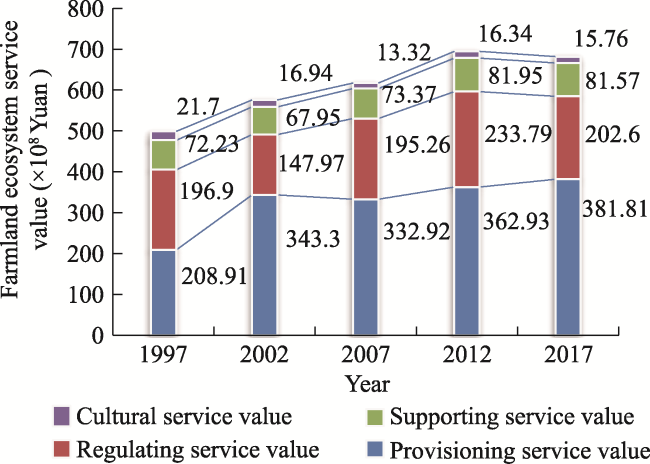
The values of farmland ecosystem services are composed of several components: provisioning service value, regulating service value, supporting service value and cultural service value, so it is important to make a full assessment of the values of farmland ecosystem services for agriculture and farmland protection. Here, we assessed the values of farmland ecosystem services in Qingdao City in 1997, 2002, 2007, 2012 and 2017 by using various methods (market value method, carbon tax method, afforestation cost method, substitute cost method, equivalent factor method, etc.) based on establishing an assessment index system for the farmland ecosystem services value. The results show that the total yearly value of farmland ecosystem services increased from 499.74×10 8 Yuan to 681.74×10 8Yuan in the period of 1997-2017, and the yearly value of farmland ecosystem services per hectare increased from 6.57×10 4 Yuan to 9.73×10 4Yuan. The product provisioning service, carbon fixation service and oxygen release service, as well as the soil conservation service, are the main farmland ecosystem services, and the proportions of these four ecosystem service values to the total value of farmland ecosystem services in Qingdao City were large and kept increasing. Some countermeasures are put forward to adequately use the indirect service value of the farmland ecosystem and provide improved well-being for humans, such as protecting and wisely using farmland, developing agriculture that is rooted in local conditions, promoting agricultural production efficiency, speeding up construction of modern agriculture gardens, deepening the supply-side structural reform of agriculture, developing agricultural eco-tourism, etc.
Key words: Qingdao City; farmland; ecosystem services value; assessment
CAI Shizhen , ZHANG Xuliang , CAO Yinghui , ZHANG Zhaohui , WANG Wei . Values of the Farmland Ecosystem Services of Qingdao City, China, and their Changes[J]. Journal of Resources and Ecology, 2020 , 11(5) : 443 -453 . DOI: 10.5814/j.issn.1674-764x.2020.05.002
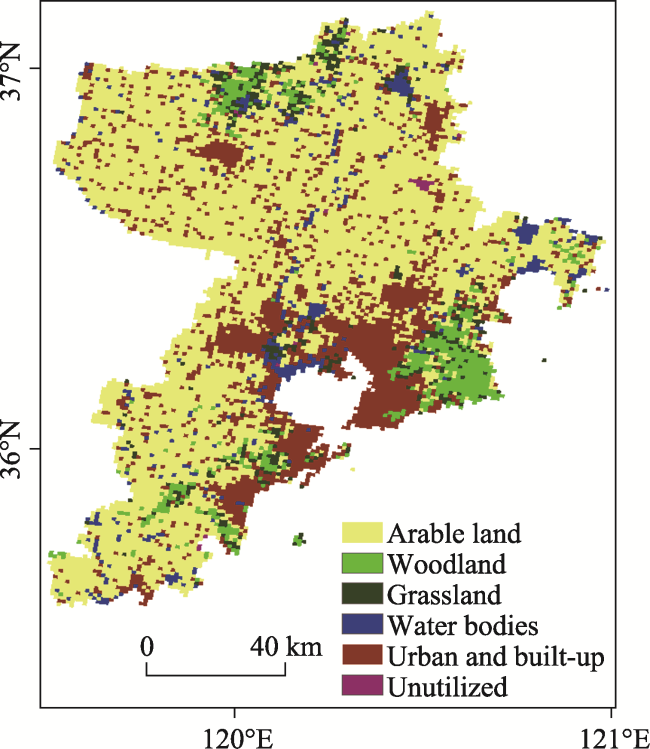
Fig. 1 The types and distribution of land use in Qingdao City in 2018 |
Table 1 Evaluation index system of the farmland ecosystem service values in Qingdao City |
| Service type | Evaluation index | Meaning of index | Evaluation method | Calculating formula | Meaning of parameters | |
|---|---|---|---|---|---|---|
| Provisioning service | Product provisioning service | Agricultural product production and provisioning | Market value method | ${{V}_{A}}\text{=}\sum\limits_{i=1}^{n}{{{m}_{i}}}\times {{p}_{i}}\times {{q}_{i}}$ | VA is the value of agricultural product provisioning service (Yuan), pi is the agricultural product price of type i per kilogram (Yuan kg-1), qi is the net production of agricultural product of type i per hectare (t ha-1), mi is the planting area of type i agricultural product (ha) | |
| Regulating service | Carbon fixation service Oxygen release service | Fixation of CO2 by the process of photosynthesis | Carbon tax method, afforestation cost method | $NPP=\sum\limits_{i=1}^{n}{\frac{{{Y}_{i}}(1-{{w}_{i}})}{{{f}_{i}}}}$ VC=1.68×NPP×RC×PC | NPP is the net primary production of crops (t yr-1), Yi is the economic yield of type i crop (t), wi is the moisture content of type i crop, fi is the economic coefficient of type i crop, VC is the carbon fixation value of the farmland ecosystem (Yuan), Pc is the cost of carbon fixation, Rc is the content in CO2, 27.27% (Liu et al., 2015) | |
| Release of O2 By the process of photosynthesis | Industrial oxygen production method, afforestation cost method | VO=1.20×NPP×PO | VO is the total oxygen release service value of the farmland ecosystem (Yuan), PO is the cost of oxygen production | |||
| Water conservation service | Intercepting precipitation by the crop | Substitute cost method | V1=S×P×K×PW | V1 is the service value of crop interception of precipitation (Yuan), S is the area of farmland (ha), P is the average annual precipitation in Qingdao City (mm), K is the ratio of crop precipitation interception (%), the ratio of precipitation interception for general crops is 5% (Wu et al., 2017), PW is the cost of reservoir construction (Yuan m-3) | ||
| Maintaining water by the soil | Substitute cost method | V2=S×C×H×PW | V2 is the value of the maintaining water service of soil (Yuan), C is the non-capillary porosity of soil (%), H is the thickness of soil (cm) | |||
| Climate regulating service | Enhancing humidification and rain | Equivalent factor method | $\begin{align} & {{V}_{M}}=0.89{{C}_{\text{0}}}=\frac{1}{7}\times \\ & \text{ }\left( \sum\limits_{i=1}^{n}{{{m}_{i}}}\times {{p}_{i}}\times {{q}_{i}} \right)\times \frac{1}{T} \\ \end{align}$ | VM is the climate regulating service value of farmland (Yuan), C0 is the food producing and provisioning service value of the farmland ecosystem per hectare (Yuan ha-1), mi is the area of type i food crop (ha), pi is the price of type i food crop (Yuan kg-1), qi is the per unit yield of type i food crop (t ha-1), T is the total planting area of food crops (ha) | ||
| Supporting service | Soil conservation service | Maintaining soil nutrients | Shadow price method | ${{V}_{S1}}={{Q}_{S}}\times \mathop{\sum }^{}{{S}_{j}}\times {{C}_{j}}\times {{P}_{j}}$ ${{Q}_{S}}=S\times ({{E}_{p}}-{{E}_{r}})$ | VS1 is the soil nutrient maintainence service value (Yuan), QS is soil conservation (t ha-1), Sj is the content of type j nutrient in soil (%), Cj is the chemical fertilizer conversion coefficient of class j nutrient, Pj is the market price of class j nutrient (Yuan), Ep is the potential erosion modulus of cultivated land (t km-2 yr-1), ER is the actual erosion modulus (t km-2 yr-1) | |
| Reducing land abandonment | Opportunity cost method | VS2=P×Q×S/(10000 ×h×d) | VS2 is the value of reducing land abandon (Yuan), P is the annual income of farmland (Yuan ha-1), Q is the amount of soil conservation (t ha-1), S is the area of farmland cultivation (ha), h is the thickness of the plough layer of farmland (cm), d is soil bulk density (g cm-3) | |||
| Cultural service | Social security service | Guaranteeing hidden unemployed farmers | Substitute cost method | VP=N×M×R | VP is the social security service value of farmland (Yuan), N is the population which needs to accept the lowest living security in rural areas (capita), M is the lowest living security standard of urban residents per capita (Yuan), R is the ratio of annual consumption expenditure of rural residents per capita to annual consumption expenditure of urban residents per capita | |
| Entertainment and cultural service | Relaxation and entertainment | Equivalent factor method | $\begin{align} & {{V}_{T}}=0.01{{C}_{0}}=\frac{1}{7}\times \\ & \text{ }\left( \sum\limits_{i=1}^{n}{{{m}_{i}}}\times {{p}_{i}}\times {{q}_{i}} \right)\times \frac{1}{T} \\ \end{align}$ | VT is the entertainment and cultural service value of farmland (Yuan), C0 is the food production service value of farmland per hectare (Yuan ha-1), mi is the area of type i food crop planted (ha), pi is the price of type i food crop (Yuan kg-1), qi is the per unit yield of type i food crop (t ha-1), T is the total planting area of food crops (ha) | ||
Table 2 Provisioning service values of various crops of the farmland ecosystem in Qingdao City during 1997-2017 (×108 Yuan) |
| Crop species | 1997 | 2002 | 2007 | 2012 | 2017 |
|---|---|---|---|---|---|
| Wheat | 33.27 | 20.74 | 29.03 | 37.08 | 31.60 |
| Corn | 8.47 | 11.39 | 16.92 | 23.54 | 22.72 |
| Soybean | 1.58 | 1.66 | 1.46 | 1.02 | 0.36 |
| Potato | 2.68 | 2.75 | 1.31 | 0.86 | 0.58 |
| Peanut | 21.73 | 35.86 | 34.62 | 36.99 | 32.23 |
| Cotton | 0.26 | 0.44 | 0.55 | 0.63 | 0.06 |
| Tobacco | 1.89 | 1.58 | 0.53 | 0.43 | 0.22 |
| Vegetable | 102.00 | 211.83 | 185.96 | 198.84 | 228.51 |
| Fruit | 37.03 | 57.05 | 62.55 | 63.53 | 65.52 |
| Total | 208.91 | 343.30 | 332.92 | 362.93 | 381.81 |
Table 3 Net primary productivities of various crops produced by the farmland ecosystem of Qingdao City in the 5 years |
| Crop | Moisture content (%) | Economic coefficient | Net primary productivity (×104 t yr-1) | ||||
|---|---|---|---|---|---|---|---|
| 1997 | 2002 | 2007 | 2012 | 2017 | |||
| Wheat | 12.50 | 0.37 | 374.71 | 256.81 | 330.05 | 365.33 | 298.94 |
| Corn | 13.50 | 0.49 | 131.20 | 193.25 | 264.33 | 319.65 | 294.87 |
| Soybean | 12.50 | 0.18 | 24.02 | 27.67 | 22.47 | 13.64 | 4.64 |
| Potato | 80.00 | 0.50 | 4.92 | 5.54 | 2.42 | 1.38 | 0.90 |
| Peanut | 10.00 | 0.43 | 64.51 | 116.73 | 103.81 | 96.17 | 80.30 |
| Cotton | 8.30 | 0.35 | 0.52 | 0.98 | 1.13 | 1.13 | 0.11 |
| Tobacco | 8.20 | 0.55 | 1.34 | 1.23 | 0.38 | 0.27 | 0.13 |
| Vegetable | 82.50 | 0.90 | 64.81 | 148.16 | 119.73 | 110.79 | 122.07 |
| Fruit | 77.50 | 0.70 | 25.71 | 43.45 | 43.90 | 38.60 | 38.15 |
| Sum | — | — | 691.74 | 793.83 | 888.22 | 946.96 | 840.10 |
Table 4 Values of the carbon fixation service and oxygen release service of different crops of the farmland ecosystem in Qingdao City during 1997-2017 (×108 Yuan) |
| Crop | Carbon fixation service value | Oxygen release service value | ||||||||
|---|---|---|---|---|---|---|---|---|---|---|
| 1997 | 2002 | 2007 | 2012 | 2017 | 1997 | 2002 | 2007 | 2012 | 2017 | |
| Wheat | 15.44 | 10.28 | 14.04 | 15.71 | 13.12 | 36.03 | 22.74 | 38.04 | 50.61 | 39.82 |
| Corn | 5.41 | 7.77 | 11.24 | 13.74 | 12.95 | 12.62 | 17.11 | 30.47 | 44.28 | 39.28 |
| Soybean | 0.99 | 1.11 | 0.96 | 0.59 | 0.20 | 2.31 | 2.45 | 2.59 | 1.89 | 0.62 |
| Potato | 0.20 | 0.22 | 0.10 | 0.06 | 0.04 | 0.47 | 0.49 | 0.28 | 0.19 | 0.12 |
| Peanut | 2.66 | 4.67 | 4.42 | 4.13 | 3.53 | 6.20 | 10.34 | 11.97 | 13.32 | 10.70 |
| Cotton | 0.02 | 0.04 | 0.05 | 0.05 | 0.01 | 0.05 | 0.09 | 0.13 | 0.16 | 0.01 |
| Tobacco | 0.06 | 0.05 | 0.02 | 0.01 | 0.01 | 0.13 | 0.11 | 0.04 | 0.04 | 0.02 |
| Vegetable | 2.67 | 5.93 | 5.09 | 4.76 | 5.36 | 6.23 | 13.12 | 13.80 | 15.35 | 16.26 |
| Fruit | 1.06 | 1.74 | 1.87 | 1.66 | 1.68 | 2.47 | 3.85 | 5.06 | 5.35 | 5.08 |
| Total | 28.50 | 31.77 | 37.79 | 40.71 | 36.88 | 66.52 | 70.29 | 102.38 | 131.18 | 111.91 |
Table 5 Water conservation service value of the farmland ecosystem in Qingdao City during 1997-2017 |
| Item | 1997 | 2002 | 2007 | 2012 | 2017 |
|---|---|---|---|---|---|
| Annual precipitation (mm) | 575.27 | 481.03 | 1012.46 | 649.12 | 674.92 |
| Farmland area (×104 ha) | 76.03 | 77.40 | 76.31 | 74.86 | 70.04 |
| Value of intercepting precipitation by crops (×108 Yuan) | 3.08 | 2.77 | 7.03 | 5.59 | 4.16 |
| Value of maintaining water by soil (×108 Yuan) | 2.93 | 3.15 | 3.79 | 4.70 | 3.37 |
| Value of the water conservation service of farmland (×108 Yuan) | 6.01 | 5.92 | 10.82 | 10.29 | 7.53 |
Note: Annual precipitation is cited from Qingdao City Statistical Yearbooks of 1998, 2003, 2008, 2013 and 2018. |
Table 6 Climate regulatory service value of the farmland ecosystem in Qingdao City during 1997-2017 (×104 Yuan) |
| Item | 1997 | 2002 | 2007 | 2012 | 2017 |
|---|---|---|---|---|---|
| Equivalent product provisioning service value | 0.43 | 0.58 | 0.65 | 0.77 | 0.74 |
| Equivalent climate regulating service value | 0.39 | 0.52 | 0.58 | 0.69 | 0.66 |
| Climate regulating service value | 29.35 | 39.99 | 44.27 | 51.61 | 46.28 |
Table 7 Soil conservation service value of the farmland ecosystem in Qingdao City during 1997-2017 (×108 Yuan) |
| Item | 1997 | 2002 | 2007 | 2012 | 2017 |
|---|---|---|---|---|---|
| Value of maintaining soil nutrients | 70.65 | 65.54 | 70.15 | 78.45 | 77.53 |
| Value of reducing land abandonment | 1.57 | 2.41 | 3.22 | 3.50 | 4.04 |
| Value of soil conservation service | 72.23 | 67.95 | 73.37 | 81.95 | 81.57 |
Table 8 Social security service value of the farmland ecosystem in Qingdao City during 1997-2017 |
| Item | 1997 | 2002 | 2007 | 2012 | 2017 |
|---|---|---|---|---|---|
| Rural population in Qingdao City (×104 people) | 155.20 | 121.38 | 102.30 | 104.95 | 101.86 |
| Population needing to receive minimum social security (×104 people) | 72.63 | 56.81 | 47.88 | 49.12 | 47.67 |
| Annual consumption expenditure of rural residents per capita (Yuan) | 2150 | 2820 | 4736 | 8653 | 12928 |
| Annual consumption expenditure of urban residents per capita (Yuan) | 5525 | 7344 | 13376 | 20391 | 30569 |
| Annual consumption expenditure of rural residents per capita to that of urban residents | 0.39 | 0.38 | 0.35 | 0.42 | 0.42 |
| Social security service value (×108 Yuan) | 21.37 | 16.49 | 12.82 | 15.76 | 15.24 |
Table 9 Value and change of the entertainment and cultural service of the farmland ecosystem in Qingdao City during 1997-2017 |
| Item | 1997 | 2002 | 2007 | 2012 | 2017 |
|---|---|---|---|---|---|
| Value equivalent of the food production service (×104 Yuan ha-1) | 0.43 | 0.58 | 0.65 | 0.77 | 0.74 |
| Value equivalent of the entertainment and cultural service (Yuan ha-1) | 43.38 | 58.06 | 65.18 | 77.45 | 74.24 |
| Value of the entertainment and cultural service (×104 Yuan) | 3298.16 | 4493.70 | 4973.97 | 5798.53 | 5199.81 |
Table 1 0 Composition of the values of farmland ecosystem services in Qingdao City during 1997-2017 (×108 Yuan) |
| Item | 1997 | 2002 | 2007 | 2012 | 2017 | |||||
|---|---|---|---|---|---|---|---|---|---|---|
| Value | Ratio (%) | Value | Ratio (%) | Value | Ratio (%) | Value | Ratio (%) | Value | Ratio (%) | |
| Product provisioning service | 208.91 | 41.85 | 343.30 | 59.58 | 332.92 | 54.14 | 362.93 | 52.22 | 381.81 | 56.01 |
| Carbon fixation and oxygen release service | 161.54 | 32.32 | 102.06 | 17.71 | 140.17 | 22.80 | 171.89 | 24.73 | 148.79 | 21.83 |
| Water conservation service | 6.01 | 1.20 | 5.92 | 1.03 | 10.82 | 1.76 | 10.29 | 1.48 | 7.53 | 1.10 |
| Climate regulating service | 29.35 | 5.87 | 39.99 | 6.94 | 44.27 | 7.20 | 51.61 | 7.43 | 46.28 | 6.79 |
| Soil conservation service | 72.23 | 14.45 | 67.95 | 11.79 | 73.37 | 11.93 | 81.95 | 11.79 | 81.57 | 11.96 |
| Social security service | 21.37 | 4.28 | 16.49 | 2.86 | 12.82 | 2.08 | 15.76 | 2.27 | 15.24 | 2.24 |
| Entertainment and cultural service | 0.33 | 0.07 | 0.45 | 0.08 | 0.50 | 0.08 | 0.58 | 0.08 | 0.52 | 0.08 |
| Total | 499.74 | 100 | 576.16 | 100 | 614.87 | 100 | 695.01 | 100 | 681.74 | 100 |
Fig. 2 The total value and the value per unit area of farmland ecosystem services in Qingdao City and their changes during 1997-2017 |
Fig. 3 The composition of the values of farmland ecosystem services in Qingdao City and their changes |
| 1 |
|
| 2 |
|
| 3 |
|
| 4 |
|
| 5 |
|
| 6 |
|
| 7 |
|
| 8 |
History and Annuals Office of Qingdao. 1997. History and annuals of Qingdao—Physical geography/meteorology annuals. Beijing: Xinhua Press. (in Chinese)
|
| 9 |
|
| 10 |
|
| 11 |
|
| 12 |
|
| 13 |
|
| 14 |
|
| 15 |
|
| 16 |
|
| 17 |
|
| 18 |
|
| 19 |
|
| 20 |
|
| 21 |
|
| 22 |
|
| 23 |
|
| 24 |
|
| 25 |
|
| 26 |
|
| 27 |
|
| 28 |
|
| 29 |
|
| 30 |
|
| 31 |
|
| 32 |
|
| 33 |
|
| 34 |
|
| 35 |
|
| 36 |
|
| 37 |
|
| 38 |
|
/
| 〈 |
|
〉 |