Agriculture Ecosystem

Comparison and Analysis of Estimation Methods for Heavy Metal Pollution of Farmland Soils

  • Mamattursun EZIZ , 1, 2, * ,
  • Adila HAYRAT 1 ,
  • YANG Xiuyun 1
Expand
  • 1. College of Geographical Science and Tourism, Xinjiang Normal University, Urumqi 830054, China
  • 2. Laboratory of Arid Zone Lake Environment and Resources, Xinjiang Normal University, Urumqi 830054, China
*, Mamattursun EZIZ, E-mail:

Received date: 2019-12-05

  Accepted date: 2020-05-14

  Online published: 2020-09-30

Supported by

The National Natural Science Foundation of China(41561073)

The National Natural Science Foundation of China(41867076)

The National Natural Science Foundation of China(41361002)

Abstract

Heavy metal pollution of farmland soils is a serious environmental problem. The accurate estimation of heavy metal pollution levels of farmland soils is very crucial for sustainable agriculture. Concentrations of heavy metal elements (As, Cd, Cr, Cu, Mn, Ni, Pb, and Zn) in farmland soils at 186 sampling sites in the Baghrash Lake Basin, NW China, were determined and analyzed based on the pollution index (Pi), the geo-accumulation index (Igeo), the enrichment factor (EF), the ecological risk index (ER), and the environmental risk index (Ier). The results of these five different estimation methods were compared and discussed. The obtained results indicated that the average concentrations of all the heavy metals in the farmland soils of the study area were lower than the Soil Environmental Quality of China (GB 15168-2018) levels, but the average concentrations of Cd, Cr, Ni, Pb, and Zn exceed the corresponding background values. Significant differences in estimation results existed between the five estimation methods. Based on the identified concentrations, the average Pi, Igeo, and EF values of the heavy metals in farmland soils decreased in the order of: Zn > Pb > Cd > Cr > Ni > Cu > As, whereas the average ER values decreased in the order of: Cd > As > Cu > Pb > Ni > Cr > Zn, and the average Ier values decreased in the order of: Cd > Cu > Zn > As = Pb > Cr > Ni. The pollution class values with different estimation methods were ranked as: Pi > Igeo = EF > ER = Ier. The obtained results suggest that the most appropriate estimation method and soil background values of farmlands should be used for better understanding the environmental quality of farmland soils. Overall, the EF and ER methods are recommended for assessing heavy metal pollution risks of farmland soils.

Cite this article

Mamattursun EZIZ , Adila HAYRAT , YANG Xiuyun . Comparison and Analysis of Estimation Methods for Heavy Metal Pollution of Farmland Soils[J]. Journal of Resources and Ecology, 2020 , 11(5) : 435 -442 . DOI: 10.5814/j.issn.1674-764x.2020.05.001

1 Introduction

Pollution of agricultural soils with heavy metals is a serious environmental problem when it poses a severe threat to human health and the environment (Pan et al., 2016; Wang et al., 2017). Heavy metal element accumulation in agricultural soils can affect the safety of agricultural products and cause potential risks for human beings, animals, plants, and the entire ecosystem (Leake et al., 2009; Guo et al., 2016; Han et al., 2018). According to the “National Survey of Soil Pollution” published by the State Environmental Protection Administration and the Ministry of Land and Resources
(MEP, 2014), China faces a significant challenge of environmental deterioration due to heavy metal pollution. About 20×106 ha of farmlands in China are polluted by heavy metals (Chen et al., 2015). Pollution of farmlands with heavy metals has threatened the soil environment, food safety, and the sustainable development of agriculture (Lei et al., 2009; Duan et al., 2016; Chen et al., 2018). In light of these issues, research concerning the pollution risk assessment of heavy metals in agricultural soils has emerged as an important frontier in environmental research (Cai et al., 2012; Teresiah et al., 2016; Mamattursun et al., 2018).
Many pollution estimation methods have been applied for quantifying the levels of metal pollution in soils (Xie et al., 2010; Hu et al., 2013). The most commonly used pollution assessment methods include the geo-accumulation index (Igeo) proposed by Müller (1969) , the pollution index (Pi) proposed by Tomlinson et al. (1980) , the enrichment factor (EF) proposed by Sinex and Helz (1981) , the ecological risk index (Ei) proposed by Håkanson (1980) , and the environmental risk index (Ier) proposed by Rapant and Kordik (2003) . Many studies concerning quantitative comparisons of heavy metal pollution of soils have been reported. For example, Wu et al. (2012) reported the pollution level of river sediments by using the geo-accumulation index and ecological risk index, and found that the comprehensive use of different estimation methods can increase the accuracy of assessment results. Shi and Wang (2013) compared and discussed the pollution level of urban street dust by using the pollution index, geo-accumulation index, enrichment factor, and ecological risk index. Their results indicated the importance of unifying the terminologies for pollution classes among the different pollution estimation methods. Zhou et al. (2015) estimated and compared the pollution levels of five metal elements in soil by using the pollution index, geo-accumulation index, enrichment factor, and secondary native ratio method, and found the last method was not suitable for the estimation of heavy metal pollution of soils. Wang et al. (2015) investigated ecological risks of heavy metals in soils surrounding tungsten mines by using pollution index, geo-accumulation index, and ecological risk index, and discussed the advantages and limitations of the related methods. Their results suggested that proper precautions should be taken before choosing an appropriate soil pollution estimation method. Su et al. (2016) used the geo-accumulation index as the pollution index, applied simple mathematical statistics, normal fuzzy numbers, and kernel density estimation to evaluate heavy metal pollution of soil, and made inter-comparisons between the pollution estimation results of these methods. Their results indicated that more complex assessment models will improve the accuracy or comprehensiveness of the pollution assessment results. Xie et al. (2016) discussed the pollution level of soils by using the pollution index, geo-accumulation index, enrichment factor, and ecological risk index, and found that the pollution index method was the optimal method for heavy metal pollution estimation of soils. All of these studies indicate that the accuracy of estimation results of heavy metal pollution levels of soils is very crucial.
Despite its importance for the sustainable development of agriculture, relatively few studies concern the quantitative comparisons of heavy metal pollution of farmland soils. Therefore, in the context of rapid development and strict control policies, it is necessary to compare and discuss the different pollution estimation methods for heavy metal contamination of farmland soils. In this study, farmland soil samples were collected from 186 locations in Baghrash Lake Basin, Xinjiang, NW China, and the concentrations of eight elements in the collected samples were determined. The main goals of this study were: 1) to analyze pollution levels of heavy metals in farmland soils in the study area by using the pollution index, geo-accumulation index, enrichment factor, ecological risk index, and environmental risk index; and 2) to compare and discuss these five different estimation methods for heavy metal pollution of farmland soils. Results from this analysis will provide a scientific basis for the proper estimation of heavy metal pollution of agricultural soils.

2 Materials and methods

2.1 Study area

The research was conducted in a typical inner river basin, Baghrash Lake Basin, which is one of the active areas of agriculture in Xinjiang, NW China (Fig. 1). The basin is situated in the northern part of the Taklimakan desert, at 86°54°-87°29°E and 41°52°-42°22°N, and with an altitude ranging from 1050 m to 1800 m. The climate of the basin belongs to the continental dry type, with an average annual temperature of 8.63 ℃, an average annual precipitation of about 70 mm, and an average annual evaporation capacity of about 2360 mm. The Baghrash Lake Basin is traditionally agricultural area, pepper is the main crop, and the pepper processing industry has become one of the key industries for local farmers to increase their incomes. The main soil types in the study area are desert soils. This area is rich in mineral resources, and dominant minerals include magnesite, iron, coal, marble, limestone sandstone, salt, and mirabilite (Ajigul et al., 2017).

2.2 Sample collection, analysis, and quality control

A total of 195 soil samples (0-20 cm depth) were gathered for the agricultural soils of the Baghrash Lake Basin in May 2016. The sampling points are illustrated in Fig. 1. The sample collection methods adopted in this study were those described in “NY/T 395-2000” (MAPRC, 2000). At each sampling location, five replicate soil samples were gathered, manually mixed on-site, and transferred to the laboratory as one composite agricultural soil sample. In the laboratory, the sampled soil was air dried then ground and sieved through a 0.15 mm nylon mesh. Next, the soil samples were digested as per the procedure detailed in “HJ/T 166-2004” (CEPA, 2004). These digestion solutions were then filtered and diluted to 50 mL by adding deionized water. Finally, the concentration of As was determined using an Atomic Fluorescence Spectrometer (Persee, PF-7, China), while the remaining elements were assessed using a Flame Atomic Absorption Spectrophotometer—Flameless (Agilent 200AA, USA). The detection limits for As, Cd, Cr, Cu, Mn, Ni, Pb, and Zn elements were 0.01 mg kg-1, 0.01 mg kg-1, 0.50 mg kg-1, 0.01 mg kg-1, 0.5 mg kg-1, 0.40 mg kg-1, 0.006 mg kg-1, and 0.5 mg kg-1, respectively.
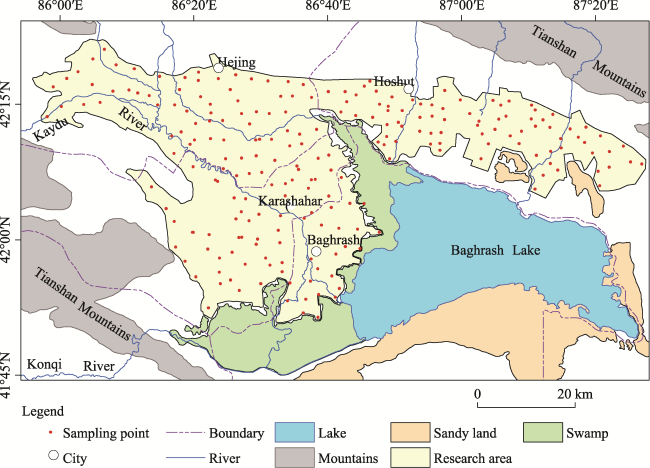
Fig. 1 Map of the location of the Baghrash Lake Basin and the sampling points
The analytical data quality was analyzed using standard laboratory quality control methods, including the use of reagent blanks, duplicates and standard reference materials for each batch of agricultural soil samples. The recoveries from samples that were spiked with standards ranged from 93% to 104%. About 50% of the soil samples were tested repeatedly, and the consistency of the repeated element measurements was about 96%.
Table 1 The calculating formulas for the Pi, Igeo, EF, ER, and Ier Index
Index Calculating formula Characteristics of parameters
Pi Pi = Ci /Bi Where Ci represents the concentration of element i in the soil sample, and Bi represents the background value of element i
Igeo Igeo = log2(Ci /1.5Bi) Where Ci and Bi are the same as above, and 1.5 represents a background matrix correction factor that includes possible variations of the background values due to lithogenic effects
EF EF = (Ci /Cr) /(Bi /Br) Where Ci and Bi are the same as above, Cr is the concentration of the reference metal, and Br is the background value of the reference elements
ER ER = (Ci /Si) × Ti Where Ci is the same as above, Si is the limit-risk concentration of element i, and Ti is the toxic response factor of element i in the soil sample
Ier Ier = (Ci /Si) - 1 Where Ci and Si are the same as above

2.3 Pollution assessment methods

In this study, the pollution levels of eight heavy metals in farmland soil samples are assessed by five methods, the pollution index (Pi), the geo-accumulation index (Igeo), the enrichment factor (EF), the ecological risk index (ER), and the environmental risk index (Ier), and the results of these five estimation methods are compared and discussed. The formulas for calculating the Pi, Igeo, EF, ER, and Ier methods are given in Table 1. The pollution risk degrees of the Pi, Igeo, EF, ER, and Ier methods are classified as given in Table 2.
Table 2 Classification of pollution degrees using Pi, Igeo, EF, ER, and Ier
Class Pi Pollution degree Igeo Pollution degree EF Pollution degree ER Risk degree Ier Risk degree
≤0.7 Unpolluted ≤0 Unpolluted ≤2 Unpolluted ≤40 Low risk ≤0 Low risk
0.7-1 Low 0-1 Unpolluted to
moderately
2-5 Low 40-80 Moderate risk 0-1 Moderate risk
1-2 Moderately 1-2 Moderately 5-20 Moderately 80-160 Considerable risk 1-3 Considerable risk
2-3 High 2-3 Moderately to strongly 20-40 High 160-320 High risk 3-5 High risk
> 3 Extremely 3-4 Strongly > 40 Extremely > 320 Extremely high risk > 5 Extremely high risk
- - 4-5 Strongly to extremely - - - - - -
- - > 5 Extremely - - - - - -

3 Results and analysis

3.1 Concentrations of heavy metals

The minimum, maximum, median, average, and background concentrations of the investigated heavy metals are given in Table 3, along with standard deviation and coefficient of variation values. Note that the background values refer to the element concentrations in agricultural soils in Xinjiang (Zheng, 2007). The “Soil environmental quality—Risk control standard for soil contamination of agricultural land (GB 15618-2018)” values are also given in Table 3. As shown in Table 3, on average, the concentrations of As, Cd, Cr, Cu, Mn, Ni, Pb, and Zn in the collected agricultural soil samples are 6.50 mg kg-1, 0.20 mg kg-1, 55.73 mg kg-1, 30.52 mg kg-1, 503.28 mg kg-1, 34.21 mg kg-1, 41.16 mg kg-1, and 89.31 mg kg-1, respectively. Except for As, Cu, and Mn, all elements present average concentrations that are higher than the corresponding background values. For Cd, Cr, Ni, Pb, and Zn elements, the average concentrations exceed the background values by factors of 1.67, 1.41, 1.30, 3.05, and 5.32 times, respectively. The concentrations of Pb and Zn were significantly higher than their corresponding background values, indicating that Pb and Zn are particularly more abundant in agricultural soils of Baghrash Lake Basin. The average concentrations of all heavy metals in the sampled farmland soils were lower than the levels of Soil Environmental Quality of China (GB 15618-2018). However, the maximum concentrations of As and Zn elements surpassed the recommended values (The Soil Environmental Quality of China (GB 15618-2018)) by factors of 1.15, and 1.45, respectively.
Table 3 Descriptive statistics of heavy metal concentrations in agricultural soil samples (n=186)
Items As Cd Cr Cu Mn Ni Pb Zn
Minimum (mg kg-1) 0.52 0.05 33.68 19.45 312.82 19.45 0.99 38.99
Maximum (mg kg-1) 28.87 0.38 123.39 73.12 789.68 55.97 96.36 434.88
Median (mg kg-1) 4.78 0.21 53.80 30.08 501.72 33.96 37.45 73.72
Average (mg kg-1) 6.50 0.20 55.73 30.52 503.28 34.21 41.16 89.31
Standard deviation (mg kg-1) 4.22 0.06 11.63 6.22 61.76 6.77 24.16 57.80
CV 0.65 0.30 0.21 0.20 0.12 0.20 0.59 0.65
Background value (mg kg-1) 11.20 0.12 39.60 35.80 688.00 26.40 13.50 16.80
National Standard (GB 15618-2018) (mg kg-1) 25.00 0.60 250.00 100.00 - 190.00 170.00 300.00
The coefficient of variation (CV) shows the degree of variability within the concentrations of each heavy metal element in the soil. A CV < 0.25 indicates low variability, while 0.26 < CV < 0.50 indicates moderate variability, and 0.51 < CV is regarded as high variability (Zhang et al., 2015). Heavy metal pollution showing low CV is associated with natural sources, and high CV is typically sourced from human activities. Based on this criterion and the calculated CVs of the analyzed species, the CVs of Cr, Cu, Mn, and Ni in the farmland soils in the study area were all lower than 0.25, indicating low variability for these elements. Cd showed a moderate variability, whereas As, Pb, and Zn each showed a high variability concerning their spatial distributions. This indicates that the concentrations of As, Pb, and Zn vary significantly from one sampling site to the other. Furthermore, the four heavy metal elements belonging to the moderate and high variability groups are those more likely to be affected by extrinsic factors, such as agricultural activities and industry.

3.2 Pollution assessment of heavy metals

The basic statistics of Pi, Igeo, EF, E, and Ier values for the investigated heavy metals in farmland soils in the study area are given in Table 4.
Table 4 Statistics of Pi, Igeo, EF, ER, and Ier values of heavy metals in farmland soils in the study area
Assessment method Statistics As Cd Cr Cu Ni Pb Zn
Pi Minimum 0.05 0.42 0.85 0.54 0.74 0.07 2.32
Maximum 2.58 3.17 3.12 2.04 2.12 7.14 25.89
Average 0.54 1.67 1.41 0.85 1.30 3.05 5.32
Igeo Minimum -5.00 -1.85 -0.82 -1.47 -1.03 -4.35 0.63
Maximum 0.78 1.08 1.05 0.45 0.50 2.25 4.11
Average -1.76 0.07 -0.12 -0.84 -0.24 0.64 1.67
EF Minimum 0.07 0.64 0.96 0.73 1.00 0.10 3.81
Maximum 4.16 4.19 3.80 3.10 3.25 11.53 30.75
Average 0.74 2.30 1.93 1.17 1.78 4.21 7.27
ER Minimum 0.21 2.50 0.27 0.97 0.51 0.03 0.13
Maximum 11.55 19.0 0.99 3.66 1.47 2.83 1.45
Average 2.42 10.04 0.45 1.53 0.90 1.21 0.30
Ier Minimum -0.98 -0.92 -0.87 -0.81 -0.90 -0.99 -0.87
Maximum 0.15 -0.37 -0.51 -0.27 -0.71 -0.43 0.45
Average -0.76 -0.67 -0.78 -0.69 -0.82 -0.76 -0.70
3.2.1 Pollution index (Pi) of heavy metals
The pollution index (Pi) is used to understand the pollution level of a single heavy metal element in the soil. The background values of heavy metals in the agricultural soils of Xinjiang (Mamattursun et al., 2018) were used in this study. Table 4 summarizes the basic statistics for the Pi of heavy metals in farmland soils in the study area. The Pi ranged from 0.05 to 2.58 for As, 0.42 to 3.17 for Cd, 0.85 to 3.12 for Cr, 0.54 to 2.04 for Cu, 0.74 to 2.12 for Ni, 0.07 to 7.14 for Pb, and 2.32 to 25.89 for Zn. The average values of Pi for As, Cd, Cr, Cu, Ni, Pb, and Zn were 0.54, 1.67, 1.41, 0.85, 1.30, 3.05, and 5.32, respectively. The average values of Pi decreased in the order of: Zn > Pb > Cd > Cr > Ni > Cu > As. Based on the concentrations found and the classification standard, the collected farmland soil samples in the study area were found to be extremely polluted by Pb and Zn, moderately polluted by Cd, Cr, and Ni, have low pollution by Cu, and be unpolluted by As.
3.2.2 Geo-accumulation index (Igeo) of heavy metals
The geo-accumulation index (Igeo) permits soil heavy metal pollution classification into an appropriate group based on the number of times by which the geochemical background is exceeded. The geo-accumulation index (Igeo) values of heavy metals in the farmland soil samples were calculated based on the geochemical background values of agricultural soils in Xinjiang. As shown in Table 4, the Igeo values ranged from -5.00 to 0.78 for As, -1.85 to 1.08 for Cd, -0.82 to 1.05 for Cr, -1.47 to 0.45 for Cu, -1.03 to 0.50 for Ni, -4.35 to 2.25 for Pb, and 0.63 to 4.11 for Zn. The average Igeo values of As, Cd, Cr, Cu, Ni, Pb, and Zn were -1.76, 0.07, -0.12, -0.84, -0.24, 0.64, and 1.67, respectively. The average values of Igeo decreased in the order of: Zn > Pb > Cd > Cr > Ni > Cu > As. Clearly, the ranking results of heavy metal pollution calculated by the Igeo method are the same as those calculated by the Pi method. Based on the classification standard, the collected farmland soil samples in the study area were found to be moderately polluted by Zn, unpolluted to moderately polluted by Cd and Pb, and unpolluted by As, Cr, Cu, and Ni.
3.2.3 Enrichment factor (EF) of heavy metals
The enrichment factor (EF) is used to identify enrichment levels and sources of heavy metals in soil (Sutherland, 2000). The reference element is often a conservative one, such as Mn, Fe, Al, etc. (Reimann and Caritat, 2000). Therefore, Mn was chosen as the reference element in the environment studied here, and the EF values of As, Cd, Cr, Cu, Ni, Pb and Zn elements were calculated. As shown in Table 4, the EF values ranged from 0.07 to 4.16 for As, 0.64 to 4.19 for Cd, 0.96 to 3.80 for Cr, 0.73 to 3.10 for Cu, 1.0 to 3.25 for Ni, 0.10 to 11.53 for Pb, and 3.81 to 30.75 for Zn. The average values of EF for As, Cd, Cr, Cu, Ni, Pb, and Zn were 0.74, 2.30, 1.93, 1.17, 1.78, 4.21, and 7.27, respectively. The average values of EF decreased in the order of: Zn > Pb > Cd > Cr > Ni > Cu > As, so the ranking results of heavy metal pollution calculated by the EF method are the same as those calculated by the Pi and Igeo methods. Based on the classification standard of EF, the collected farmland soil samples in the study area were found to be moderately polluted by Zn, have low pollution by Cd and Pb, and be unpolluted by As, Cr, Cu, and Ni. Based on the analysis above, the higher Pi, Igeo, and EF values of Cd, Pb, and Zn indicate considerable Cd, Pb, and Zn pollution of the farmland soils in the study area. This suggests that more attention should be paid to heavy metal contamination of Cd, Pb, and Zn in these soils.
3.2.4 Ecological risk index (ER) of heavy metals
The ecological risk index of heavy metals can express the sensitivity of soil ecosystems to toxic substances and can identify the pollution risks caused by heavy metals (Hu et al., 2019). The risk levels of heavy metals in farmland soils in the study area were evaluated using the ecological risk index (ER) introduced by Håkanson (1980), and the toxic response factors for As, Cd, Cr, Cu, Mn, Ni, Pb, and Zn were 10, 30, 2, 5, 1, 5, 5 and 1, respectively. In this study, the Soil Environmental Quality of China (GB 15618-2018) was selected for the limit-risk concentration values of the investigated heavy metals. As shown in Table 4, the ER values ranged from 0.21 to 11.55 for As, 2.50 to 19.0 for Cd, 0.27 to 0.99 for Cr, 0.97 to 3.66 for Cu, 0.51 to 1.47 for Ni, 0.03 to 2.83 for Pb, and 0.13 to 1.45 for Zn. The average ER values for As, Cd, Cr, Cu, Ni, Pb, and Zn were 2.42, 10.04, 0.45, 1.53, 0.90, 1.21, and 0.30, respectively. The average ER values of heavy metals decreased in the order of: Cd > As > Cu > Pb > Ni > Cr > Zn, so the ranking results of pollution risks of the elements calculated by the ER method are different from those calculated by the Pi, Igeo, and EF methods. Based on the classification standard of ER, the average ER values of all heavy metal elements in farmland soils in the study area fell into the low ecological risk level. This indicates that the farmland soil heavy metals analyzed have very low potential ecological risks to soil ecosystems in the study area.
3.2.5 Environmental risk index (Ier) of heavy metals
The environmental risk index predicts the probability of negative impacts occurring in the environment via specific pollutants. The Ier can be represented by a ratio of analytical to limit-risk concentrations of heavy metals in soil (Rapant and Kordik, 2003). In this study, the Soil Environmental Quality of China (GB 15618-2018) was selected for the limit-risk concentration values of the analyzed heavy metals. As shown in Table 4, the Ier values of heavy metals ranged from -0.98 to 0.15 for As, -0.92 to -0.37 for Cd, -0.87 to -0.51 for Cr, -0.81 to -0.27 for Cu, -0.90 to -0.71 for Ni, -0.99 to -0.43 for Pb, and -0.87 to 0.45 for Zn. The average Ier values for As, Cd, Cr, Cu, Ni, Pb, and Zn were -0.76, -0.67, -0.78, -0.69, -0.82, -0.76, and -0.70, respectively. The average Ier values of heavy metals decreased in the order of: Cd > Cu > Zn > As = Pb > Cr > Ni. The ranking results of environmental risks of elements calculated by the Ier method are different from those calculated by the ER method. However, based on the classification standard of Ier, the average Ier values of all analyzed heavy metals fell into the low ecological risk level. This indicates that the farmland soil heavy metals analyzed have very low potential environmental risks to the soil environment in the study area.

4 Discussion

Based on the above analysis, all the pollution classes are calculated and ranked in Table 5. The pollution class values of the farmland soil heavy metals analyzed in the study area can be ranked as: Pi > Igeo = EF > ER = Ier. As shown in Table 5, significant differences in estimation results exist between the five methods. The pollution estimation results of the Pi, Igeo and EF methods are relatively comparable for each of the estimation data values. The Pi, Igeo and EF methods all consider the local background values of elements, which makes these three methods have strong comparability in the estimation results. Pollution classes of Cd, Cr, Cu, and Ni range from class Ⅰ to class Ⅲ, while the pollution classes of Pb and Zn range from class Ⅰto classⅤ. The pollution classes obtained using the Igeo method are the same as the results obtained with the EF method, while the pollution classes obtained using the Pi method are relatively higher than those of the other estimation methods. The Pi method is simple and flexible, and the estimation results of the Pi method can directly reflect the pollution status of soil. However, because it simply regards the pollution levels and element concentrations as a linear relationship, the estimation results are higher than those of other methods. The Igeo method improves on the basis of the Pi method, and a logarithmic operation is carried out, resulting in lower estimation results than the Pi method. Compared with the Pi and Igeo methods, the EF method not only considers the background values of analyzed elements, but also considers the concentration of the reference element. The higher accuracy of the analysis results relative to the reference element can reduce the influences of some inevitable or accidental errors. Therefore, the Igeo and EF methods are suggested for assessing heavy metal pollution of farmland soils, rather than the Pi method. However, based on the estimation results of the five methods, heavy metals in agricultural soils in the study area, especially Zn, Pb, and Cd, should receive greater attention due to their higher pollution levels and pollution risks.
Table 5 Pollution grades of each element with different assessment methods
Assessing method As Cd Cr Cu Ni Pb Zn
Pi
Igeo
EF
ER
Ier
The pollution classes obtained using the ER method are the same as those obtained with the Ier method. Pollution risk levels of all the analyzed heavy metals fell into the low risk level according to the classification standards of risk degrees of ER and Ier. Both the ER and Ier methods consider the limit-risk value of each element, and the limit-risk values of the analyzed elements are much higher that the local background values of the elements in farmland soils in the study area. Therefore, the pollution estimation results for heavy metals by ER and Ier are relatively lower than the pollution estimation results of Pi, Igeo and EF.
The decreasing order of heavy metal pollution levels with different methods is distinctive, as shown in Table 6. With the Pi, Igeo, and EF methods, the decreasing order of heavy metal pollution levels was totally consistent, with the pollution degree of Zn being the highest, whereas the pollution degree of As was the lowest. The decreasing order of heavy metal pollution levels with the ER and Ier methods are obviously distinctive compared with those of the Pi, Igeo, and EF methods. The pollution risk degree of Cd is relatively higher, whereas the pollution risk degrees of Zn and Pb are relatively lower according to the ER and Ier methods. These differences resulted from the ecological risk factors, which were calculated with the toxic-response factors. The Ti value of Cd is 30, whereas the Ti values of Zn and Pb are only 1 and 5, respectively.
Table 6 Decreasing order of heavy metal pollution
Assessing method Order
Pi Zn > Pb > Cd > Cr > Ni > Cu > As
Igeo Zn > Pb > Cd > Cr > Ni > Cu > As
EF Zn > Pb > Cd > Cr > Ni > Cu > As
ER Cd > As > Cu > Pb > Ni > Cr > Zn
Ier Cd > Cu > Zn > As = Pb > Cr > Ni
However, the five pollution calculating formulas show that each kind of pollution estimation method takes into account differences in background values. The Pi and Igeo methods considered the background value of heavy metals in local agricultural soil, but appropriately determining the background value of heavy metals in a small-scale area is an important scientific problem. The EF method highlights the concentration of the reference element in the environment, but choosing the appropriate reference element is very important. Meanwhile, the ER and Ier methods considered both the toxicity factors and limit-risk values of the heavy metals. Therefore, determination of the toxicity coefficients and limit-risk values of heavy metals in different regions are still problematic. Besides, due to the uncertainty in the terminologies and pollution classes suggested by the five estimation methods, it is difficult to strictly unify the estimation results.
Based on these results, for general pollution level assessment, the Pi method is a simple and quick way to assess the pollution levels of heavy metals in farmland soils. But, the estimation results of the Pi method are quite different from those of the other pollution estimation methods. In the estimation of farmland soil pollution levels, results gained using the Igeo and EF are relatively close. For pollution risk assessment, the results obtained by the ER and Ier methods are basically the same, indicating that any of these risk assessment methods can evaluate the pollution risk accurately. But the ER method is recommended here because it considers the toxic response factor of heavy metals, which can improve the evaluation accuracy. According to above analysis, the EF method is recommended for pollution level estimation, while the ER method is recommended for risk level estimation of heavy metals in farmland soils.

5 Conclusions

(1) The average concentrations of eight heavy metal elements (As, Cd, Cr, Cu, Mn, Ni, Pb, and Zn) in farmland soils in the Baghrash Lake Basin, NW China, were 6.50 mg kg-1, 0.20 mg kg-1, 55.73 mg kg-1, 30.52 mg kg-1, 503.28 mg kg-1, 34.21 mg kg-1, 41.16 mg kg-1, and 89.31 mg kg-1, respec tively. The average concentrations of all these heavy metals in farmland soils are lower than the Soil Environmental Quality of China (GB 15618-2018) levels. However, the average concentrations of Cd, Cr, Ni, Pb, and Zn exceed the background values by factors of 1.67, 1.41, 1.30, 3.05, and 5.32, respectively. The higher Pi, Igeo, and EF values of Cd, Pb, and Zn indicate considerable pollution by them in farmland soils in the study area. Therefore, Zn, Pb, and Cd in farmland soils in the study area should receive greater attention.
(2) Significant differences in estimation results existed between the five methods. The pollution class values with different assessment methods were ranked as: Pi > Igeo = EF > ER = Ier. Based on the identified concentrations, the pollution classes of heavy metals obtained with the Igeo method are the same as those obtained with the EF method, and the pollution classes obtained using the ER method are the same as those obtained with the Ier method. Furthermore, the pollution classes obtained using the Pi method is relatively higher than those from the other assessment methods.
(3) The EF and ER methods are suggested for assessing heavy metal pollution risks of farmland soils. An appropriate pollution estimation method and soil background values should be used for achieving better understanding of the soil environment quality of farmland soils, and it is important to unify the terminologies for the pollution class of different estimation methods in the future.
1
Ajigul M, Mamattursun E, Anwar M , et al. 2017. The spatial distribution, contamination and ecological risk assessment of heavy metals of farmland soils in Karashahar-Baghrash oasis, Northwest China. Human and Ecological Risk Assessment, 23(6):1300-1314.

2
Cai L M, Xu Z C, Ren M Z , et al. 2012. Source identification of eight hazardous heavy metals in agricultural soils of Huizhou, Guangdong Province, China. Ecotoxicology and Environmental Safety, 78(1):2-8.

DOI

3
CEPA (Chinese Environmental Protection Administration). 2004. HJ/T 166-2004, Technical specification for soil environmental monitoring. Beijing: China Environmental Press. (in Chinese)

4
Chen H Y, Teng Y G, Lu S J , et al. 2015. Contamination features and health risk of soil heavy metals in China. Science of the Total Environment, 512:143-153.

5
Chen N C, Zhang X X, Zheng Y J . 2018. Heavy metal concentrations in rice from Guangzhou and associated health risks. Journal of Resources and Ecology, 9(1):85-91.

6
Duan Q N, Lee J C, Liu Y S , et al. 2016. Distribution of heavy metal pollution in surface soil samples in China: A graphical review. Bulletin of Environmental Contamination and Toxicology, 97(3):303-309.

DOI PMID

7
Guo J, Yue T L, Li X T , et al. 2016. Heavy metal levels in kiwifruit orchard soils and trees and its potential health risk assessment in Shaanxi, China. Environmental Science and Pollution Research, 23(14):14560-14566.

8
Håkanson L . 1980. An ecological risk index for aquatic pollution control: A sedimentological approach. Water Research, 14(8):975-1001.

9
Han Y X, Ni Z L, Li S L , et al. 2018. Distribution, relationship, and risk assessment of toxic heavy metals in walnuts and growth soil. Environmental Science and Pollution Research, 25(18):17434-17443.

DOI PMID

10
Hu J, Lin B, Yuan M , et al. 2019. Trace metal pollution and ecological risk assessment in agricultural soil in Dexing Pb/Zn mining area, China. Environmental Geochemistry and Health, 41(2):967-980.

PMID

11
Hu Y A, Liu X P, Bai J M . 2013. Assessing heavy metal pollution in the surface soils of a region that had undergone three decades of intense industrialization and urbanization. Environmental Science and Pollution Research, 20(9):6150-6159.

DOI PMID

12
Leake J R, Adam B A, Rigby J E . 2009. Health benefits of “grow your own” food in urban areas: Implications for contaminated land risk assessment and risk management. Environmental Health, 8(S6):1-6.

13
Lei L, Ma Y B, Zhang S Z , et al. 2009. An inventory of trace element inputs to agricultural soils in China. Journal of Environmental Management, 90(8):2524-2530.

DOI PMID

14
Mamattursun E, Anwar M, Ajigul M , et al. 2018. A human health risk assessment of heavy metals in agricultural soils of Yanqi Basin, Silk Road Economic Belt, China. Human and Ecological Risk Assessment, 24(5):1352-1366.

15
MAPRC(Ministry of Agriculture of the People’s Republic of China). 2000. NY/T 395-2000, Procedural Regulations Regarding the Environment Quality Monitoring of Soil. Beijing: Standards Press of China. (in Chinese)

16
MEP(Ministry of Environmental Protection). 2014. National Soil Pollution Survey of China. Beijing: Standards Press of China. (in Chinese)

17
Müller G . 1969. Index of geo-accumulation in sediments of the Rhine River. Geojournal, 2(3):108-118.

18
Pan L B, Ma J, Hu Y , et al. 2016. Assessments of levels, potential ecological risk, and human health risk of heavy metals in the soils from a typical county in Shanxi Province, China. Environmental Science and Pollution Research, 23(19):19330-19340.

PMID

19
Rapant S, Kordik J . 2003. An environmental risk assessment map of the Slovak Republic: Application of data from geochemical atlases. Environmental Geology, 44(4):400-407.

20
Reimann C, Caritat P . 2000. Intrinsic flaws of element enrichment factors (EFs) in environmental geochemistry. Environmental Science and Technology, 34(24):5084-5091.

21
Shi X M, Wang J H . 2013. Comparison of different methods for assessing heavy metal contamination in street dust of Xianyang City, NW China. Environmental Earth Sciences, 68(8):2409-2415.

22
Sinex S A, Helz G R . 1981. Regional geochemistry of trace elements in Checapeake Bay sediments. Environmental Geology, 3(6):315-323.

23
Su Q L, Zhou S L, Yi H M , et al. 2016. A comparative study of different assessment methods of regional heavy metal pollution. Acta Scientiae Circumstantiae, 36(4):1309-1316. (in Chinese)

24
Sutherland R A . 2000. Bed sediment-associated trace metals in an urban stream, Oahu, Hawaii. Environmental Geology, 39(6):611-627.

25
Tomlinson D L, Wilson J G, Harris C R , et al. 1980. Problems in the assessment of heavy metal levels in estuaries and the formation of a pollution index. Helgoland Marine Surveys, 33(1-4):566-575. (in German)

26
Teresiah M M, Anita A O, Victorine A M , et al. 2016. Occurrences and toxicological risk assessment of eight heavy metals in agricultural soils from Kenya, Eastern Africa. Environmental Science and Pollution Research, 23(18):18533-18541.

DOI PMID

27
Wang F, Huang Y Z, Wang X L , et al. 2015. Ecological risk assessment of heavy metals in surrounding soils of tungsten ores: Comparison of different evaluation methods. Environmental Chemistry, 34(2):225-233. (in Chinese)

28
Wang L J, Tao W D, Richard C S , et al. 2017. Speciation, sources, and risk assessment of heavy metals in suburban vegetable garden soil in Xianyang City, Northwest China. Frontiers of Earth Science, 12(2):397-407.

29
Wu W X, Li K M, Wang G , et al. 2012. Evaluation of heavy metal pollution in river sediment: A comparative case study in Tanjiang River. Environmental Science and Technology, 35(9):143-149. (in Chinese)

30
Xie X J, Kang J C, Li W J . 2010. Analysis on heavy metal concentrations in agricultural soils of Baoshan, Shanghai. Environmental Science, 31(3):768-774.

31
Xie Z Y, Zhang Y J, Chen D Q , et al. 2016. Research on assessment methods for soil heavy metal pollution: A case study of Guangzhou. Journal of Agro-Environment Science, 35(7):1329-1337. (in Chinese)

32
Zhang Z Y, Jilili A, Jiang F Q , et al. 2015. Environment risk and chemical forms of heavy metals in farmland of Ebinur Basin. Scientia Geographica Sinica, 35(9):1198-1206. (in Chinese)

33
Zheng G Z. 2007. Theory and practice of research on heavy metal pollution in agricultural soil. Beijing: China Environmental Science Press. (in Chinese)

34
Zhou C S, Zou S Z, Li L J , et al. 2015. Comparison of evaluation methods for soil heavy metals contamination. Earth and Environment, 43(6):709-713. (in Chinese)

Outlines

/