
Journal of Resources and Ecology >
Changes in China’s Grain Production Pattern and the Effects of Urbanization and Dietary Structure
|
LU Chunxia, E-mail: lucx@igsnrr.ac.cn |
Received date: 2020-03-11
Accepted date: 2020-04-27
Online published: 2020-09-30
Supported by
The Key Deployment Project of Chinese Academy of Sciences(KJZD-EW-G20)
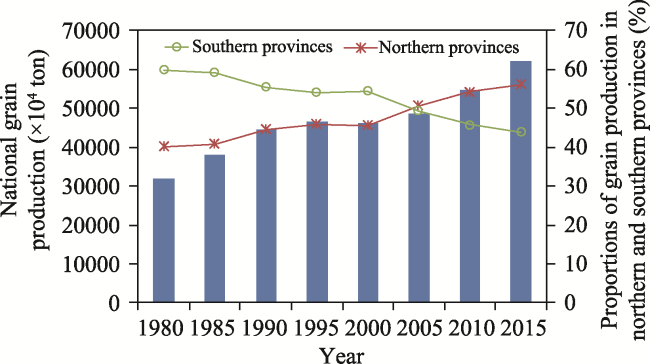
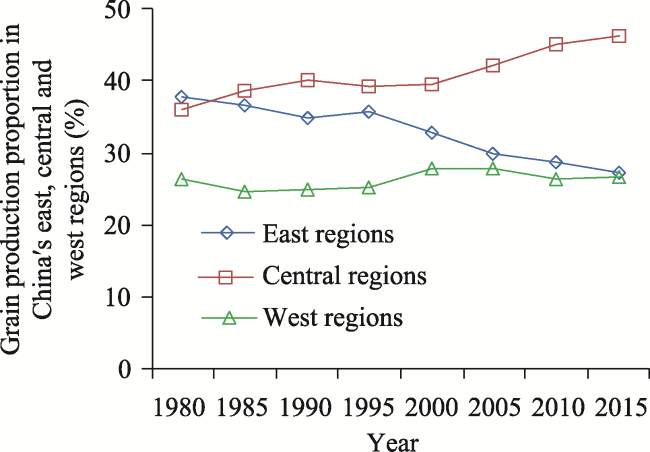
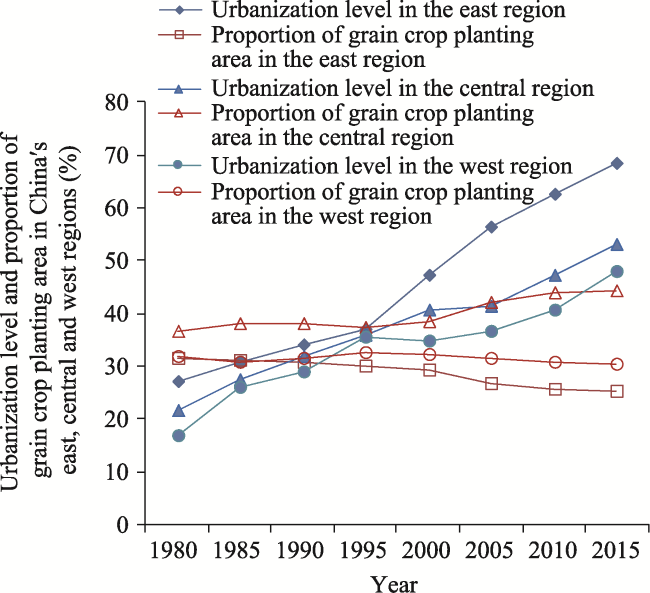
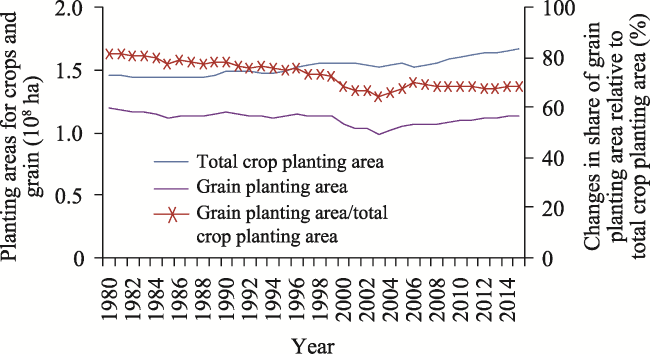
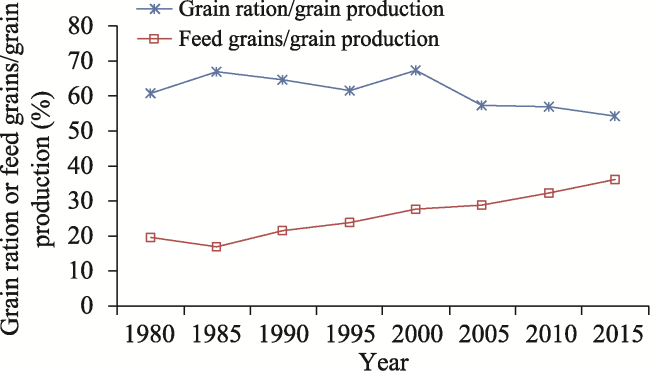
Grain production patterns are the basis of a nation’s food security. Since China’s reform and opening-up began in 1978, China’s urbanization process, driven by rapid social and economic development, has accelerated steadily. During this time, the dietary structure of urban and rural Chinese has also changed significantly. Accordingly, grain production patterns have undergone major changes. First, traditional grain production patterns in the north and the south have changed, and the food production center has shifted toward the north. In 1980, the grain yield of southern provinces accounted for 60% of China’s total, while that of northern provinces accounted for 40%. In 2015, the grain yield of southern provinces accounted for 56% of the total, while that of northern provinces accounted for 44%. Second, grain production by regions of the country is “shrinking in the east but expanding in the central regions,” meaning that grain production in eastern coastal provinces has decreased significantly, while that in the central region has expanded. The proportions of the nation’s total grain production from the eastern, central and western regions were 38%, 36% and 26%, respectively, in 1980. These had changed to 27%, 46%, and 27%, respectively, in 2015. Third, the spatial centralization of grain production has increased. The total grain yield of 13 major grain-producing provinces and regions in the country accounted for 69.27% of nation’s total in 1980, and it had reached 76.18% in 2015, showing that the impact of major grain-producing areas on national food security has increased. The influence of rapid urbanization on grain production areas shows remarkable regional differences. As the level of urbanization has increased, build-up land occupies a large number of high-quality farmland, especially in east coastal provinces and thus the grain planting area decreased obviously. The effect of dietary structure changes on grain production patterns was evident in two ways. On the one hand, as dietary diversity has increased, total grain consumption has decreased. The reduction in the proportion of planting area for grain crops to total crop planting area dropped from 82% in 1980 to 68% in 2015, making this change in total grain consumption evident. On the other hand, the ratio of grain for human consumption declined as the ratio of grain consumed by animals increased. The reduction in the proportion of rice and wheat grown and an increase in the proportion of feed grain production (mostly maize) from 20% in the 1980s to 36% in 2015 makes this change in grain production and consumption evident. In the future, with the establishment of national functional areas for grain production, the spatial pattern of grain production will return, while the demand for feed grains will continue to increase but with the space for expansion limited.
Key words: grain production; spatial patterns; urbanization; dietary structure; China
LU Chunxia , LIU Aimin , XIAO Yu , LIU Xiaojie , XIE Gaodi , CHENG Shengkui . Changes in China’s Grain Production Pattern and the Effects of Urbanization and Dietary Structure[J]. Journal of Resources and Ecology, 2020 , 11(4) : 358 -365 . DOI: 10.5814/j.issn.1674-764x.2020.04.004
Fig. 1 Changes in grain yield and the proportions of total production for the northern and the southern provinces |
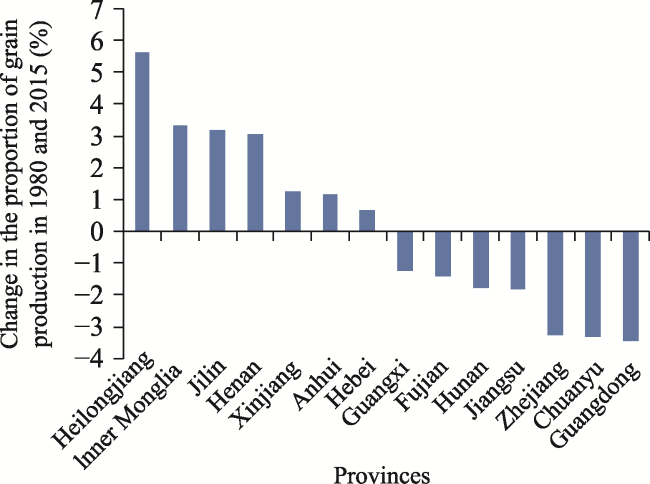
Fig. 2 Provinces with significant changes in grain production between 1980 and 2015 |
Fig. 3 Changes in the proportion of grain production in the eastern, central and western regions of China |
Table 1 Centralization levels for China’s 13 major grain-producing provinces (regions) (%) |
| Main provinces | 1980 | 1985 | 1990 | 1995 | 2000 | 2005 | 2010 | 2015 |
|---|---|---|---|---|---|---|---|---|
| Heilongjiang | 4.56 | 3.77 | 5.18 | 5.47 | 5.51 | 6.39 | 9.17 | 10.18 |
| Henan | 6.70 | 7.15 | 7.40 | 7.43 | 8.87 | 9.47 | 9.95 | 9.76 |
| Shandong | 7.44 | 8.28 | 7.52 | 9.10 | 8.30 | 8.09 | 7.93 | 7.58 |
| Jilin | 2.68 | 3.23 | 4.5 9 | 4.27 | 3.54 | 5.33 | 5.20 | 5.87 |
| Jiangsu | 7.54 | 8.25 | 7.24 | 7.04 | 6.72 | 5.86 | 5.92 | 5.73 |
| Anhui | 4.54 | 5.72 | 5.51 | 5.53 | 5.35 | 5.38 | 5.64 | 5.69 |
| Sichuan | 10.72 | 10.10 | 9.56 | 9.35 | 7.30 | 6.63 | 5.90 | 5.54 |
| Hebei | 4.75 | 5.19 | 5.10 | 5.87 | 5.52 | 5.37 | 5.45 | 5.41 |
| Hunan | 6.63 | 6.63 | 5.94 | 5.77 | 5.99 | 5.53 | 5.21 | 4.83 |
| Inner Mongolia | 1.24 | 1.59 | 2.18 | 2.26 | 2.69 | 3.43 | 3.95 | 4.55 |
| Hubei | 4.79 | 5.85 | 5.55 | 5.28 | 4.80 | 4.50 | 4.24 | 4.35 |
| Jiangxi | 3.87 | 4.05 | 3.72 | 3.44 | 3.49 | 3.63 | 3.58 | 3.46 |
| Liaoning | 3.81 | 2.57 | 3.35 | 3.05 | 2.47 | 3.61 | 3.23 | 3.22 |
| Total | 69.27 | 72.38 | 72.84 | 73.87 | 70.55 | 73.23 | 75.36 | 76.18 |
Fig. 4 Changes in urbanization levels and the proportion of grain planting area in the eastern region of China |
Fig. 5 Changes in planting area and the proportion of crops and grain crops |
Fig. 6 Changes in the proportion of grain ration production and feed grains in grain output |
| 1 |
|
| 2 |
|
| 3 |
|
| 4 |
|
| 5 |
|
| 6 |
|
| 7 |
|
| 8 |
|
| 9 |
|
| 10 |
|
| 11 |
|
| 12 |
|
| 13 |
|
| 14 |
|
| 15 |
|
| 16 |
|
| 17 |
|
| 18 |
|
| 19 |
|
| 20 |
|
| 21 |
|
| 22 |
|
| 23 |
|
| 24 |
|
/
| 〈 |
|
〉 |