
Journal of Resources and Ecology >
Are There Differences in the Response of Natural Stand and Plantation Biomass to Changes in Temperature and Precipitation? A Case for Two-needled Pines in Eurasia
|
USOLTSEV Vladimir Andreevich, E-mail: Usoltsev50@mail.ru |
Received date: 2020-02-18
Accepted date: 2020-05-15
Online published: 2020-09-30
Supported by
The Current Scientific Research of the Ural Forest Engineering University and Botanical Garden of the Ural Branch of Russian Academy of Sciences(15-04-03-899)
A comparative discussion of the advantages and disadvantages of natural stands and plantations, including in terms of their productivity and stability, began from the moment of the first forest plantings and continues to this day. In the context of the progressive replacement of natural forests by plantations due to deforestation, the question of how will change the carbon storage capacity of forest cover when replacing natural forests with artificial ones in a changing climate becomes extremely relevant. This article presents the first attempt to answer this question at the transcontinental level on a special case for two-needled pine trees (subgenus Pinus L.). The research was carried out using the database compiled by the authors on the single-tree biomass structure of forest-forming species of Eurasia, in particular, data of 1880 and 1967 of natural and plantation trees, respectively. Multi-factor regression models are calculated after combining the matrix of initial data on the structure of tree biomass with the mean January temperature and mean annual precipitation, and their adequacy indices allow us to consider them reproducible. It is found that the aboveground and stem biomass of equal-sized and equal-aged natural and plantation trees increases as the January temperature and precipitation rise. This pattern is only partially valid for the branches biomass, and it has a specific character for the foliage one. The biomass of all components of plantation trees is higher than that of natural trees, but the percent of this excess varies among different components and depends on the level of January temperatures, but does not depend at all on the level of annual precipitation. A number of uncertainties that arose during the modeling process, as well as the preliminary nature of the obtained regularities, are noted.
USOLTSEV Vladimir Andreevich , SHOBAIRI Seyed Omid Reza , TSEPORDEY Ivan Stepanovich , AHRARI Amirhossein , ZHANG Meng , SHOAIB Ahmad Anees , CHASOVSKIKH Viktor Petrovich . Are There Differences in the Response of Natural Stand and Plantation Biomass to Changes in Temperature and Precipitation? A Case for Two-needled Pines in Eurasia[J]. Journal of Resources and Ecology, 2020 , 11(4) : 331 -341 . DOI: 10.5814/j.issn.1674-764x.2020.04.001
Table 1 Distribution of the 3847 sample trees by species, countries, regions, and mensuration indices |
| Regions | Species of the subgenus Pinus L. | Ages (yr) | DBH (cm) | Heights (m) | Sample No. | ||
|---|---|---|---|---|---|---|---|
| Natural stand | |||||||
| West Europe | P. sylvestris L. | 11-100 | 1.4-53.1 | 2.3-32.0 | 19 | ||
| Scandinavia | P. sylvestris L. | 9-212 | 1.9-42.0 | 3.3-32.4 | 117 | ||
| The Ukraine and Byelorussia | P. sylvestris L. | 24-186 | 1.5-54.6 | 1.6-36.6 | 205 | ||
| European Russia | P. sylvestris L. | 10-207 | 0.9-54.0 | 2.2-30.2 | 514 | ||
| Turgay deflection | P. sylvestris L. | 13-110 | 0.3-47.8 | 1.4-27.4 | 411 | ||
| Central Siberia | P. sylvestris L. | 4-430 | 0.5-65.6 | 1.6-28.8 | 587 | ||
| China | P. sylvestris L. | 100 | 18.0 | 19.0 | 1 | ||
| P.massoniana Lamb. | 20 | 8.0-22.3 | 10.4-16.5 | 8 | |||
| Japan | P. densiflora S. et Z. | 49-120 | 9.2-60.9 | 14.1-35.7 | 11 | ||
| P. thunbergii Parl. | 22-33 | 9.0-24.3 | 9.5-16.6 | 7 | |||
| Sub-total | 1880 | ||||||
| Plantations | |||||||
| West and Central Europe | P. sylvestris L. | 7-50 | 0.5-36.5 | 1.4-21.0 | 77 | ||
| Scandinavia | P. sylvestris L. | 5-143 | 1.2-37.1 | 2.1-25.6 | 196 | ||
| The Ukraine and Byelorussia | P. sylvestris L. | 8-90 | 2.1-42.9 | 2.2-34.7 | 1010 | ||
| European Russia | P. sylvestris L. | 6-78 | 1.5-30.1 | 1.8-32.6 | 160 | ||
| Turgay deflection | P. sylvestris L. | 9-50 | 0.4-21.7 | 1.4-16.2 | 215 | ||
| Central Siberia | P. sylvestris L. | 10-73 | 2.0-36.0 | 2.4-21.6 | 170 | ||
| Iraq | P. halepensis Mill. | 24 | 15.8 | 7.4 | 1 | ||
| China | P. tabuliformis Carr. | 17-25 | 4.0-12.0 | 3.3-10.8 | 8 | ||
| Japan | P. densiflora S. et Z. | 3-53 | 1.7-39.1 | 2.0-18.7 | 108 | ||
| P. thunbergii Parl. | 5-34 | 4.6-11.4 | 4.7-7.6 | 12 | |||
| Sub-total | 1967 | ||||||
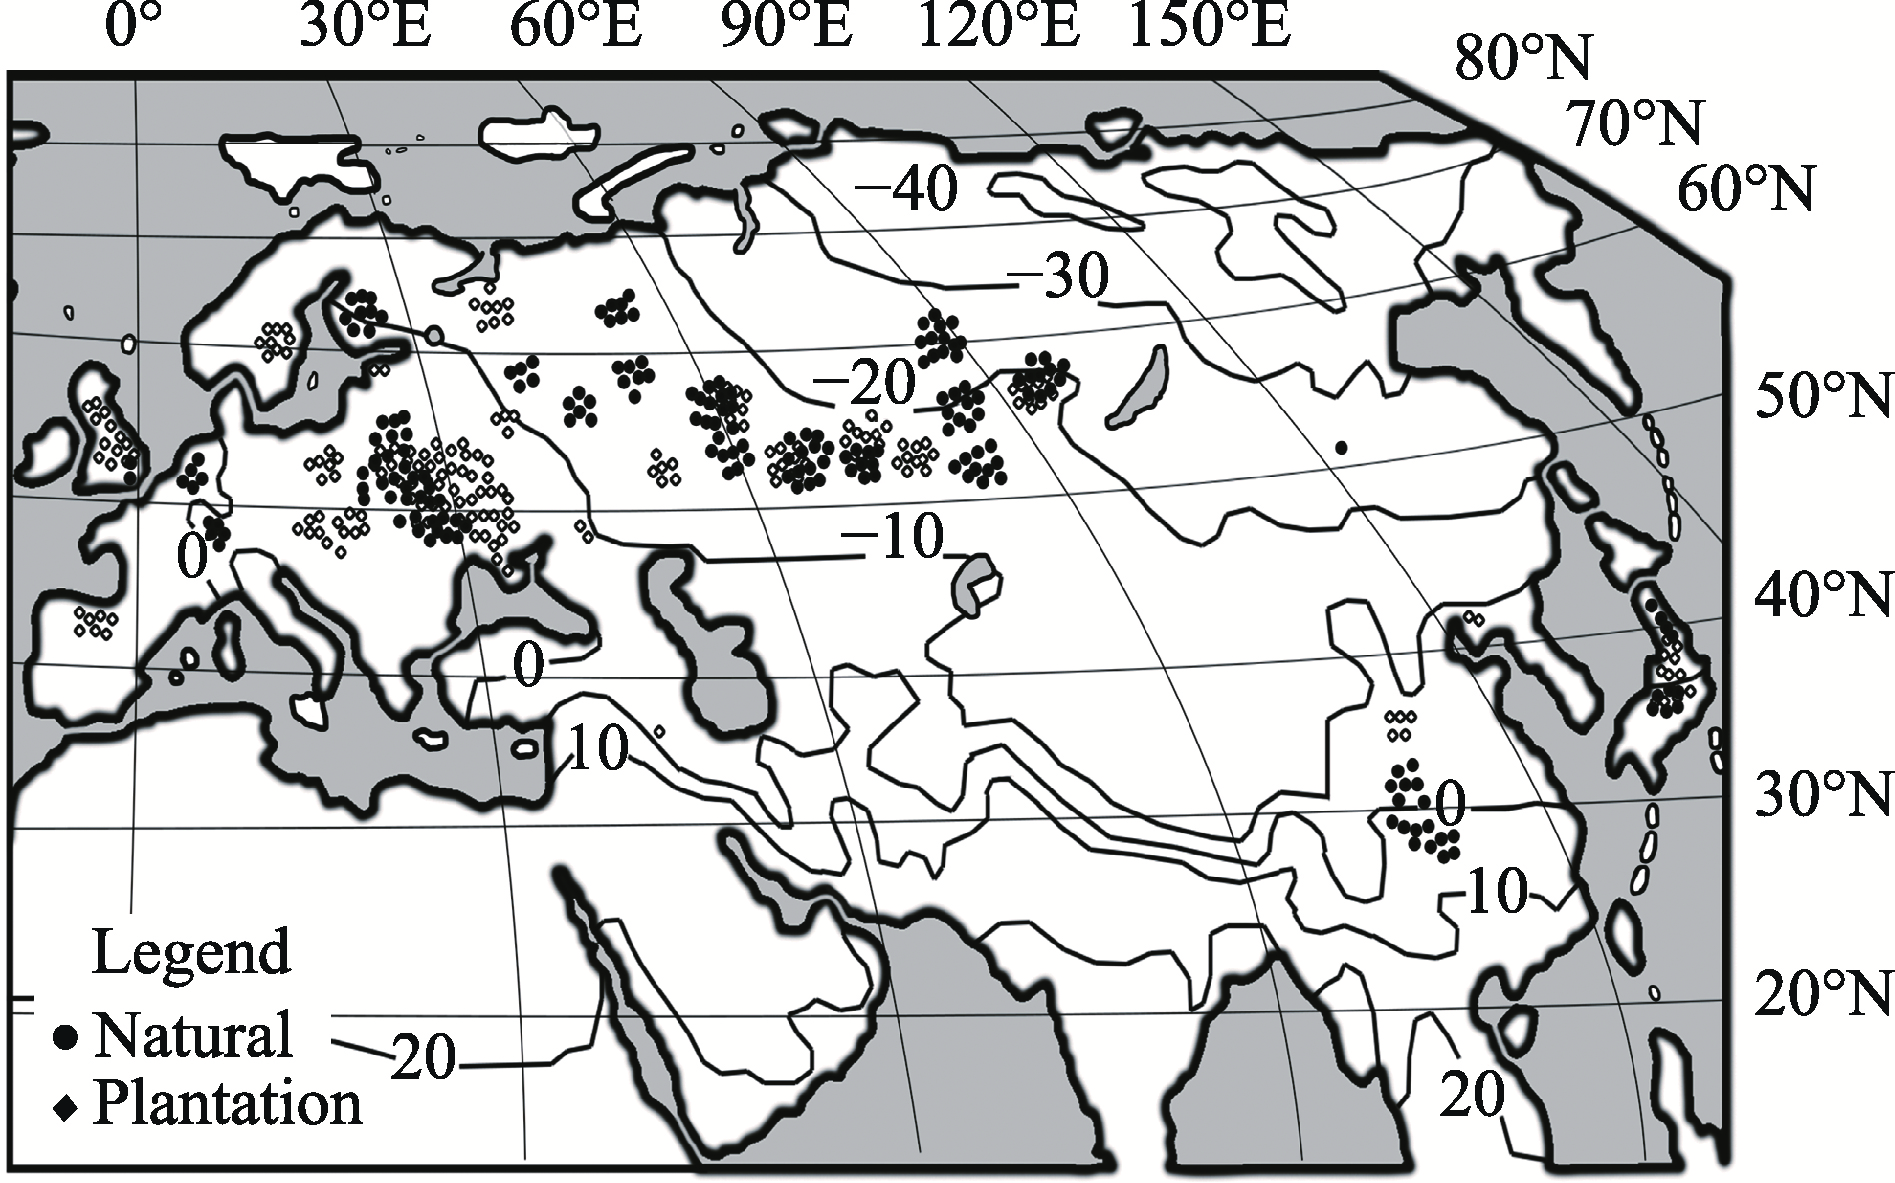
Fig. 1 Distribution of sample plots, where 1880 and 1967 trees of natural (rings) and plantation (squares) origin correspondingly have been harvested, on the map of the mean January temperature (℃) .(World Weather Maps 2007. https://store.mapsofworld.com/image/cache/data/map2014/currents-and-temperature-jan-enlarge-900x700.jpg). |
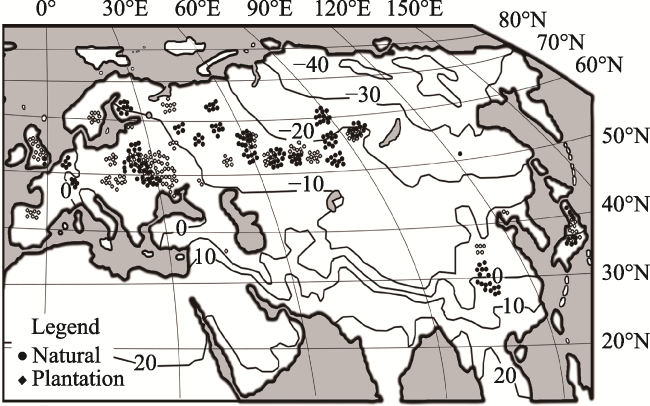
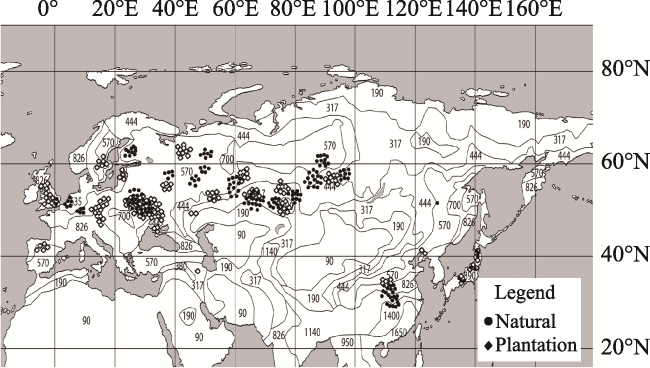
Fig. 2 Distribution of sample plots, where 1880 and 1967 trees of natural (rings) and plantation (squares) origin correspondingly have been harvested, on the map of the mean annual precipitation (mm).(World Weather Maps 2007. http://www.mapmost.com/world-precipitation-map/free-world-precipitation-map/). |
Table 2 Characteristics of regression model (1) calculated |
| Pi | Regression model calculated | adjR2 | SE |
|---|---|---|---|
| Ps | Ps = 2.014×10‒3+A0.1525+D1.5284+H0.4322+D0.1398(lnH)+e-0.1448B+(T+40)0.0526B+(T+40)0.6901+PR0.4292+(T+40)-0.1046(lnPR) | 0.987 | 1.24 |
| Pf | Pf = 7.842×10‒5+A-0.4624+D2.4422+H-1.2824+D0.1571(lnH)+e1.3265B+(T+40)-0.3345B+(T+40)2.1870+PR1.4287+(T+40)-0.3918(lnPR) | 0.900 | 1.61 |
| Pb | Pb = 6.524×10‒6+A-0.1796+D2.8848+H-1.6954+D0.1995(lnH)+e0.1512B+(T+40)-0.0343B+(T+40)2.4966+PR1.5638+(T+40)-0.4007(lnPR) | 0.926 | 1.66 |
| Pa | Pa = 2.218×10‒4+A0.0407+D1.7700+H-0.1235+D0.1778(lnH)+e0.2536B+(T+40)-0.0629B+(T+40)1.6918+PR1.0370+(T+40)-0.2635(lnPR) | 0.986 | 1.24 |
Note: Ps, Pf, Pb, Pa mean biomass of stem over bark, needle, branches and aboveground, respectively; The abbreviation adjR2 is a coefficient of determination adjusted for the number of parameters; SE is equation standard error. |
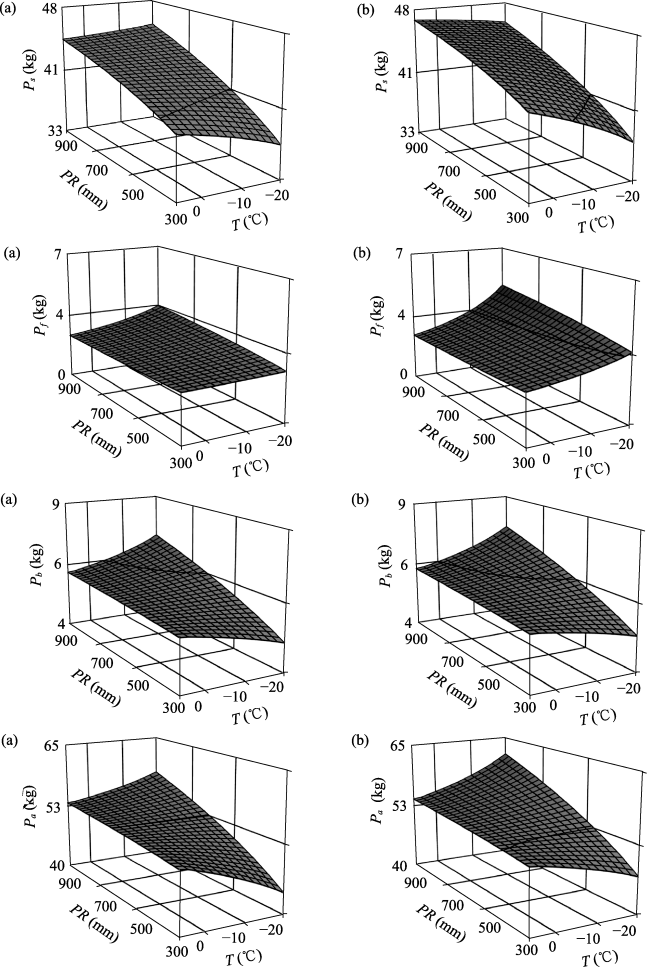
Fig. 3 Dependence of pine tree biomass in natural stands (a) and plantations (b) upon the mean January temperature (T) and mean annual precipitation (PR)Note: Ps, Pf, Pb and Pa are dry biomass in kg of stem, foliage, branches and aboveground, respectively. |
Fig. 4 Changes of the theoretical R/S ratio of natural stands and plantations in relation to tree stem diameter under different mean January temperature (T). |
Table 3 Changes in the excess percentage (%) of different components biomass of plantation trees above natural ones due to changes in January temperature |
| Biomass component | Mean temperature in January (℃) | ||||||
|---|---|---|---|---|---|---|---|
| -20 | -16 | -12 | -8 | -4 | 0 | 4 | |
| Stems | 1.3 | 2.2 | 3.0 | 3.7 | 4.3 | 4.8 | 5.3 |
| Foliage | 27.7 | 23.1 | 19.1 | 15.4 | 12.0 | 8.8 | 5.9 |
| Branches | 4.8 | 4.2 | 3.6 | 3.2 | 2.8 | 2.5 | 2.1 |
| Aboveground | 6.3 | 5.2 | 4.3 | 3.5 | 2.8 | 2.1 | 1.5 |
Fig. 5 Change of tree biomass of natural stands (a) and plantations (b) when temperature assumes to be increased by 1 ℃ due to the expected climate change at different territorial levels of temperature and precipitationNote: Symbols Δs, Δf, Δb and Δa on the ordinate axes mean the change (± %) of biomass of stems, foliage, branches and aboveground, respectively, with the temperature increase by 1 ℃ and at the constant precipitation. |
Fig. 6 Change of tree biomass of natural stands and plantations when precipitation assumes to be increased by 100 mm due to the expected climate change at different territorial levels of temperature and precipitationNote: The symbols Δs, Δf, Δb and Δa along the ordinate axes represent the change (± %) of biomass of stems, foliage, branches and aboveground, respectively, with precipitation increase by 100 mm and at the constant mean temperatures of January. |
Fig. 7 Change of R/S ratio of natural stands and plantations when temperature assumes to be increased by 1 ℃ due to the expected climate change at different territorial levels of temperature |
| 1 |
|
| 2 |
|
| 3 |
|
| 4 |
|
| 5 |
|
| 6 |
|
| 7 |
|
| 8 |
|
| 9 |
|
| 10 |
|
| 11 |
|
| 12 |
|
| 13 |
|
| 14 |
|
| 15 |
|
| 16 |
|
| 17 |
|
| 18 |
FAO(Food and Agriculture Organization of the United Nations). 2006. Global forest resources assessment 2005—Progress towards sustainable forest management. FAO Forestry Paper 147, Rome, Italy, 320.
|
| 19 |
|
| 20 |
|
| 21 |
|
| 22 |
|
| 23 |
|
| 24 |
|
| 25 |
|
| 26 |
|
| 27 |
|
| 28 |
|
| 29 |
|
| 30 |
|
| 31 |
|
| 32 |
|
| 33 |
|
| 34 |
|
| 35 |
|
| 36 |
|
| 37 |
|
| 38 |
|
| 39 |
|
| 40 |
|
| 41 |
|
| 42 |
|
| 43 |
|
| 44 |
|
| 45 |
|
| 46 |
|
| 47 |
|
| 48 |
|
| 49 |
|
| 50 |
|
| 51 |
|
| 52 |
|
| 53 |
|
| 54 |
|
| 55 |
|
| 56 |
|
| 57 |
|
| 58 |
|
| 59 |
|
| 60 |
|
| 61 |
|
| 62 |
|
| 63 |
|
| 64 |
|
| 65 |
World Weather Maps. 2007. URL: https://www.mapsofworld.com/referals/weather.
|
| 66 |
|
| 67 |
|
| 68 |
|
| 69 |
|
| 70 |
|
/
| 〈 |
|
〉 |