
Journal of Resources and Ecology >
Response of Plant Community Carbon and Nitrogen Stoichiometry to Experimental Warming on the Qinghai-Tibet Plateau
|
ZHANG Haorui, E-mail: zhanghr.18s@igsnrr.ac.cn |
Received date: 2019-11-26
Accepted date: 2020-02-17
Online published: 2020-06-16
Supported by
The National Key Research and Development Program of China(2016YFC0502001)
The National Key Research and Development Program of China(2016YFC0502005)
Youth Innovation Promotion Association of Chinese Academy of Sciences(2020054)
The National Natural Science Foundation of China(31600432)
Bingwei Outstanding Young Talents Program of Institute of Geographic Sciences and Natural Resources Research, Chinese Academy of Sciences(2018RC202)
Tibet Science and Technology Major Projects of the Pratacultural Industry(XZ201901NA03)
Copyright
Low temperature is an important limiting factor for alpine ecosystems on the Tibetan Plateau. This study is based on data from on-site experimental warming platforms (open top chambers, OTC) at three elevations (4300 m, 4500 m, 4700 m) on the Qinghai-Tibet Plateau. The carbon and nitrogen stoichiometry characteristics of plant communities, both above-ground and below-ground, were observed in three alpine meadow ecosystems in August and September of 2011 and August of 2012. Experimental warming significantly increased above-ground nitrogen content by 21.4% in September 2011 at 4500 m, and reduced above-ground carbon content by 3.9% in August 2012 at 4300 m. Experimental warming significantly increased below-ground carbon content by 5.5% in August 2011 at 4500 m, and the below-ground ratio of carbon to nitrogen by 28.0% in September 2011 at 4300 m, but reduced below-ground nitrogen content by 15.7% in September 2011 at 4700 m, below-ground carbon content by 34.3% in August 2012 at 4700 m, and the below-ground ratio of carbon to nitrogen by 37.9% in August 2012 at 4700 m. Experimental warming had no significant effect on the characteristics of community carbon and nitrogen stoichiometry under other conditions. Therefore, experimental warming had inconsistent effects on the carbon and nitrogen stoichiometry of plant communities at different elevations and during different months. Soil ammonium nitrogen and nitrate nitrogen content were the main factors affecting plant community carbon and nitrogen stoichiometry.
ZHANG Haorui , QIN Jiwei , FU Gang . Response of Plant Community Carbon and Nitrogen Stoichiometry to Experimental Warming on the Qinghai-Tibet Plateau[J]. Journal of Resources and Ecology, 2020 , 11(3) : 315 -321 . DOI: 10.5814/j.issn.1674-764X.2020.03.009
Table 1 Monthly temperature and precipitation in Damxung County |
| Observation month | Air temperature (℃) | Precipitation (mm) | ||||
|---|---|---|---|---|---|---|
| 4300 m | 4500 m | 4700 m | 4300 m | 4500 m | 4700 m | |
| 2011-08 | 11.41 | 10.11 | 9.01 | 56.81 | 57.52 | 58.18 |
| 2011-09 | 10.49 | 9.29 | 8.29 | 58.14 | 59.95 | 61.04 |
| 2012-08 | 12.02 | 10.80 | 9.76 | 80.53 | 83.40 | 85.91 |
Table 2 Analysis of repeated measures of variance for the effects of experimental warming and the observation month were taken on carbon content, nitrogen content and the ratio of carbon to nitrogen for the above-ground parts of plant communities. |
| Nitrogen content | Carbon content | C/N | |||||
|---|---|---|---|---|---|---|---|
| F | P | F | P | F | P | ||
| 4300 m | Warming(W) | 0.96 | 0.382 | 3.41 | 0.139 | 3.84 | 0.122 |
| Month(M) | 13.44 | 0.003 | 4.09 | 0.060 | 18.93 | 0.001 | |
| W×M | 0.78 | 0.492 | 0.25 | 0.788 | 0.40 | 0.682 | |
| 4500 m | Warming(W) | 0.47 | 0.532 | 0.01 | 0.948 | 1.25 | 0.327 |
| Month(M) | 40.52 | 0.000 | 4.50 | 0.049 | 63.79 | 0.000 | |
| W×M | 2.34 | 0.159 | 1.26 | 0.336 | 7.71 | 0.014 | |
| 4700 m | Warming(W) | 0.34 | 0.593 | 0.02 | 0.906 | 1.61 | 0.273 |
| Month(M) | 53.72 | 0.000 | 18.31 | 0.001 | 103.77 | 0.000 | |
| W×M | 5.17 | 0.036 | 0.23 | 0.800 | 6.29 | 0.023 | |
Note: F: f-valued; P: significance probability. |
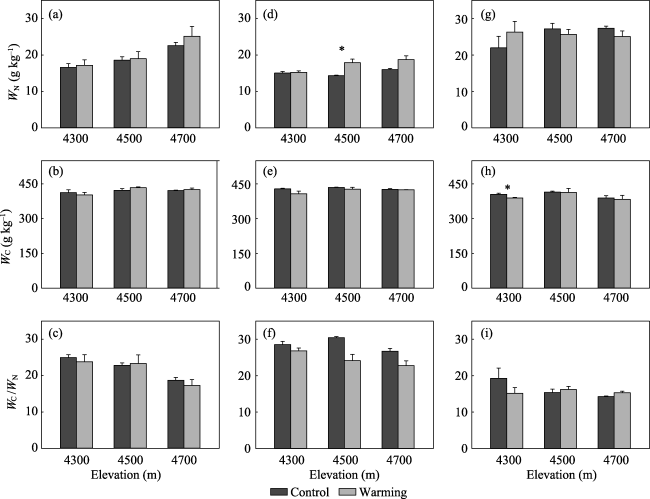
Fig. 1 Effects of experimental warming on the carbon content, nitrogen content and the ratio of carbon to nitrogen for the above-ground parts of plant communities in alpine meadows at elevations 4300 m, 4500 m and 4700 m in August 2011 (a, b, c), September 2011 (d, e, f) and August 2012 (g, h, i) Note: Values with “*” show significant differences in the carbon and nitrogen content after experimental warming at the 0.05 level. |
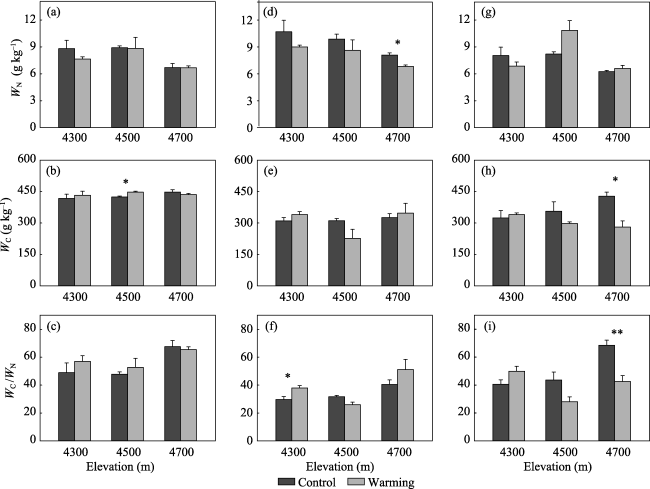
Fig. 2 Effects of experimental warming on the carbon content, nitrogen content and the ratio of carbon to nitrogen for the below-ground parts of plant communities in alpine meadows at elevations 4300 m, 4500 m and 4700 m in August 2011 (a, b, c), September 2011 (d, e, f) and August 2012 (g, h, i) Note: Values with “*” “**” show significant differences in the carbon and nitrogen content after experimental warming at the 0.05 level and 0.01 level, respectively. |
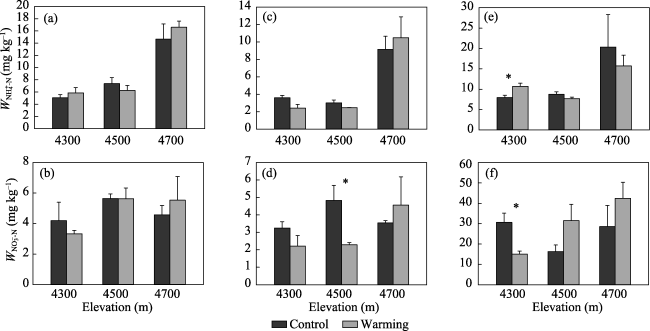
Fig. 3 Effects of experimental warming on soil NH4+-N and NO3--N in alpine meadows at elevations 4300 m, 4500 m and 4700 m in August 2011 (a, b), September 2011 (c, d) and August 2012 (e, f) Note: Values with “*” show significant differences in the NH4+-N and NO3--N content after experimental warming at the 0.05 level. |
Table 3 Analysis of repeated measures of variance for the effects of experimental warming and the observation month were taken on carbon content, nitrogen content and the ratio of carbon to nitrogen for the belowground parts of plant communities |
| Elevation | Model | Nitrogen content | Carbon content | C/N | |||
|---|---|---|---|---|---|---|---|
| F | P | F | P | F | P | ||
| 4300 m | Warming | 7.62 | 0.051 | 1.469 | 0.292 | 4.936 | 0.090 |
| Month | 4.00 | 0.115 | 14.69 | 0.002 | 14.63 | 0.002 | |
| Interaction | 0.06 | 0.814 | 0.08 | 0.923 | 0.02 | 0.981 | |
| 4500 m | Warming | 1.10 | 0.354 | 2.24 | 0.209 | 6.05 | 0.070 |
| Month | 0.22 | 0.808 | 28.87 | 0.000 | 11.76 | 0.004 | |
| Interaction | 1.99 | 0.199 | 3.16 | 0.097 | 2.57 | 0.137 | |
| 4700 m | Warming | 2.10 | 0.221 | 13.80 | 0.021 | 3.40 | 0.139 |
| Month | 7.00 | 0.017 | 7.34 | 0.016 | 9.56 | 0.008 | |
| Interaction | 4.42 | 0.051 | 4.54 | 0.048 | 7.74 | 0.013 | |
Note: F: f-valued; P: significance probability. |
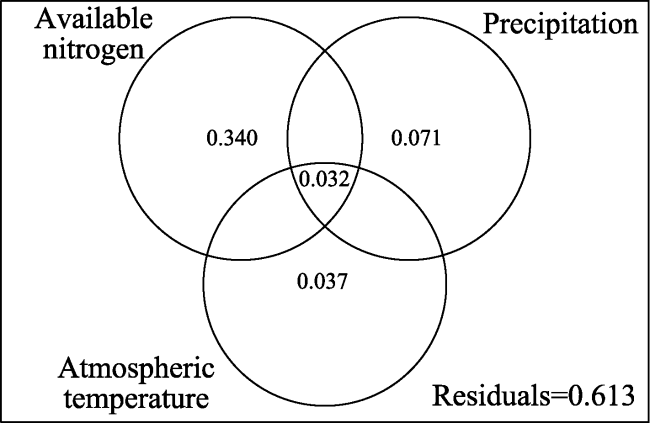
Fig. 4 Variation partitioning analyses (VPA) of the carbon content, nitrogen content and the ratio of carbon to nitrogen of plant communities in alpine meadows. |
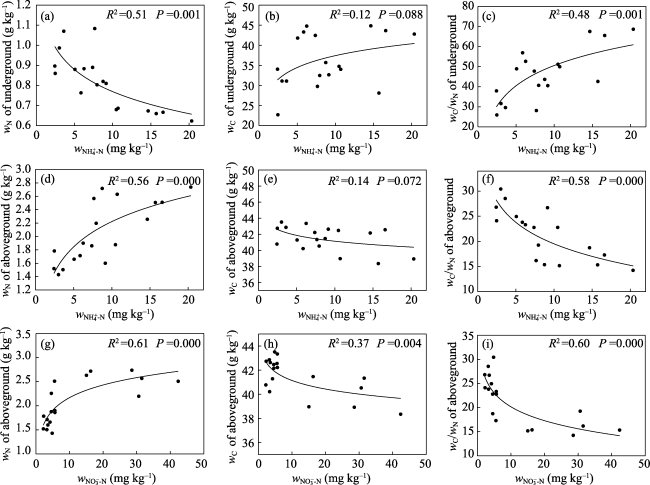
Fig. 5 Regression analyses of the carbon content, nitrogen content and the ratio of carbon to nitrogen of plant communities with NH4+-N and NO3--N in the soil |
| 1 |
|
| 2 |
|
| 3 |
|
| 4 |
|
| 5 |
|
| 6 |
|
| 7 |
|
| 8 |
|
| 9 |
|
| 10 |
|
| 11 |
|
| 12 |
|
| 13 |
|
| 14 |
|
| 15 |
|
| 16 |
|
| 17 |
|
| 18 |
|
| 19 |
|
| 20 |
|
| 21 |
|
| 22 |
|
| 23 |
|
| 24 |
|
| 25 |
|
| 26 |
|
| 27 |
|
| 28 |
|
| 29 |
|
| 30 |
|
/
| 〈 |
|
〉 |