
Journal of Resources and Ecology >
Variations in the Drought Severity Index in Response to Climate Change on the Tibetan Plateau
|
WANG Xiangtao, E-mail: wangxt.16b@igsnrr.ac.cn |
Received date: 2020-01-09
Accepted date: 2020-03-17
Online published: 2020-06-16
Supported by
The National Key Research and Development Program(2016YFC0502001)
The National Natural Science Foundation of China(41761008)
Copyright
Quantifying the relationship between the drought severity index and climate factors is crucial for predicting drought risk in situations characterized by climate change. However, variations in drought risk are not readily discernible under conditions of climate change, and this is particularly the case on the Tibetan Plateau. This study examines the correlations between the annual drought severity index (DSI) and 14 climate factors (including temperature, precipitation, humidity, wind speed, and hours of sunshine factors), on the Tibetan Plateau from 2000 to 2011. Spatial average DSI increased with precipitation and minimum relative humidity, while it decreased as the hours of sunshine increased. The correlation between DSI and climate factors varied with vegetation types. In alpine meadows, the correlation of the spatial DSI average with the percentage of sunshine and hours of sunshine (P<0.001) was higher compared to that in alpine steppes (P<0.05). Similarly, average vapor pressure and minimum relative humidity had significant positive effects on spatial DSI in alpine meadows, but had insignificant effects in alpine steppes. The magnitude of DSI change correlated negatively with temperature, precipitation, and vapor pressure, and positively with wind speed and sunshine. This demonstrates that the correlation between drought and climate change on the Tibetan Plateau is dependent on the type of ecosystem.
Key words: alpine ecosystems; climate change; drought; Tibetan Plateau
WANG Xiangtao , ZHANG Xianzhou , WANG Junhao , NIU Ben . Variations in the Drought Severity Index in Response to Climate Change on the Tibetan Plateau[J]. Journal of Resources and Ecology, 2020 , 11(3) : 304 -314 . DOI: 10.5814/j.issn.1674-764X.2020.03.008
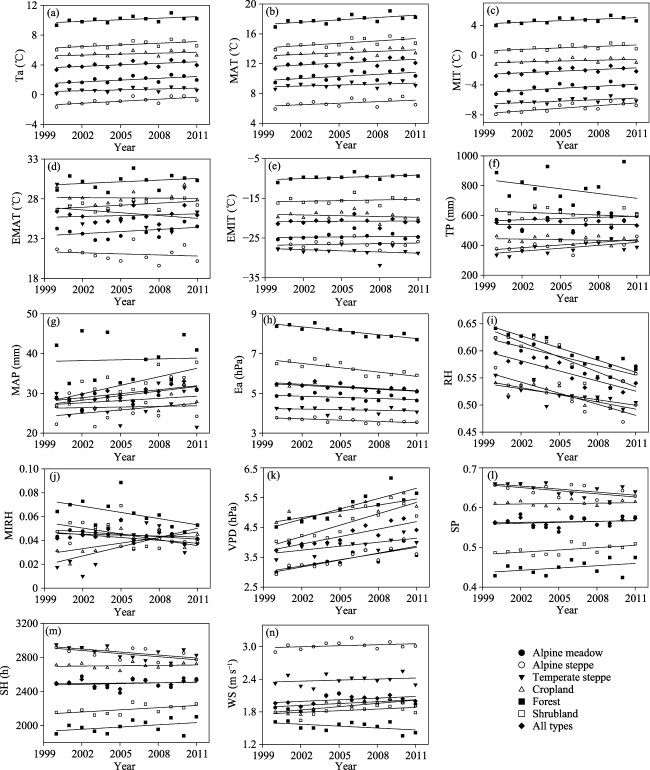
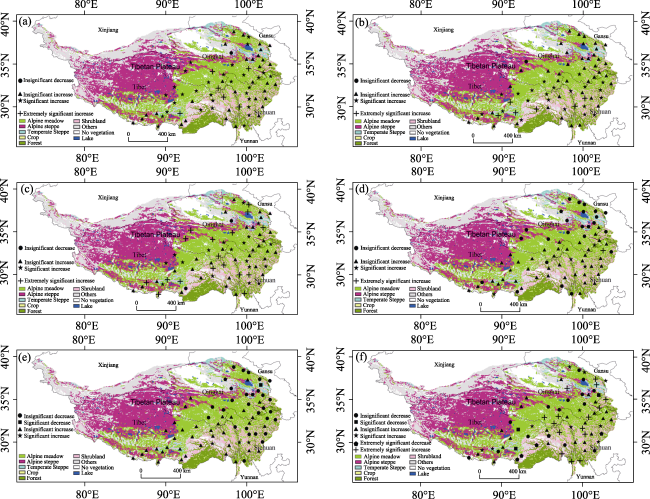
Fig. 1 Linear trends for (a) Ta, average annual air temperature; (b) MAT, maximum air temperature; (c) MIT, minimum air temperature; (d) EMAT, extreme maximum air temperature; (e) EMIT, extreme minimum air temperature; (f) TP, total precipitation; (g) MAP, maximum precipitation; (h) Ea, average vapor pressure; (i) RH, average relative humidity; (j) MIRH, minimum relative humidity; (k) VPD, average vapor pressure deficit; (l) SP, percentage of sunshine; (m) SH, sunshine hours; and (n) WS, average wind speed; from 2000 to 2011 based on data from 69 meteorological stations on the Tibetan Plateau. |
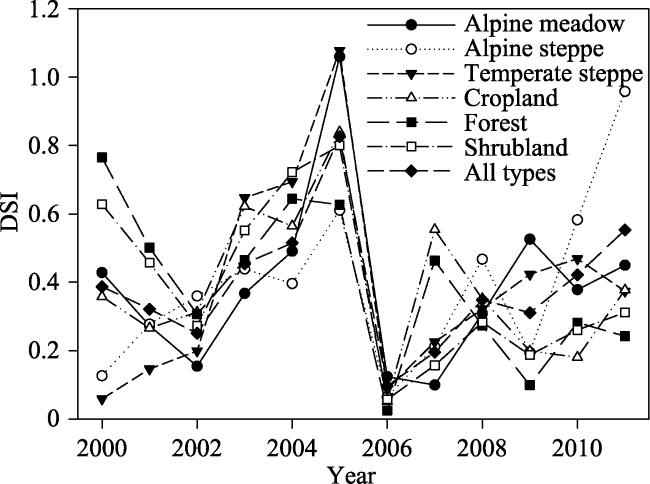
Fig. 2 Linear trends for the annual drought severity index (DSI) from 2000 to 2011, for different vegetation types on the Tibetan Plateau |
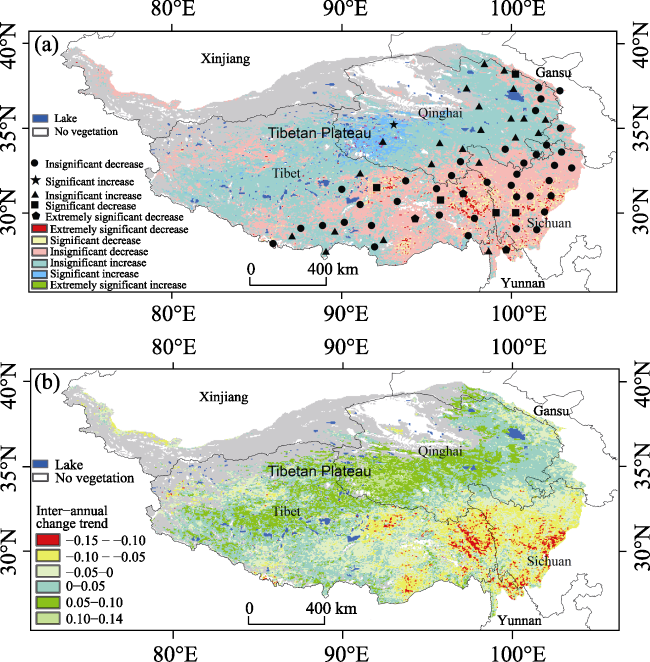
Fig. 3 Drought severity index trend from 2000 to 2011 on the Tibetan Plateau |
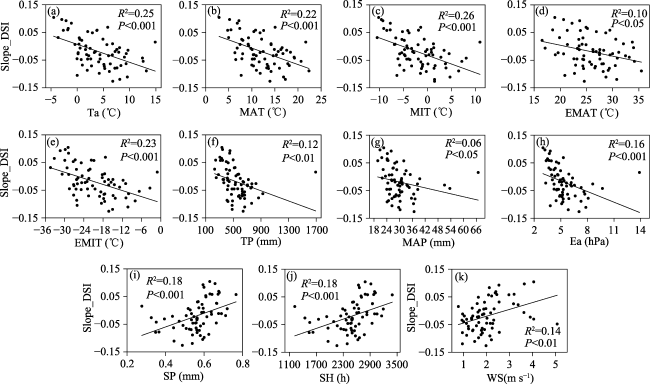
Fig. 4 Relationships of the linear trend of the annual drought severity index (Slope_DSI) with climate variables on the Tibetan Plateau. (a) average annual temperature (Ta); (b) maximum annual temperature (MAT); (c) minimum annual temperature (MIT); (d) extreme maximum annual temperature (EMAT); (e) extreme minimum annual temperature (EMIT); (f) annual precipitation (TP); (g) maximum annual precipitation (MAP); (h) average annual vapor pressure (Ea); (i) annual sunshine percentage (SP); (j) annual sunshine hours (SH); and (k) average annual wind speed (WS). |
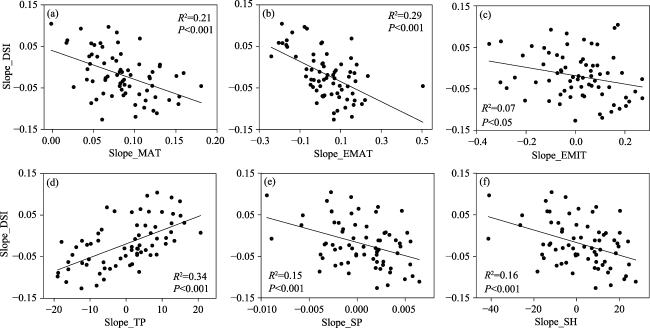
Fig. 5 Relationships between the linear trend of the annual drought severity index (Slope_DSI) and the linear trends of several climate factors: (a) maximum annual temperature (Slope_MAT); (b) extreme maximum annual temperature (Slope_EMAT); (c) extreme minimum annual temperature (Slope_EMIT); (d) annual precipitation (Slope_TP); (e) annual sunshine percentage (Slope_SP); and (f) annual sunshine hours (Slope_SH). |
Fig. 6 Annual trends for (a) Ta, average air temperature; (b) MAT, maximum air temperature; (c) MIT, minimum air temperature; (d) EMAT, extreme maximum air temperature; (e) EMIT, extreme minimum air temperature; (f) WS, average wind speed; from 2000 to 2011 at 69 meteorological stations on the Tibetan Plateau. |
Table 1 Correlation coefficients for spatially averaged annual drought severity index (DSI) with spatially averaged climate factors from 2000 to 2011 at 69 meteorological stations on the Tibetan Plateau |
| Types | Ta | MAT | MIT | EMAT | EMIT | TP | MAP | Ea | RH | MIRH | VPD | SP | SH | WS |
|---|---|---|---|---|---|---|---|---|---|---|---|---|---|---|
| Alpine meadows | -0.11 | -0.42 | 0.26 | -0.43 | -0.08 | 0.59* | 0.20 | 0.67* | 0.50 | 0.71** | -0.35 | -0.85*** | -0.87*** | 0.49 |
| Alpine steppes | 0.28 | -0.07 | 0.58* | -0.36 | 0.20 | 0.70* | 0.19 | 0.07 | -0.17 | -0.35 | 0.23 | -0.74** | -0.74** | 0.19 |
| Temperate steppes | 0.20 | 0.10 | 0.25 | 0.04 | 0.57 | 0.42 | -0.19 | 0.29 | -0.16 | 0.07 | 0.34 | -0.23 | -0.19 | 0.18 |
| Croplands | -0.34 | -0.48 | -0.14 | -0.55 | -0.05 | 0.43 | -0.22 | 0.36 | 0.50 | 0.26 | -0.49 | -0.90*** | -0.91*** | 0.26 |
| Forests | -0.71** | -0.77** | -0.73** | -0.63* | -0.69* | 0.54 | 0.24 | 0.74** | 0.78** | -0.04 | -0.76** | -0.66* | -0.65* | -0.02 |
| Shrublands | -0.66* | -0.78** | -0.51 | -0.61* | -0.36 | 0.66* | -0.43 | 0.69* | 0.75** | 0.83*** | -0.73** | -0.75** | -0.75** | 0.03 |
| All types | -0.28 | -0.49 | -0.03 | -0.40 | -0.11 | 0.61* | -0.18 | 0.54 | 0.50 | 0.74** | -0.42 | -0.86*** | -0.86*** | 0.31 |
Note: Ta, average annual temperature; MAT, maximum temperature; MIT, minimum temperature; EMAT, extreme maximum temperature; EMIT, extreme minimum temperature; TP, total precipitation; MAP, maximum precipitation; Ea, average vapor pressure; RH, average relative humidity; MIRH, minimum relative humidity; VPD, average vapor pressure deficit; SP, percentage of sunshine; SH, sunshine hours; WS, wind speed. The *, ** and *** indicate P < 0.05, P < 0.01 and P < 0.001, respectively. |
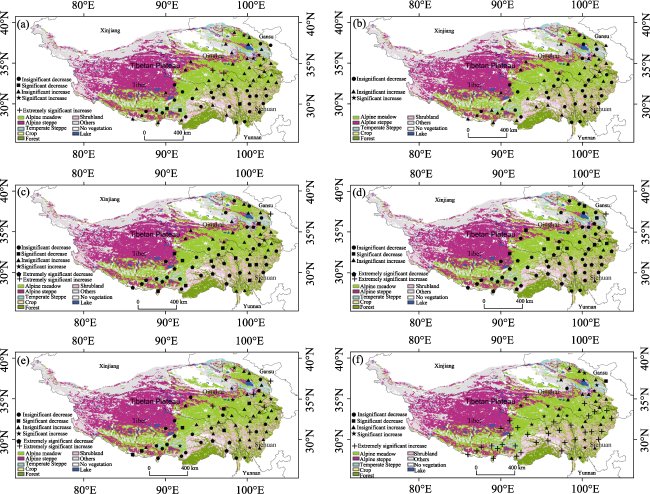
Fig. 7 Annual trends for (a) TP, total precipitation; (b) MAP, maximum precipitation; (c) Ea, average vapor pressure; (d) RH, average relative humidity; (e) MIRH, minimum relative humidity; (f) VPD, average vapor pressure deficit; from 2000 to 2011 at 69 meteorological stations on the Tibetan Plateau. |
Fig. 8 Annual trends for (a) SP, percentage of sunshine; (b) SH, sunshine hours; from 2000 to 2011 at 69 meteorological stations on the Tibetan Plateau. |
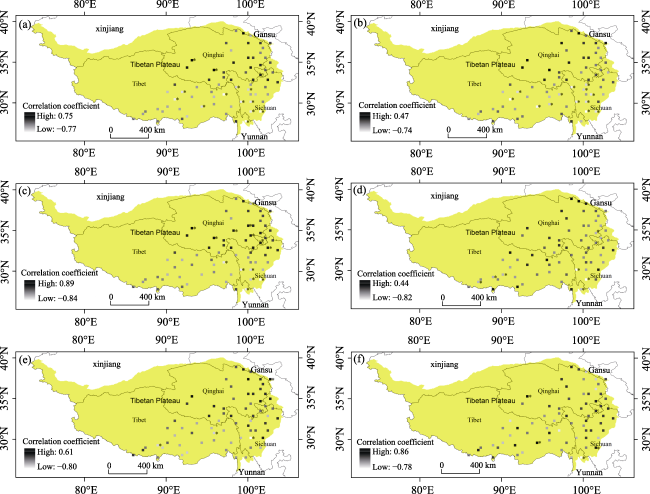
Fig. 9 Correlation coefficients of the drought severity index (DSI) with: (a) Ta, average air temperature; (b) MAT, maximum air temperature; (c) MIT, minimum air temperature; (d) EMAT, extreme maximum air temperature; (e) EMIT, extreme minimum air temperature; (f) WS, average wind speed; from 2000 to 2011 at 69 meteorological stations on the Tibetan Plateau. |
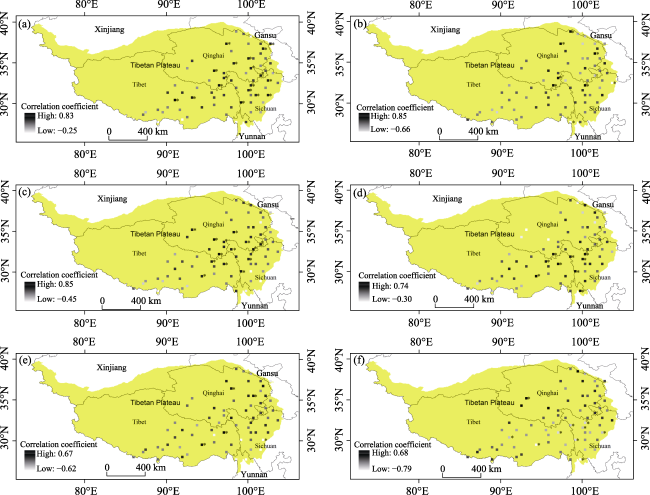
Fig. 10 Correlation coefficients of the drought severity index (DSI) with: (a) TP, total precipitation; (b) MAP, maximum precipitation; (c) Ea, average vapor pressure; (d) RH, average relative humidity; (e) MIRH, minimum relative humidity; (f) VPD, average vapor pressure deficit; from 2000 to 2011 at 69 meteorological stations on the Tibetan Plateau. |
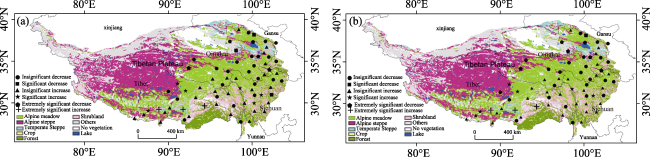
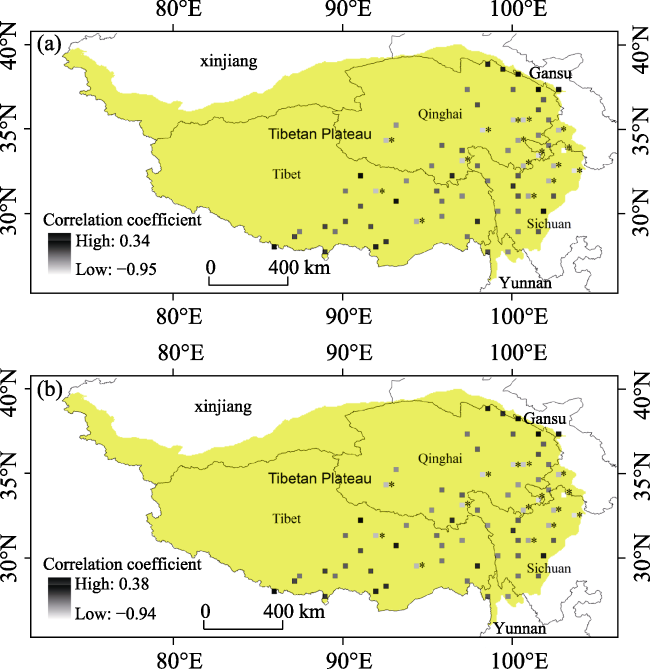
Fig. 11 Correlation coefficients of the drought severity index (DSI) with annual: (a) SP, percentage of sunshine; (b) SH, sunshine hours; from 2000 to 2011 at 69 meteorological stations on the Tibetan Plateau. |
| 1 |
|
| 2 |
|
| 3 |
|
| 4 |
|
| 5 |
Intergovernmental Panel on Climate Change(IPCC) . 2013. Summary for Policymakers. In: Stocker T F, Qin D, Plattner G K, et al.(eds.). Climate change 2013: The physical science basis. Contribution of working group I to the fifth assessment report of the intergovernmental panel on climate change. Cambridge: Cambridge University Press.
|
| 6 |
|
| 7 |
|
| 8 |
|
| 9 |
|
| 10 |
|
| 11 |
|
| 12 |
|
| 13 |
|
| 14 |
|
| 15 |
|
| 16 |
|
| 17 |
|
| 18 |
|
| 19 |
|
| 20 |
|
| 21 |
|
| 22 |
|
| 23 |
|
| 24 |
|
| 25 |
|
| 26 |
|
| 27 |
|
| 28 |
|
| 29 |
|
/
| 〈 |
|
〉 |