Resources and Environment

Temporal and Spatial Dynamics Analysis of Grassland Ecosystem Pressure in Kazakhstan

  • WEN Xin 1, 2 ,
  • YAN Huimin , 2, 3, * ,
  • XIE Xiaoping , 1, * ,
  • DU Wengpeng 2, 3 ,
  • LAI Chenxi 2 ,
  • ZHEN Lin 2, 3
Expand
  • 1. School of Geography and Tourism, Qufu Normal University, Rizhao 276826, Shandong, China
  • 2. Institute of Geographic Sciences and Natural Resources Research, Chinese Academy of Sciences, Beijing 100101, China
  • 3. University of Chinese Academy of Sciences, Beijing 100049, China
YAN Huimin, E-mail: ;
XIE Xiaoping, E-mail:

Received date: 2019-07-01

  Accepted date: 2019-08-11

  Online published: 2019-12-09

Supported by

The Strategic Priority Research Program, Chinese Academy of Sciences(XDA20010202)

The National Key Research and Development Program of China(2016YFC0503505)

The National Key Research and Development Program of China(2016YFC0503700)

Copyright

Copyright reserved © 2019

Abstract

Affected by climate change and policy factors, Kazakhstan is the country with the most severe ecological degradation and grassland conflicts in Central Asia. Therefore, studying the state of grassland carrying resources in Kazakhstan is particularly important for understanding the responses of grassland ecosystems to climate change and human activities. Based on Kazakhstan's remote sensing data and animal husbandry statistics, this study analyzes the patterns of changes in grassland ecosystems in Kazakhstan based on the supply and consumption of these ecosystems. The results show that: 1) From 2003 to 2017, the number of livestock raised in Kazakhstan showed a trend of sustained and steady growth. Due to freezing damage, the scale of livestock farming decreased in 2011, but a spatial difference in the livestock farming structure was not obvious. 2) The fluctuation of grassland supply in Kazakhstan has increased, while the consumption due to animal husbandry has also continued to increase, resulting in an increasing pressure on the grassland carrying capacity. 3) Between 2003 and 2017, the overall grassland carrying status of Kazakhstan have been abundant, but the grassland carrying pressure index has shown a steadily increasing trend, the grassland carrying pressure is growing, and it is mainly determined by grassland productivity. The greater pressure in lower Kyzylorda state, the southern Kazakhstan state of the cultivated land and the northern Kazakhstan state has gradually expanded to include the agro-pastoral zone and the semi-desert zone.

Cite this article

WEN Xin , YAN Huimin , XIE Xiaoping , DU Wengpeng , LAI Chenxi , ZHEN Lin . Temporal and Spatial Dynamics Analysis of Grassland Ecosystem Pressure in Kazakhstan[J]. Journal of Resources and Ecology, 2019 , 10(6) : 667 -675 . DOI: 10.5814/j.issn.1674-764X.2019.06.012

1 Introduction

In the past 100 years, Kazakhstan’s social system has undergone a series of changes through the sequence of the Russian Federation, the Independent Republic, the Soviet Union, and the collapse of the Soviet Union. At the same time, during the period from 1941 to 2011, the seasonal temperature in Kazakhstan showed an increasing trend, while the annual precipitation showed a downward trend, and the warming and drying trends were significant (Salnikov et al., 2015). Affected by climate change and changes in social institutions, Kazakhstan has become the country with the most severe ecological degradation and conflict between grass and livestock in Central Asia (Jiang et al., 2017; Fan et al., 2012; Luo et al., 2017; Zhang et al., 2018). After the 1940s, the Soviet government expanded the size of available pastureland in order to restore and develop the livestock industry. The grazing activities in Kazakhstan extended from the typical grassland area to the southern desert steppe area (Alimaev et al., 1986). Between 1954 and 1963, 23 million hectares of grassland was reclaimed due to the “virgin land movement” incident, and the number of livestock continued to increase, leading to further degradation of desert grassland; and biomass decreased from 483 kg hm-2 to 100 kg hm-2, which led to extensive desertification (Zhao et al., 2004;Kraemer et al., 2015). After the collapse of the Soviet Union, most herders were restricted to grazing only near their settlements, leading to plaque-like degradation that was very pronounced in localized areas (Abuduwaili et al., 2015). Those grasslands of Kazakhstan are now facing ecological problems such as biodiversity loss and productivity reduction (Li et al., 2015; Wu et al., 2018).
The changes in grazing patterns, the occupation of agricultural reclamation lands, and the effects of climate change due to warming and drying have given the changes in spatio-temporal patterns of various grassland ecosystem in Kazakhstan distinct characteristics. Therefore, as an important country along the “Belt and Road”, ecological changes (Luo et al., 2017) and desertification (Zhang et al., 2018) of the grasslands in Kazakhstan and central Asia have attracted increasing attention from researchers.
For animal husbandry production activities, grassland utilization and consumption represent the key elements of grassland ecosystems. When this rate of extraction exceeds the rate of replenishment, the capital of the ecosystem itself gradually shrinks. Therefore, a quantitative evaluation method is needed to measure the balance between ecosystem supply and consumption, and then to measure the carrying capacity of the ecosystem for human activities and the current carrying status. At present, the mainstream evaluation methods for carrying capacity have their own emphases. For example, the energy value analysis method focuses on unifying various natural resources and social resources into the same evaluation standard, and comprehensively analyzes the utilization status of the various resources. The ecological footprint law focuses on the space problem of sustainable human survival from the perspective of “ecological occupation”. In 2004, Imhoff et al. (2004) published a study on the net human primary productivity of terrestrial ecosystems in the journal Nature, in which the ecological supply capacity was measured by Net Primary Production (NPP). Determining human consumption of the ecosystem productivity supply by NPP, by exploring the support capacity and self- sustainability of ecosystems for human production and life, became one of the main methods for ecological assessment of regional sustainable development (Haberl et al., 2007; Yan et al., 2012 ;Du et al., 2018), and it gradually developed into an important method for assessing ecological carrying capacity (Zhao et al., 2004; Zhang et al., 2018). This method differs from the traditional methods of ecological footprint, energy analysis and material flow analysis in that this assessment method based on supply and consumption balance is more focused on finding a sustainable ecological threshold, while NPP is directly observable by remote sensing. It also uses estimated indicators, so “NPP consumption” becomes an indicator of ecosystem consumption that can both represent the human occupation of the ecosystem and reflect its spatial pattern. Remote sensing data are used to estimate the supply of grassland resources. Statistical data are used to calculate the consumption of grassland resources by animal husbandry. Then the balance of the grassland ecosystem is judged by the important means of grassland balance, which is calculated by the balance of grassland supply and consumption (Smart et al., 2010; Zhang et al., 2017; Lu et al., 2018).
Based on the supply and consumption of NPP, this study uses the statistics of animal husbandry to estimate the changes in the pattern of grassland resource consumption in each year, analyzes the spatial patterns and historical evolution of grassland consumption in Kazakhstan, and uses the net primary productivity of vegetation for many years as a measure grassland resources. The carrying capacity of the grassland ecosystem was evaluated from three dimensions: grassland resource supply, consumption and the human-land relationship, in order to understand the current status, the causes of the current grassland carrying status in Kazakhstan, and the corresponding effects on grassland ecosystems of climate change and human activities.

2 Data and methods

2.1 Study area and data sources

2.1.1 Study area
Located in the hinterland of Eurasia, Kazakhstan covers an area of 2.275×10⁶ km2 and is one of the largest inland countries in the world. The grassland area of Kazakhstan is about 184 million ha, accounting for 67.53% (Zhang et al., 2013) of the total land area, and for 73.60% (Abuduwaili et al., 2015) of the grassland area in Central Asia. The grassland in Kazakhstan transitions from a typical grassland to a semi- desert and desert steppe from north to south. The annual precipitation in the typical steppe zone and semi-desert zone is only about 200 mm, and the annual precipitation in the desert zone is less than 100 mm. The climate is a typical continental dry climate. From north to south, the climate transitions from a grassland zone, to a semi-desert zone and then to a desert zone (Robinson et al., 2002).
2.1.2 Data sources
The data used in this study included grassland distribution, grassland ecosystem NPP and animal husbandry statistics. The NPP data are based on the 2000-2016 Gross Primary Production (GPP) data developed by Zhang et al. (Zhang et al., 2017) through the Vegetation Photosynthesis Model (VPM), and the NPP data calculated by the autotrophic respiration ratio. The spatial resolution is 500 m and the time resolution is 8 days. After pre-processing including data downloading and splicing, the total amount of NPP per year is calculated, the conical projection of the positive axis is added to obtain the area statistics, and the data unit is converted to gC m-2 yr-1.
Statistical data on livestock distribution in Kazakhstan come from the Ministry of National Economy of the Republic of Kazakhstan Statistics Committee (website: www.stat. gov.kz), which mainly includes the number of livestock for the first-level administrative regions of Kazakhstan, including cattle, horses, goats, sheep, donkeys and camels. The unit is in thousands of animals. The land cover classification data are derived from the 2015 ESACCI-LC land use data produced by the European Space Agency’s Climate Change Initiative. The data are based on the FAO/UNEP Land Cover Classification System (LCCS) with a spatial resolution of 300 m (Fig. 1) (Li et al., 2016). The data set extracted in this study included the entire grassland range (grassland numbers 110 and 130, and sparse vegetation numbers 150 and 153).
Fig. 1 Spectrum of grassland distribution in Kazakhstan in 2015

2.2 Method

From the perspectives of supply and consumption, at the supply end, the net primary productivity data of vegetation are used as the basic data for estimating grassland supply, and the abundant net primary productivity (SNPP) is estimated as stocking capacity by using NPP and land use data over many years. The animal husbandry statistics are used as the basic data for estimating grassland consumption at the consumption end, and the livestock consumption data (Consumed Net Primary Productivity, CNPP) are estimated as the actual stocking capacity. The ratio of SNPP and CNPP is grassland carrying state index (GCSI).
2.2.1 Grassland resource consumption
In order to facilitate the calculation of grassland resource consumption, this study uses conversion factors to convert all types of livestock (cattle, horses, donkey, camel, goats, sheep, etc.) into standard sheep units. The conversion factors for various animals refer to the natural quantities in the agricultural industry standard of the People's Republic of China, calculating the reasonable stocking capacity of grassland (Ministry of Agriculture, 2015), and obtaining the conversion factor based on the medium-sized body weights of various livestock. For example, for cattle, the average of the medium-weight weighting factors for yellow cattle, buffalo, and yak was obtained. The factors for conversion of various types of livestock into standard sheep units are shown in Table 1.
Table 1 Conversion coefficient table for standard sheep units
Livestock type Sheep Goat Cattle Horse Donkey Camel
Conversion
factor
1 0.8 6 5.5 3 8.5
The Number of Standard Sheep Units (NSSU) is converted according to the above conversion factors, as:
$NSSU=\underset{i=1}{\overset{n}{\mathop \sum }}\,{{N}_{i}}\times {{\varepsilon }_{i}}$
where i represents the type of livestock; n represents the number of livestock species, Ni represents the number of livestock types (head); and εi is the standard sheep conversion factor for specific animals. Using NSSU, grassland resource consumption can be estimated by parameters such as the amount of grass needed and the number of herbivores (Lu et al. 2018).
$\begin{align} & CNPP=NSS{{U}_{e}}\times GW\times G{{D}_{e}}\times (1-MC)\times FC\times 1000+ \\ & \ \ \ \ (NSS{{U}_{m}}-NSS{{U}_{e}})\times GW\times G{{D}_{o}}\times (1-MC)\times FC \\ \end{align}$
where CNPP stands for grassland resource consumption (gC); NSSUm and NSSUe represent the number of standard sheep units in the middle and end of the year (head); GW represents the weight of edible hay (kg d-1), set to 1.8 kg d-1 in this study (Liu et al. 2014); GDe and Gdo indicate the number of herbage days (days) for stocking livestock and slaughter animals. In this study, these were set to 365 days (184 days in growing season) and 180 days (growth season 61 days), respectively; MC indicates the moisture content of wind hay. Although most of the water has been removed from the hay, there is still water adsorbed in the protein and starch, so a value of 14% is used in this study (see Liu et al., 2014; Lai et al., 2008; Lobell et al., 2002); FC stands for the conversion coefficient of biomass and carbon content (gC g-1), and the value used in this study is 0.45 (Fan et al., 2008; Piao et al., 2007).
2.2.2 Supply of grassland resources
Based on the spatial superposition analysis of the NPP multi- year average calculated from the VPM model for 2000- 2016 and the grassland distribution data, the total NPP of the grassland ecosystem was calculated and recorded as NPPg. Among its components, the part available for livestock production (ANPPg) is calculated by the following formula:
ANPPg = β × NPPg
where β represents the grassland supply factor available for livestock use. According to R. B. Jackson et al.’s assessment of plant rooting density and its proportion (Jackson et al., 1996), the ratio of grassland biomass to total biomass is 21%, so the beta value is set to 0.21 in this study. In order to calculate the statistics and conduct the analysis based on administrative units, the sum of the net primary productivity of ANPPg that is available in the grasslands of each administrative region is obtained as:
$SNPPg\text{ }=\sum{ANPPg}\text{ }\times \text{ }{{\gamma }^{2}}$
where γ is the spatial resolution of ANPPg (m); and SNPPg is the sum of the net primary productivity of grassland available in each administrative region (gC yr-1). In this study, SNPPg is used as the total supply of grassland resources SNPP, namely:
SNPP = SNPPg
2.2.3 Grassland carrying pressure
The Grassland Carrying State (GCS) uses the Grassland Carrying State Index (GCSI) as an indicator, which is calculated as follows:
$GCSI=CNPP/SNPP$
where GCSI is the grassland carrying status index; and CNPP is the livestock production consumption (g C yr-1). When the consumption is lower than the amount of the supply, the grassland carrying capacity is in a surplus state; when the consumption is higher than the supply, the grassland is in an overload state. In order to qualitatively analyze the grassland carrying status of each area and evaluate their differences, refer to Feng et al. (2008, 2014) for the classification scheme of China’s land resource carrying capacity, and divide the grassland carrying status according to the grassland bearing capacity supply and surplus level, for both surplus and overload status. In order to determine the differences in grassland carrying status in various areas of Kazakhstan, this study divides the grassland carrying status index into different levels at intervals of 0.2, which yields six levels of: rich and surplus, surplus, balance, critical overload, overload and severe overload (Table 2).

3 Results and analysis

3.1 Structure and changes of grassland animal husbandry in Kazakhstan

In 2017, the proportions of standard sheep units of the different livestock in various states of Kazakhstan reflect the different characteristics of the regions. The main livestock of Kazakhstan (goats and sheep, cattle, horses, camels, etc.) have balanced spatial distributions and certain proportions in all regions of the country. Ten of the 14 states in Kazakhstan are dominated by cattle, sheep and goats. The proportion of these two livestock types accounts for more than 75% of the entire region. The horses are distributed throughout Kazakhstan and the proportions in each region are similar. Camels account for only a small proportion in the north and east, and this type is more common in the southwestern regions of Aktube, Kyzylorda, Atyrau and Mangghsystau, especially in Mangghsystau where the proportion is 37.46%.
From 2003 to 2017, the total number of livestock in Kazakhstan increased from approximately 49.151 million sheep units in 2000 to approximately 75.391 million sheep units in 2017, representing a growth rate of 52.26% and an average annual growth of approximately 1.848 million sheep units. However, the number of livestock in Kazakhstan has not grown continuously, but it has shown fluctuations. It rose steadily before 2011, but in 2011, due to freezing damage, the number of sheep units was reduced by 3.8% compared with the previous year. After 2011, the number of sheep units began to increase again, and there has been a clear and steady increasing trend.
Table 2 Classification standard table for grassland carrying state
Grassland carrying state index <0.6 0.6-0.8 0.8-1.0 1.0-1.2 1.2-1.4 >1.4
Grassland carrying state Rich and surplus Surplus Balance Critical overload Overload Severe overload
Fig. 2 Spatial distribution (a)and change trends in the number of sheep units in various states of Kazakhstana(b)

3.2 Spatial pattern of grassland supply and

consumption in Kazakhstan

The spatial pattern of Kazakhstan's supply capacity is mainly influenced by the western belt and terrain. The mountainous area in the southeastern part of the country is rich in precipitation due to the influence of the westerly wind and the cold air in winter. The supply of grassland decreases from the southeast to the north. The grassland supply in the Kalba Mountain in eastern Kazakhstan is as high as 164.63 gC m-2 yr-1. The supply of grassland is affected by terrain, and is lower in desert areas. The average annual supply of grassland resources in Kazakhstan is 5.07×10¹³ gC. From 2000 to 2016, the supply of grassland resources per unit area showed a volatile growth trend between 25.25 gC m-2 yr-1 and 45.42 gC m-2 yr-1, and the low-est year was 44.41% below the average. The highest year was 46.55% higher than the average grassland supply capacity.
During 2003-2017, the consumption of NPP (CNPP) in Kazakhstan showed a trend of continuous growth. The consumption of grassland was almost always on the rise. One exception was 2010, when a large number of livestock died due to meteorological disasters, which caused a decline in grassland consumption. CNPP increased from 9.38×10¹² g C yr-1 in 2003 to 1.431×10¹³ g C yr-1 in 2017, an increase of 52.56%. The grassland consumption showed a clear upward trend, but it was always much smaller than the grassland supply. The grassland consumption in Kazakhstan has always accounted for less than 30% of the grassland supply. During 2003-2017, the total grassland consumption in East Kazakhstan, South Kazakhstan and Almaty was significantly higher than that in the other 11 states. In 2010 and 2011, 12 states were affected by meteorological disasters. The reduction of grassland consumption occurred to different degrees, and North Kazakhstan, Akmola, Aktube and Kostanay were more strongly affected by extreme climatic conditions, and grassland consumption in those areas were lower than the levels of 2010. The observed decreases of 20.44%, 11.70%, 17.32% and 28.03%, respectively, in grassland consumption were mainly due to the decrease in the number of cattle, sheep, and especially goats and sheep.
Fig. 3 Spatial pattern (a) and change trends of Kazakhstan’s supply capacity (b)
Fig. 4 Spatial pattern (a) and change trends of grassland consumption in Kazakhstan (b)

3.3 Spatial distribution and change trend of grassland carrying status in Kazakhstan

During 2003-2017, the grassland carrying index (GCSI) of Kazakhstan increased significantly (R2=0.996), and the GCSI rose from 0.18 in 2003 to 0.28 in 2017, an increase of 10%. Although the grassland carrying pressure is increasing, the overall pressure is still lower, and it has been in a state of rich and surplus.
Fig. 5 Kazakhstan SNPP, CNPP, GCSI trends during 2003- 2017.
In 2003, the pressure on grassland carrying capacity in the 13 states of Kazakhstan was characterized as rich and surplus, and only the southern Kazakhstan state was in surplus. By 2008, the grassland ecological pressure in Kazakhstan had further increased. The North Kazakhstan and Kyzylorda states had been downgraded to surplus status, and the grassland carrying pressure in South Kazakhstan was reduced to a balanced state. From 2008-2013, due to the reduction of the number of livestock caused by the extreme weather, the growing pressure on the grassland in Kazakhstan had slowed down to some extent, and the state of North Kazakhstan changed from a surplus state to a rich state. However, during 2013-2017, grassland carrying pressure continued to increase, and grassland ecological pressure in South Kazakhstan reached a state of critical overload. North Kazakhstan and Kyzylorda were in surplus and balance, and critical overload areas were concentrated in cultivated land areas of South Kazakhstan, and gradually incorporated the agro-pastoral zone and semi-desert zone.
The grassland carrying pressure in Kazakhstan has shown an increasing trend. The number of rich and surplus areas has been reduced from 13 in 2003 to 11 in 2017, and the critical overload areas have mainly appeared after 2012. The greater grassland ecological pressure in Kyzylorda is due to the scarcity of grasslands, low productivity and relatively high grazing intensity. The huge grassland carrying pressure in South Kazakhstan is mainly due to the increasing grazing intensity, which threatens to overload the grassland carrying pressure.
Fig. 6 Spatial distribution of grassland carrying pressure in various states of Kazakhstan in (a) 2003, (b) 2008, (c) 2013, and (d) 2017.
Fig. 7 Trends in grassland carrying pressures in various states of Kazakhstan, 2003-2017.

4 Discussion

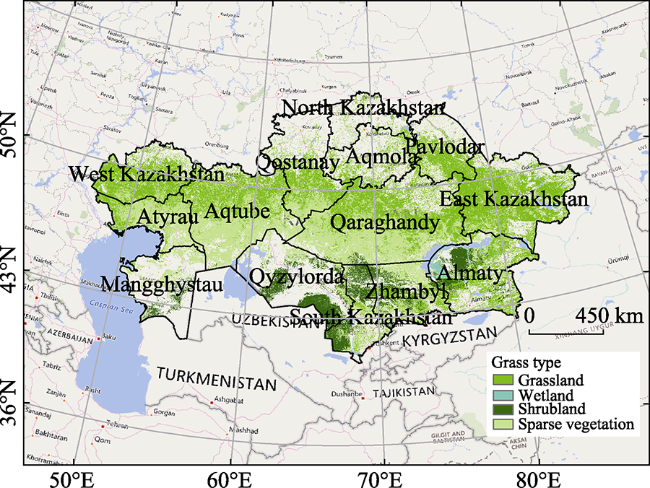
From 1941 to 2011, the temperature in Kazakhstan showed an increasing trend, while the annual precipitation showed a downward trend, so the climate became warmer and drier (Beurs et al., 2003; Bolch, 2006; Eisfelder et al., 2014). Many researchers have found that vegetation growth has a strong correlation with precipitation (Chen et al., 2013; Propastin et al., 2007). Although the precipitation time scale is reduced, Jiang's research (Jiang et al., 2017) shows that the vegetation in eastern Kazakhstan has an increasing trend. The trends of productivity fluctuations coincide with the volatility of Kazakhstan's supply capacity during 2000-2016 (
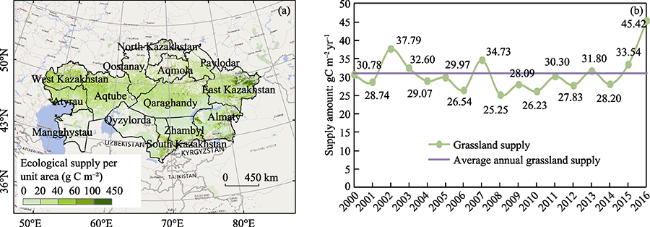
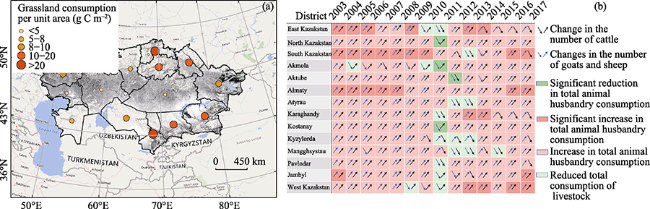
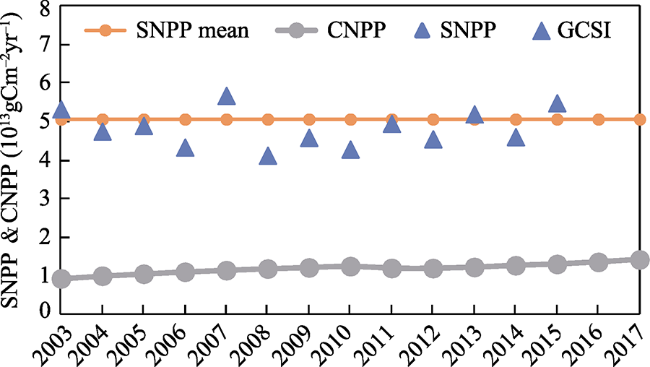
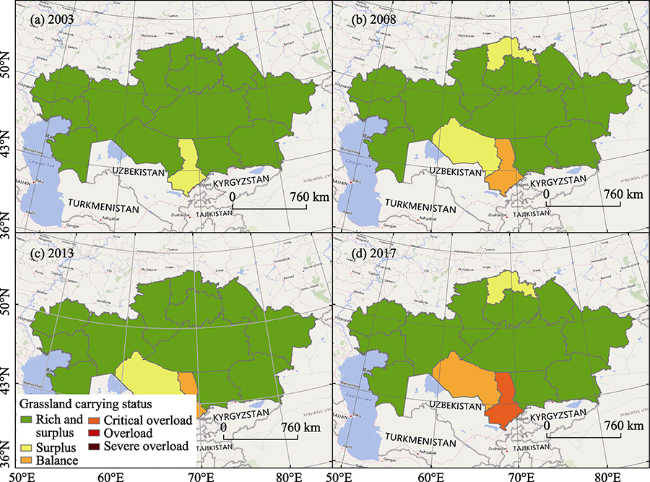
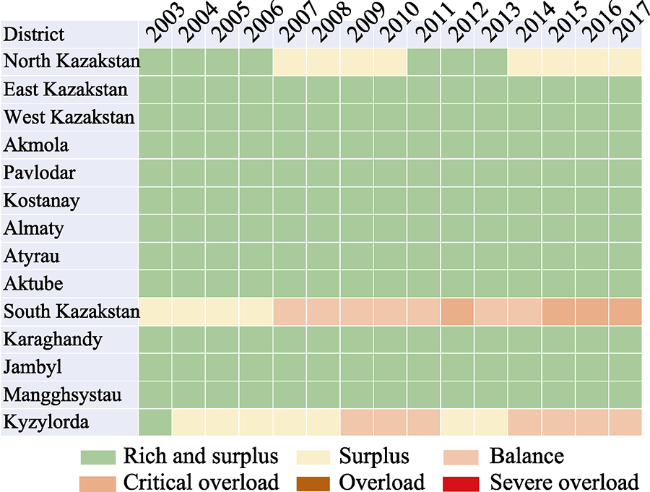
Luo et al., 2017). The ecological carrying capacity has been increasing, but the ecological carrying status has always been rich and surplus. We think the reasons are as follows. On the one hand, because only a small amount of feed used by livestock takes up part of the ecological supply of the farmland ecosystem, there is a certain amount of error. On the other hand, compensating for the low level of labor production in Kazakhstan requires a large amount of imported meat, such as beef and horse meat (Balabaykin et al., 2015), which consumes supply resources from other regions and reduces the ecological carrying pressure to a certain extent. As early as 1930, about 80% of the livestock died due to the government's mandatory collective ownership policy; and after that incident, nomadic settlements accounted for only a small part of nomadic existence (
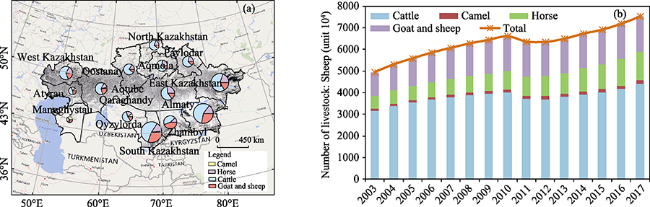
Olcott, 1995). After the collapse of the Soviet Union, most of the herders were restricted to grazing only near their settlements, resulting in plaque-like degradation in local areas (Abuduwaili et al., 2015), and the number of livestock declined sharply. After 1991, livestock production was mainly transferred from corporate farms to individually- and family-owned farms (International, 2013). After 2000, in response to policy reforms and government support for agriculture, Kazakhstan’s crop and livestock production began to recover (Nora et al., 2007;International, 2013), and the Kazakhstan government implemented agricultural diversification to support animal husbandry production, including the development of livestock feed bases. Due to local natural conditions and technical capabilities, despite a certain degree of recovery after 2000, it is still difficult to deal with the serious natural disasters that occur in this country. After research by Alimaey and collaborators (Alimaev et al., 2008) confirmed that seasonal rotational grazing can make more rational and efficient use of pasture resources, the government has formulated some policies to implement seasonal rotational grazing in order to reduce the increasing ecological pressure.
This study takes Kazakhstan grasslands as the research object, applies large-scale remote sensing models and statistical data, and describes the grassland carrying status of each region of the country. By comparing the ecological supply-consumption relationship, we analyze the nature, policies, etc. leading to the formation of ecological load pressure patterns and laws. The possible causes of these patterns provide a basis for understanding the balance of grass and livestock in various regions of Kazakhstan and the relationship between people and the land. The discussion in this paper is an assessment of the supply capacity and current consumption patterns of local natural grassland resources, and is the basis for analyzing local grassland development and the replenishment needs of remote resources. The regional grassland carrying status is a complex phenomenon formed under the influence of many factors such as the economy, policies and the natural environment. Resources co-exist between different ecosystems in the same region (cultivated land, etc.) and flow between different regions (cross-regional pasture trading, etc.). Building on the base of this research, we can further analyze the grassland resource feeding process caused by grassland heterogeneity and the grassland resource flow process brought on by ecosystem externality, in order to more accurately grasp the grassland carrying capacity achieved through local resource endowment.

5 Conclusions

Based on the balance between the supply and consumption of grassland ecosystems, the structure and scale of animal husbandry in Kazakhstan, the grassland resource consumption caused by animal husbandry and the pressure on the supply capacity of grassland resources, the carrying status of the grassland ecosystem in Kazakhstan was assessed for 2003-2017. The study results show that:
(1) The number of livestock in Kazakhstan has increased from about 4.99×10⁷ sheep units in 2000 to about 75,391,100 sheep units in 2017. The main livestock (sheep and goats, cattle, horses, camels, etc.) have a balanced spatial distribution, with a certain proportion of the distribution found in all regions of the country. Ten of the 14 states in Kazakhstan are dominated by cattle, goats and sheep. The proportion of these two livestock types accounts for more than 75% of the entire region. The horses are distributed throughout Kazakhstan and the proportions are similar. Camels account for less in the north and east, and more in the southwest.
(2) The average annual supply of grassland resources in Kazakhstan is 5.07×10¹³ gC, the lowest year was 44.41% below the average, and the highest year was 46.55% higher than the average grassland supply capacity.During 2003- 2017, the grassland resource consumption in Kazakhstan continued to increase, with an overall increase of 52.56%. The total grassland consumption in East Kazakhstan, South Kazakhstan and Almaty was significantly higher than that of the other 11 states. The growing grassland consumption has always been less than the grassland supply, accounting for less than 30% of the grassland supply.
(3) During 2003-2017, although the grassland carrying pressure in Kazakhstan has increased, the overall pressure is still relatively small and it has remained in a state of richness and surplus. From 2003-2017, the number of wealthy areas decreased from 13 to 11, and the critical overload areas mainly appeared after 2012. The areas with high grassland carrying pressure are mainly located in Kizils Odal, where grassland productivity is low, and in South Kazakhstan and Northern Kazakhstan, where cultivated land is centralized, but the high-pressure areas have gradually expanded into the agro-pastoral zone and semi-desert zone.
1
Abuduwaili G, Ma L. 2015. Introduction to Central Asia Environment. Meteorological Press.

DOI PMID

2
Alimaev I I, Zhambakin A, Pryanoshnikov S N . 1986. Rangeland farming in Kazakhstan. Problems of Desert Development, 3:14-19.

3
Alimaev I I, Kerven C, Torekhanov A , et al. 2008. The impact of livestock grazing on soils and vegetation around settlements in southeast Kazakhstan. In: NATO Advanced Research Workshop on the Socio- Economic Causes and Consequences of Desertification in Central Asia.

4
Balabaykin V, Korabayev B, Elkin K . 2015. Necessary conditions for import substitution of agricultural production in the Republic of Kazakhstan. Russian Agricultural Economy, 11:99-104. (in Russia)

5
Beurs KMd, Henebry G M . 2003. Land surface phenology, climatic variation, and institutional change: Analyzing agricultural land cover change in Kazakhstan. Remote Sensing of Environment, 89(4):497-509.

DOI

6
Bolch T . 2006. Climate change and glacier retreat in northern Tien Shan (Kazakhstan/Kyrgyzstan) using remote sensing data. Global and Planetary Change, 56(1):1-12.

DOI

7
Chen X, Bai J, Li X , et al. 2013. Changes in land use/land cover and ecosystem services in Central Asia during1990-2009. Current Opinion in Environmental Sustainability, 5(1):116-127.

DOI

8
Du W P, Yan H M, Yang Y Z , et al. 2018. Assessment method and research trend of ecological carrying capacity. Journal of Resources and Ecology, 9(2):115-124.

DOI

9
Eisfelder C, Klein I, Niklaus M , et al. 2014. Net primary productivity in Kazakhstan, its spatio-temporal patterns and relation to meteorological variables. Journal of Arid Environments, 103:17-30.

DOI

10
Fan B B, Luo G P, Hu Z Y , et al. 2012. Analysis of land resource development and utilization in Central Asia. Arid Region Geography, 35(6):928-937. (in Chinese)

DOI PMID

11
Fan J W, Zhong H P, Harris W , et al. 2008. Carbon storage in the grasslands of China based on field measurements of above- and below-ground biomass. Climatic Change, 86(3-4):375-396.

DOI

12
Feng Z M, Yang Y Z, You Z . 2014. Research on the limitation and limitation of land resources in China’s population distribution. Geography Research, 33(8):1395-1405. (in Chinese)

13
Feng Z M, Yang Y Z, Zhang J . 2008. Research on the bearing capacity of land resources based on human food relations in China: From county to country. Journal of Natural Resources, 23(5):865-875. (in Chinese)

DOI

14
Haberl H, Erb K H, Krausmann F , et al. 2007. Quantifying and mapping the human appropriation of net primary production in earth’s terrestrial ecosystems. Proceedings of the National Academy of Sciences of the USA, 104(31):12942-12947.

DOI PMID

15
International C . 2013. OECD Review of Agricultural Policies: Kazakhstan 2013. Oecd Review of Agricultural Policies Kazakhstan.

16
Jackson R B, Canadell J, Ehleringer J R , et al. 1996. A global analysis of root distributions for terrestrial biomes. Oecologia, 108(3):389-411.

DOI PMID

17
Jiang L L, Jiapaer G, Bao A M , et al. 2017. Vegetation dynamics and responses to climate change and human activities in Central Asia. Science of the Total Environment, 599-600:967-980.

DOI PMID

18
Kraemer R, Prishchepov A V, Muller D , et al. 2015. Long-term agricultural land-cover change and potential for cropland expansion in the former Virgin Lands area of Kazakhstan. Environmental Research Letters, 10(5):054012.

DOI

19
Lai Q, Li Q F, Mo Rigen , et al. 2008. Determination of water content of grassland pasture and estimation method of dry and fresh ratio Inner Mongolia. Grass Industry, 3:4-7. (in Chinese)

20
Imhoff M L, Bounoua L, Ricketts T , et al. 2004. Global patterns in human consumption of net primary production. Nature, 429(6994):870-873.

DOI PMID

21
Li W, Ciais P, MacBean N , et al. 2016. Major forest changes and land cover transitions based on plant functional types derived from the ESA CCI Land Cover product. International Journal of Applied Earth Observations and Geoinformation, 47:30-39.

DOI

22
Li Y H, Hou X Y, Dai Y T , et al. 2015. The Developmental Role and Strategic Needs of the Prairie Silk Road in the “Belt and Road” Economic Belt from the Perspective of Ecological Environment. The 11th China Soft Science Academic Annual Meeting, Beijing, China. (in Chinese)

23
Liu X Y, Zhao G W . 2014. Discussion on issues related to reasonable stocking capacity of natural grassland. Xinjiang Animal Husbandry, ( 10):62-63. (in Chinese)

24
Lobell D B, Hicke J A, Asner G P , et al. 2002. Satellite estimates of productivity and light use efficiency in United States agriculture, 1982-98 Global Change Biology, 8(8):722-735.

25
Luo L, Du W P, Yan H M , et al. 2017. Space-temporal patterns of vegetation changes in Kazakhstan from 1982 to 2015. Journal of Resources and Ecology, 8(4):378-384.

DOI

26
Lu X, Wang J L, Kang H J , et al. 2018. Balance analysis of grass and livestock in Qinghai Guoluo and Yushu areas from 2006 to 2015 based on remote sensing estimation. Journal of Natural Resources, 33(10):1821-1832. (in Chinese)

DOI

27
Ministry of Agriculture of the People’s Republic of China. 2015. NY/T 635-2015 Calculation of Reasonable Stocking Capacity of Natural Grassland. Beijing: China Standard Press. (in Chinese)

28
Nora D, Karin F, David S . 2007. Land Reform and Farm Restructuring in Transition Countries: The Experience of Bulgaria, Moldova, Azerbaijan, and Kazakhstan. World Bank Publications.

29
Olcott M. 1995. The Kazakhs. Stanford, USA: Hoover Institution Press.

30
Piao S L, Fang J Y, Zhou L M , et al. 2007. Changes in biomass carbon stocks in China’s grasslands between 1982 and 1999. Global Biogeochemical Cycles, 21(2): GB2002.

31
Propastin P A, Kappas M, Erasmi S , et al. 2007. Assessment of desertification risk in Central Asia and Kazakhstan using NOAA AVHRR NDVI and precipitation data. Current Remote Sensing of Earth from Outer Space, 4(2):304-313. (in Russia)

32
Robinson S, Milner-Gulland EJ, Alimaev I . 2002. Rangeland degradation in Kazakhstan during the Soviet era: Re-examining the evidence. Journal of Arid Environments, 53(3):419-439.

DOI

33
Salnikov V, Turulina G, Polyakova S , et al. 2015. Climate change in Kazakhstan during the past 70 years. Quaternary International, 358:77-82.

DOI

34
Smart A J, Derner J D, Hendrickson J R , et al. 2010. Effects of grazing pressure on efficiency of grazing on North American Great Plains Rangelands. Rangeland Ecology & Management, 63(4):379-406.

DOI PMID

35
Wu S H, Liu L L, Liu Y H , et al. 2018. The “One Belt and One Road” land geographic pattern and environmental change risk. Geographical Journal, 73(7):1214-1225. (in Chinese)

36
Yan H M, Liu J Y, Huang H Q , et al. 2012. Impacts of urbanization and conversion of cropland to forest and grassland on China’s arable land productivity. Journal of Geographical Sciences, 67(5):579-588. (in Chinese)

37
Zhang F P, Wang H W, Zhu Y W , et al. 2017. Study on aboveground biomass and grassland balance in natural grassland in Qilian County, China. Journal of Natural Resources, 32(7):1183-1192. (in Chinese)

38
Zhang G, Biradar CM, Xiao X , et al. 2018. Exacerbated grassland degradation and desertification in Central Asia during 2000-2014. Ecological Applications, 28(2):442-456.

DOI PMID

39
Zhang L P, Li X S, Lan J Y , et al. 2013. Status and protection of grassland resources in Kazakhstan. Herbivores, 3:64-67. (in Chinese)

40
Zhang Y, Xiao X M, Wu X C , et al. 2017. A global moderate resolution dataset of gross primary production of vegetation for 2000-2016. Scientific data, 4:170165.

DOI PMID

41
Zhang Y Z, Wang Y Q, Yang Y , et al. 2018. Quantitative study on spatial and temporal distribution of grassland degradation degree in Mongolian Plateau. Grass Science, 35(2):233-243. (in Chinese)

42
Zhao H L, Zhao X Y, Zhou R L , et al. 2004. Desertification processes due to heavy grazing in sandy rangeland, Inner Mongolia. Journal of Arid Environments, 62(2):309-319.

DOI

43
Zhao W Y, Li J L, Wei N H , et al. 2004. Development status and scientific research of the grass industry in Kazakhstan. China Grassland, 5:60-65. (in Chinese)

Outlines

/