Ecosystem Services

Consumption of Ecosystem Services in Laos

  • LIANG Yihang 1, 2 ,
  • ZHEN Lin , 1, 3, * ,
  • JIA Mengmeng 1, 3 ,
  • HU Yunfeng 1, 3 ,
  • ZHANG Changshun 1, 3 ,
  • LUO Qi 1, 3
Expand
  • 1. Institute of Geographic Sciences and Natural Resources Research, Chinese Academy of Sciences, Beijing 100101, China
  • 2. School of Earth Science and Resource, Chang’an University, Xi’an 710000, China;
  • 3. School of Resource and Environment, University of Chinese Academy of Sciences, Beijing 100049, China
ZHEN Lin, E-mail:

Received date: 2019-07-15

  Accepted date: 2019-09-12

  Online published: 2019-12-09

Supported by

The Strategic Priority Research Program of the Chinese Academy of Sciences(XDA20010202)

The National Key Research and Development Program of China(2016YFC0503700)

Copyright

Copyright reserved © 2019

Abstract

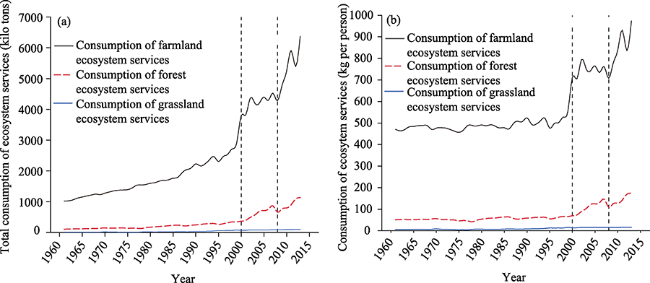
The exponential increase of ecosystem utilization has instigated a serious conflict between ecosystem services and residents’ needs. The Belt and Road Initiative has greatly influenced Laotian production and living, and the scientific assessment of the consumption of ecosystem services in Laos is important for exploring residents’ influence on the ecosystem. Based on data for the Laotian consumption of agricultural products, fruits and livestock products during 1961-2013, normalized by either harvest index or feed conversion ratio, this study draws three main conclusions. 1) Ecosystem service consumption in Laos is centered on the consumption of farmland, forestry and grassland ecosystem services, which account for over 80%, over 10% and under 2%, showing downward, upward and constant trends, respectively. The consumption of these ecosystem services shows a trend of increasing first, then fluctuating, and finally increasing. 2) The consumption of ecosystem services in Laos was characterized by the mode of “dominance of consumption of the farmland ecosystem services” from 1961 to 2008, and the mode of “balanced development of consumption of farmland, forest and grassland ecosystem services” from 2008 to 2013, with a trend of transformation from the former into the latter. 3) The formation and change in the consumption mode of Laotian ecosystem services have been affected by both supply and trade. Laos developed agriculture mainly during the period from 1961 to 2008, forming the mode of “dominance of consumption of the farmland ecosystem services”. This development benefited from the enriched varieties of imports as well as the increased value of trade and import volume. However, the consumption of ecosystem services in Laos after 2008 changed from the mode of “dominance of consumption of the farmland ecosystem services” to one of “balanced development of consumption of farmland, forest and grassland ecosystem services”. This study provides an empirical reference for research on the consumption of ecosystem services.

Cite this article

LIANG Yihang , ZHEN Lin , JIA Mengmeng , HU Yunfeng , ZHANG Changshun , LUO Qi . Consumption of Ecosystem Services in Laos[J]. Journal of Resources and Ecology, 2019 , 10(6) : 641 -648 . DOI: 10.5814/j.issn.1674-764X.2019.06.009

1 Introduction

Consumption of ecosystem services refers to the consumption, utilization and occupation of services provided by the ecosystem for human production or living, including manufactured products and offered services (Zhen et al., 2011). During the past 50 years, with the rapid improvement in the ability to utilize natural resources, the human impact on the ecosystem is 3.5 times more intense than that of 50 years ago, exceeding nature’s sustainable capacity by 20% (WWF, 2004). According to the Millennium Ecosystem Assessment (MA), human activities have led to the degradation of about 60% of the world’s ecosystems (MEA,2005), causing several major problems such as food shortages and the lack of water resources. Thus, the conflict of maintaining the balance between ecosystem services and human needs is increasingly escalating (Vitousek et al., 1997; Zhen et al., 2010a; Zhen et al., 2012; Du et al., 2018). The consumption of the specific products of ecosystem services serves is a direct way for human beings to consume various ecosystems (Zhen et al., 2012). Evaluation of this consumption is critical for exploring the extent of the human impact on the ecosystem, and it is academically important for further study of ecological restoration and the relationship between humans and the ecosystem.
Since Costanza conducted a global ecosystem service evaluation in 1997, scholars have successively studied the classification and value assessment of ecosystem services. Along with more specialized studies, scholars have gradually realized the significance of research on the consumption of ecosystem services. In general, the research on the consumption of ecosystem services is divided into three aspects: concept and structure research, modeling research and measurement research. In terms of consumption types and structures, in addition to direct and indirect consumption (Zhen et al., 2010b), scholars have defined consumption of supply services and consumption of regulation services for county territories and watersheds (Jiao et al., 2010; Yang et al., 2012), and they have also partitioned the consumption of production and living ecosystem services for the grassland ecosystem, exploring a series of consumption modes according to local conditions. As for modeling research, in a bid to reveal the process of consumption of ecosystem services, some scholars have carried out modeling research on the reasonable consumption of ecosystem services by taking the herdsman family as a unit (Pan et al., 2012). Some scholars also developed modeling analysis of water consumption of the hotel industry and found out that it still has a significant negative impact on the sustainable utilization of water resources (Tortella and Tirado, 2011). With respect to measurement research, most scholars have researched the consumption structure and ecological load capacity on the basis of the amounts of substances, after unifying dimensions such as value quantity, energy quantity or ecological footprint (Heller et al., 2003; Wiedmann et al., 2006; Mózner, 2014; Tilman et al., 2014; Aboussaleh et al., 2017; Galli et al., 2017). At present, research on the consumption of ecosystem services mainly focuses on the type, structure and quantity of various ecosystem services consumed, utilized and occupied by human production and living activities. Although many researchers have studied human-nature ecosystem interactions, there is still a lack of research on ecosystem service consumption that is quantified from the ecological perspective in many specific countries and regions due to the challenges in measurement index systems and data acquisition, which hinders the progress of relevant research in this field.
Promoted by economic globalization and regional integration, the global focus is shifting from Eurasia to the coastal areas of Asia and the Pacific (Hu and Lu 2016). With the proposal for deepening of the China-Indochina Peninsula Economic Corridor (CICPEC) under the Belt and Road Initiative, the resource value of the Indo-China Peninsula to China has become even more prominent (Qin and Cheng 2017; Qin et al., 2018). In Laos, one of the least developed countries in the world, the introduction of the Belt and Road Initiative has gradually improved the local economy and policies, which in turn has changed the consumption structure and quantity. Therefore, the objective analysis of the structure and quantitative scope of Laos' ecosystem consumption and the exploration of its changes and influencing factors can fill the gap in Laos’ relevant research to some extent. It can also provide a scientific basis and conceptual framework for the government to undertake management decisions that will make more rational use of the natural resources and improve ecosystem services efficiency.

2 Method

2.1 Study area

Laos is a landlocked country in the northern part of the Indo-China Peninsula with a total area of 2.37×10⁵ km2. It features a complex and diverse terrain, with mountains and plateaus accounting for 80% of its territory. Subject to the tropical and subtropical monsoon climate, Laos shows different climatic states in the rainy season and the dry season. During the rainy season, the average temperature is about 24.2℃, and the average precipitation is about 1300 mm in the plateaus and mountains and 1700 mm in the plains. During the dry season, the average temperature is 27.3℃, and rainy days are particularly rare. Influenced by topography and precipitation, Laos' land type is mainly forest land, making up 50% of the total land area; the arable land area is about 80000 km2, equal to 33.78% of the total land area; and grassland is rare (Ducourtieux et al., 2005; Thongmanivong and Fujita, 2006; Lund, 2011).
Having gained Independence in 1945, Laos comprises 17 provinces and 1 municipality, with a total population of 6.54 million, as well as a low population density of less than 28 people km-2. As one of the least developed countries in the world, Laos possesses a weak industrial base, and its economic development mainly depends on agricultural production. With over 80% of the labor force engaging in agricultural work, agricultural production accounts for 50% of GDP, while GDP per capita is only US$ 2457. In addition, Laos is a multi-ethnic country with 49 ethnic groups in total, that are collectively known as the Lao ethnic group and mostly embraces Buddhism (Fane, 2006; Menon and Warr, 2013).
The analysis and calculation of data from the Statistical Yearbook of Laos suggests that, as affected by the land type and economic development, Laos’ principal ecosystem support function type is the farmland ecosystem. This ecosystem provides local residents with agricultural products such as rice, maize, wheat, potato, sugar cane, bean, peanut, sesame and vegetables, along with livestock products including eggs, pork, and poultry fed with agricultural auxiliary products; and it is followed by the forestry ecosystem, providing oranges, bananas, pineapples and other fruits; and finally the grassland ecosystem, offering cattle products such as beef and milk.

2.2 Data sources and analysis methods

To measure the consumption of ecosystem services, this study calculated the actual consumption and used the harvest index or the feed conversion ratio to obtain the ecological consumption of products from diversified ecosystem services by residents and livestock. Among them, the products provided by farmland ecosystems are mainly used by residents and livestock; the products provided by forest ecosystems are mainly used by residents; and the products provided by grassland ecosystems are mainly used for livestock.
The consumption of products from farmland ecosystem services by residents and livestock (hereafter referred to as “consumption of farmland ecosystem services”) is expressed using the formula:
${{C}_{a}}={{m}_{i}}/H{{I}_{i}}+{{m}_{j}}\times FCR$
The consumption of products from forest ecosystem services by residents (hereafter referred to as “consumption of forest ecosystem services”) is expressed using the formula:
${{C}_{b}}={{m}_{k}}/H{{I}_{k}}$
The consumption of products from grassland ecosystem services by livestock (hereafter referred to as “consumption of grassland ecosystem services”) is expressed using the formula:
${{C}_{c}}={{m}_{l}}\times FCR$
In these three equations, Ca represents the consumption of farmland ecosystem services, i agricultural products, mi the actual consumption of agricultural products by residents, and HIi the harvest index of agricultural products; j represents the variety of grain-fed livestock products, mj the actual consumption of grain-fed livestock products by residents, and $FCR$ the feed conversion ratio (reflecting the mass of ecosystem-provided products consumed by livestock while gaining 1 kilogram of weight). Cb represents the consumption of forest ecosystem services, k the variety of fruits, mk the actual consumption of fruits by residents and HIk the harvest index of the fruits. Cc represents the consumption of grassland ecosystem services, l the variety of grass-fed livestock products, ml the actual consumption of grass-fed livestock products by residents and FCR is defined as above.
The data for Laotian consumption of agricultural products (rice, maize, wheat, potato, sugar cane, bean, peanut, sesame and vegetables), fruits (orange, banana, pineapple and mango) and livestock products (beef, pork, poultry, milk and eggs) accumulated during 1961-2013 and used in this study are derived from statistics of the Food and Agriculture Organization of the United Nations (http://www.fao.org). Data on the Laotian population size are from the World Bank (https://www.shihang.org) statistics, and Laotian import and export trade data are from the United Nations Commodity Trade Statistics Database (https://comtrade.un.org/). The harvest index and feed conversion ratio values (see Table 1) refer to those published in the literature.

3 Results

3.1 Characteristics and variations of the consumption of ecosystem services

The trends of total consumption and per capita consumption of ecosystem services in Laos from 1961 to 2013 (Fig. 1) show that there have been three stages: a slow growth phase in 1961-2000, a fluctuation phase in 2000-2008 and a rapid growth phase in 2008-2013.
Fig. 1 Variation of Laos’ total consumption and per capita consumption of ecosystem services during 1961-2013
In the first stage, structurally, the consumption of farmland ecosystem services accounted for the largest share with 88.46%, followed by the consumption of forestry ecosystem services with 10.04% and the consumption of grassland ecosystem services with only 1.5%. Quantitatively, the total consumption of farmland ecosystem services increased slowly from 1021 kilotons in 1961 to 3798 kilotons in 2000, with a growth rate of 71.21 kilotons yr-1, while the per capita consumption increased from 471 kg p-1 to 713 kg p-1, at a rate of 6.21 kg p-1 yr-1. The growth in the consumption of forestry and grassland ecosystem services was even slower than that of the farmland ecosystem. The total consumption and per capita consumption of forestry ecosystem services increased from 110 kilotons and 51 kg p-1 to 369 kilotons and 69 kg p-1, respectively, and the consumption of grassland ecosystem services increased from 13 kilotons and 6 kg p-1 to 71 kilotons and 13 kg p-1. The total consumption and per capita consumption of each of the three types of ecosystem services had a sudden increase during the 1998-2000 period.
Table 1 Crop and fruit harvest index and feed conversion ratio of livestock products
Crop type Harvest index* Livestock
products
Feed conversion ratio*
Rice 0.50 Beef 2 : 1
Maize 0.49 Pork 3 : 1
Wheat 0.46 Poultry 2 : 1
Potato 0.59 Milk 0.3 : 1
Other tubers 0.67 Egg 2.2 : 1
Sugar cane 0.70
Bean 0.42
Peanut 0.50
Sesame 0.34
Vegetables 0.49
Orange 0.49
Banana 0.49
Pineapple 0.49
Other fruits 0.49

*Sources: Parameters were derived from published literature (Guill and Washburn, 1973; Pierozan et al., 2016; Piao et al., 2009; Xie et al., 2011).

Note: a-total consumption of ecosystem services, b- consumption of ecosystem services per capita. The vertical dashed lines indicate the years separating the three phases of development.In the second stage, structurally, the consumption of farmland ecosystem services decreased, accounting for only 85.36%, while the consumption of forestry and grassland ecosystem services increased, accounting for 12.91% and 1.73% of the total consumption, respectively. Quantitatively, the consumption of farmland ecosystem services showed three fluctuations around 2002, 2005 and 2007. The total consumption of the farmland ecosystem exhibited an upward trend from 3798 kilotons in 2000 to 4277 kilotons in 2008, while the per capita consumption did not change as much, with the maximum reaching 795 kg p-1 in 2002. The total consumption and per capita consumption of forestry ecosystem services showed a trend of increasing first, from 369 kilotons and 73 kg p-1 in 2000 to 867 kilotons and 146 kg p-1 in 2007, but then decreasing down to 661 kilotons and 109 kg p-1. The total consumption of grassland ecosystem services increased, from 71 kilotons to 92 kilotons, with the per capita consumption fluctuating around 15 kg p-1.In the third stage, structurally, the consumption of farmland ecosystem services continued to decline, accounting for 84.21%, while the consumption of forestry ecosystem services continued to rise, accounting for 14.29%, and the consumption of grassland ecosystem services fell slightly, accounting for only 1.5%. Quantitatively, except for the slight decline in 2012, the total consumption and per capita consumption of the farmland ecosystem showed an overall rapid upward trend, increasing from 4277 kilotons and 707 kg p-1 in 2008 to 6374 kilotons and 974 kg p-1 in 2013, respectively; while the consumption of forestry and grassland ecosystem services did not decline but instead demonstrated rapid growth trends. Their total consumption increased from 661 kilotons and 92 kilotons to 1137 kilotons and 104 kilotons, respectively, and per capita consumption increased from 109 kg p-1 and 15 kg p-1 to 174 kg p-1 and 16 kg p-1, respectively.

3.2 Consumption mode of ecosystem services in Laos

The consumption mode of ecosystem services refers to the overall characteristics, behavioral norms and social public standards of selecting, combining and utilizing, either directly or indirectly, ecosystem-provided products and services by residents and livestock. It includes the consumption mode of ecosystem-provided products and the consumption mode of ecosystem-provided services by residents and livestock. Because data related to ecosystem-provided services is not accessible, this section only discusses the consumption mode of ecosystem-provided products by Laotian residents and livestock.Based on the consumption of Laotian ecosystem services, the ecological consumption can be divided into two modes: “dominance of consumption of the farmland ecosystem services” and “balanced development of consumption of farmland, forest and grassland ecosystem services”. From 1961 to 2008, consumption of ecosystem-provided products by Laotian residents and livestock mainly focused on agricultural products, and the consumption of farmland ecosystem services accounted for more than 85% of the total consumption, while that of forest and grassland ecosystem services combined accounted for less than 15%. In terms of quantity, the growth rate of the consumption of farmland ecosystem services was much higher than that of forest and grassland ecosystem services, leading to the mode of “dominance of consumption of the farmland ecosystem services” in Laos at this time. However, from 2008-2013, although residents and livestock still mainly consumed farmland ecosystem services, their overall proportion dropped below 85%, with a trend of continuing decline; while the proportion of forest and grassland ecosystem services rose to over 15%, with a trend of continuing increase. In terms of quantity, the consumption of farmland, forest and grassland ecosystem services increased substantially during 2008-2013, leading to the second mode of “balanced development of consumption of farmland, forest and grassland ecosystem services”.A comparison between the two modes found that Laotian ecological consumption has shown a tendency toward becoming more diversified, which reflects a more complicated food consumption structure of Laotian residents, a more reasonable livestock breeding portfolio and a gradual decline in the dependence on a single ecosystem by residents and livestock. Accordingly, the sustainability of ecosystem utilization has improved and the well-being of local residents has been enhanced to a certain extent.

4 Analysis

4.1 Impact of supply on consumption of ecosystem services

The exceptional natural resource advantage of Laos allows rice, maize and other crops to grow well with high total output. Rice is mainly distributed in areas with more arable land such as the provinces of Vientiane, Savannakhet, Saravan and Champasak in central and southern Laos. The total planting area of rice is 825500 ha, accounting for 85% of the national crop area, with a total output of 2.93 million tons. Meanwhile, maize is mainly planted in the provinces of Sayaboury and Louangphabang in northern Laos, and its total output is more than 600000 tons. The spatial distribution of crop planting shows that northern, central and southern Laos use their natural advantages to plant large quantities of crops, indicating that the consumption of products provided by the farmland ecosystem to residents and livestock is not restricted by geographical location. At the same time, in order to improve the well-being of local residents, the Laotian government has integrated agricultural development into the national strategy to eradicate poverty. By developing trading markets for agricultural products, enhancing technical proficiency in the cultivation of agricultural products, promoting the modernization of agricultural shares and other initiatives, the quantity and variety of products obtained from the farmland ecosystem by residents and livestock have progressively increased. In this case, the consumption and proportion of products provided by the farmland ecosystem to the Laotian residents and livestock accounted for a large proportion.In addition, Laos still continues the agricultural production mode of “cultivation by nomadic farmers”. Forest products provided by natural forests are mostly consumed in the form of energy burning, but, unfortunately, international organizations and the Laotian government offer no statistics on this consumption. In terms of products provided by economic forests, the output of oranges, bananas, pineapples and coconuts have increased constantly due to continuous improvements in local productivity and the lack of serious climatic changes, resulting in an increasing trend in the proportional consumption of the forest ecosystem.Moreover, buffaloes and cattle are raised by local residents mostly to relieve the human burden in agricultural production. Although they are fed on pastures, which has impacts on grassland ecosystem services, the consumption of grassland ecosystem services has increased slowly, with an almost stable consumption proportion due to their relatively small amounts.In summary, from the perspective of supply, Laos has been mainly engaged in the development of agriculture. The farmland ecosystem has provided the most basic material security for local residents and livestock. Therefore, the consumption of farmland ecosystem services has shown an increasing trend, with the consumption mode of ecosystem services focusing on consumption of farmland ecosystem services. In addition, due to the continuous improvement of productivity, both the consumption of forest ecosystem services and its proportion have also been increasing; while the consumption of grassland ecosystem services has been affected by the quantity of livestock, and its consumption and proportion have both become lower.

4.2 Impact of trade on consumption of ecosystem services

Laotian residents and livestock have become increasingly dependent on the importation of products provided by farmland and grassland ecosystems. According to the statistics of the United Nations Commodity Trade Statistics Database (https://comtrade.un.org/) and the Statistical Yearbook, from 2010 to 2016, the variety of imports of agricultural products in Laos increased by 78 (69.64%). In terms of trade value, total imports of agricultural products increased by US$ 245 million (107.93%), total imports of forest products by US$ 55.8 million (264.71%) and total imports of livestock products by US$ 62.1 million (224.95%). In terms of trade volume, from 2010 to 2016, the import volume of agricultural products showed an increasing trend, the export volume a decreasing trend, and the balance of trade was positive with a tendency of decreasing year by year. These trends indicate that during this time, the export volume was higher than the import volume and Laos became more and more dependent on the importing of agricultural products. In contrast, the import volume of livestock products also showed an increasing trend, but its export volume was always zero, so the balance of trade was negative with a trend of decreasing year by year; which indicates that during this time, the export volume was lower than the import volume, and Laos became more and more dependent on the importing of livestock products. With respect to changes in trade volumes, the import volume of agricultural products increased from 48716 kilotons in 2010 to 303663 kilotons (522.33%) in 2016, and the export volume decreased from 1729910 kilotons to 522677 kilotons (-69.79%), which shows that the growth rate of the import volume was much higher than the decreasing rate of the export volume. Although the base of export volume was large, the consumption of agricultural products by Laotian residents and livestock was inevitably changed, with an increasing trend in the consumption of farmland ecosystem services. The import volume of livestock products increased from 160 kilotons in 2010 to 279 kilotons (74.49%) in 2016, and the export volume remained constant, which to some extent compensated for the shortage of the Laotian grassland ecosystem supply, resulting in the consumption of grassland ecosystem services also being on the rise (Table 2).
Table 2 Balance of trade of products provided by farmland and grassland ecosystems in 2010-2016 (Unit: kiloton)
Import & export volume of
agricultural products
Import & export volume of livestock products
Year Import Export Balance
of trade
Import Export Balance
of trade
2010 48717 1729910 1681194 160 0 -160
2011 44282 369475 325192 172 0 -172
2012 8765 437738 428973 2189 0 -2189
2013 23903 649229 625327 150 4 -145
2014 29578 391428 361850 179 0 -179
2015 34063 636441 602377 182 0 -182
2016 303663 522677 219014 279 0 -279

Notes: Balance of trade is the difference between the export volume and the import volume.

In addition, the Laotian government adheres to the diplomatic policy of independence, peace and mutual benefit, which fosters a safe external environment for its economic and social development. At present, the main importing countries for Laos are neighboring and friendly countries, such as Thailand (63.40% of import trade value in 2018), China (16.90%) and Vietnam (9.10%). In addition, some products are from Japan (3.40%), South Korea (1.50%), Indonesia (1.00%), Singapore (0.70%), Australia (0.50%) and other countries. Long-term and stable trading partnerships make the imports of products from various ecosystems fairly stable.
In summary, benefited by the enriched varieties of imports, as well as the increased value of trade and the import volume of ecosystem-provided products, the consumption structure of ecosystem-provided products by Laotian residents and livestock has become increasingly diversified, and the consumption mode changed from “dominance of consumption of the farmland ecosystem services” to “balanced development of consumption of farmland, forest and grassland ecosystem services”.

5 Discussions

Although Laos has accomplished many achievements during the agricultural development, its environment has been damaged to a certain degree. Due to numerous mountains and hills, there are still the slash-and-burn production methods in areas with laggard productivity. Local residents have expanded arable land through extensive deforestation, leading to natural problems such as water and soil erosion. Moreover, due to the low education level and weak environmental awareness of many farmers, excessive use of chemical fertilizers and pesticides in production has caused serious land and water pollution and increasingly prominent ecological problems.
Development is a permanent topic. In terms of technology, Laotian farmers lack scientific planting techniques and pest control technologies; as for infrastructure, most rural areas in Laos are backward in power facilities which cannot meet the needs of modern agricultural production. In addition, irrigation facilities are similarly incomplete, with a low effective irrigation rate. It was not until 2009 that Laos built its first railway, and the total length of domestic highways is only 41000 km (in 2012). Besides, farmers are not well educated. To sum up, multiple factors affect the production efficiency directly, causing unreasonable land utilization as well as large consumption but low actual income of ecosystem services for local residents.
To this end, the government can attempt to promote agricultural science and technology, enhance education, strengthen infrastructure construction and attach importance to large-scale industrial chains, in a bid to improve local productivity, thereby preventing ecological problems from further deteriorating and raising the utilization efficiency of Laos’ ecosystem services.
For the time being, due to the selective availability and accuracy of data, this study only analyzes the consumption of products provided by the ecosystem and it does not consider the consumption of services provided by the ecosystem. If the consumption data for a series of ecosystem-provided services, such as water conservation, landscape recreation, climate regulation, etc., become available in the future, research on the consumption of ecosystem services will be more reliable. To implement that part of the analysis, a large quantity of work would need to be invested in field investigation and research, and so that part of the research can be further improved in the future.

6 Conclusions

The tremendous growth in ecosystem utilization has triggered serious conflicts between ecosystem services and human needs. The Belt and Road Initiative has greatly influenced the production and living style of Laotian residents. In this context, the scientific assessment of the consumption of ecosystem services by Laos is critical for exploring its residents’ influence on the ecosystem. By using the harvest index and feed conversion ratios, this paper normalizes the consumption data of agricultural products, fruits and livestock products, and draws three main conclusions.
(1) From the perspective of the consumption structure of ecosystem services, the consumption of farmland, forestry and grassland ecosystem services account for over 80%, over 10% and under 2%, showing downward, upward and constant trends, respectively. In terms of quantity, the consumption of farmland, forest and grassland ecosystem services showed trends of increasing first, then fluctuating and then increasing, with the consumption of farmland ecosystem services showing the greatest change.
(2) Two different modes of “dominance of consumption of the farmland ecosystem services” and “balanced development of consumption of farmland, forest and grassland ecosystem services” came into being in the consumption of Laotian ecosystem services. From 1961 to 2008, the consumption of farmland ecosystem services in Laos accounted for more than 85% of the total consumption, while that of forest and grassland ecosystem services accounted for under 15%, leading to the mode of “dominance of consumption of the farmland ecosystem services”. During 2008-2013, although the consumption of farmland ecosystem services still dominated, its overall proportion dropped to below 85%; while the consumption proportion of forest and grassland ecosystem services rose to over 15%, leading to the mode of “balanced development of consumption of farmland, forest and grassland ecosystem services”. A comparison between the two modes found that the consumption of ecosystem services in Laos has shown a tendency toward being more diversified, which reflects a more complicated food consumption structure of Laotian residents, a more reasonable livestock breeding portfolio and a gradually declining dependence on a single ecosystem of residents and livestock. Accordingly, the sustainability of ecosystem utilization has improved and the well-being of local residents has been enhanced to a certain extent.
(3) The formation and changes in the consumption modes of ecosystem services in Laos are affected by many factors. From the perspective of supply, Laos has been mainly engaged in the development of agriculture. The farmland ecosystem has provided the most basic material security for local residents and livestock. Therefore, Laotian ecological consumption showed the mode of “dominance of consumption of the farmland ecosystem services” from 1961 to 2008. After 2008, the ecological consumption modes became more diversified, although the farmland ecological consumption still accounted for over 80%. Benefited by the enriched varieties of imports, as well as the increased values of trade and import volume, the consumption of ecosystem services in Laos changed from the mode of “dominance of consumption of the farmland ecosystem services” to one of “balanced development of consumption of farmland, forest and grassland ecosystem services”.
1
Aboussaleh Y, Capone R, Bilali H E . 2017. Mediterranean food consumption patterns: Low environmental impacts and significant health-nutrition benefits. Proceedings of the Nutrition Society, 76(4):543-548.

DOI PMID

2
Du B Z, Zhen L, Hu Y F , et al. 2018. Comparison of ecosystem services provided by grasslands with different utilization patterns in China's Inner Mongolia Autonomous Region. Journal of Geographical Sciences, 28(10):1399-1414.

DOI

3
Ducourtieux O, Laffort J, Sacklokham S . 2005. Land policy and farming practices in Laos. Development and Change, 36:499-526.

DOI

4
Fane G . 2006. Trade liberalization, economic reform and poverty reduction in Lao PDR. Journal of the Asia Pacific Economy, 11:213-226.

DOI

5
Galli A, Iha K, Halle M , et al. 2017. Mediterranean countries’ food consumption and sourcing patterns: An ecological footprint viewpoint. Science of The Total Environment, 578:383-391.

DOI PMID

6
Guill R A, Washburn K W . 1973. Relationship between hatch weight as a percentage of egg weight and feed conversion ratio in broiler chicks. Poultry Science, 52:1641-1646.

DOI

7
Heller M C, Keoleian G A . 2003. Assessing the sustainability of the US food system: A life cycle perspective. Agricultural Systems, 76(3):1007-1041.

DOI

8
Hu Z D, Lu D D . 2016. Re-interpretation of the classical geopolitical theories in a critical geopolitical perspective. Journal of Geographical Sciences, 26(12):1769-1784.

DOI

9
Jiao W J, Min Q W, Cheng S K , et al. 2010. Measurement of ecosystem services consumption: A case study of the traditional agricultural area in Congjiang County of Guizhou Province. Acta Ecologica Sinica, 30(11):2846-2855. (in Chinese)

10
Lund C . 2011. Fragmented sovereignty: land reform and dispossession in Laos. Journal of Peasant Studies, 38:885-905.

DOI

11
Mózner, Z V . 2014. Sustainability and consumption structure: environmental impacts of food consumption clusters: A case study for Hungary. International Journal of Consumer Studies, 38(5):529-539.

DOI

12
Menon J, Warr P . 2013. The Lao economy: capitalizing on natural resource exports. Asian Economic Policy Review, 8:70-89.

DOI

13
Millennium Ecosystem Assessment (MEA). 2005. Millennium Ecosystem Assessment Synthesis Report. Washington, D C: Island Press.

14
Pan L H, Yan H M, Huang H Q , et al. 2012. Multi-agent modeling method of reasonable consumption of ecosystem service: A case of the farming pastoral zone in Inner Mongolia. Resources Science, 34(6):1007-1016. (in Chinese)

15
Piao S L, Fang J Y, Ciais P , et al. 2009. The carbon balance of terrestrial ecosystems in China. Nature, 458:1009-1013.

DOI PMID

16
Pierozan C R, Agostini P S, Gasa J , et al. 2016. Factors affecting the daily feed intake and feed conversion ratio of pigs in grow-finishing units: the case of a company. Porcine Health Management, 2:7.

DOI PMID

17
Qin Q, Cheng S K . 2017. A research on the spatial-temporal development of geopolitical pattern in Southeast Asia. Pacific Journal, 25:15-26.

DOI PMID

18
Qin Q, Cheng S K, Wu L , et al. 2018. A study on the spatial distribution of China’s potential foreign cooperation on grain from geographical view. Journal of Resources and Ecology, 9(6):585-591.

DOI

19
Thongmanivong S, Fujita Y . 2006. Recent land use and livelihood transitions in Northern Laos. Mountain Research and Development, 26:237-244.

DOI

20
Tilman D, Clark M . 2014. Global diets link environmental sustainability and human health. Nature, 515(7528):518-522.

DOI

21
Tortella B D, Tirado D . 2011. Hotel water consumption at a seasonal mass tourist destination. The case of the island of Mallorca. Journal of Environmental Management, 92:2568-2579.

DOI

22
Vitousek P M, Mooney H A, Lubchenco J , et al. 1997. Human domination of Earth’s ecosystems. Science, 277(5325):494-499.

DOI

23
Wiedmann T, Minx J, Barrett J , et al. 2006. Allocating ecological footprints to final consumption categories with input-output analysis. Ecological Economics, 56:28-48.

DOI

24
World Wildlife Fund for Nature (WWF). 2004. Living Planet Report 2004. Gland Switzerland:WWF.

25
Xie G H, Wang X Y, Han D Q , et al. 2011. Harvest index and residue factor of non-cereal crops in China. Journal of China Agricultural University, 16:9-17.

26
Yang L, Zhen L, Pan Y , et al. 2012. Ecosystem services supply and consumption: A case in Yellow River watershed, China. Journal of Arid Land Resources and Environment, 26:131-138. (in Chinese)

27
Zhen L, Yan H M, Hu Y F , et al. 2012. Consumption of ecosystem goods and services and its impact assessment. Resources Science, 34(6):989-997. (in Chinese)

28
Zhen L, Ochirbat B, Lv Y , et al. 2010 a. Comparing patterns of ecosystem service consumption and perceptions of range management between ethnic herders in Inner Mongolia and Mongolia. Environmental Research Letters, 5(1):15001.

DOI

29
Zhen L, Liu X L, Wei Y J , et al. 2011. Consumption of ecosystem services: A conceptual framework and case study in Jinghe watershed. Journal of Resources and Ecology, 2(4):298-306.

DOI

30
Zhen L, Liu X L, Li F , et al. 2010 b. Consumption of ecosystem services and eco-compensation mechanism in ecological sensitive regions: Progress and challenges. Resources Sciences, 32(5):797-803. (in Chinese)

Outlines

/