Determining the carrying capacity of ecological resources is the key to finding contradictions between human activities and the environment, as well as the links between economic growth, environmental protection and social development. In recent years, the carrying capacity of the ecological environment has been extensively studied at home and abroad. Through extensive literature research and analysis, this paper discusses the current status and main problems of recent research on the carrying capacity of the ecological environment in China. For example, two of the main problems are that: 1) the concepts and connotations are not clear enough, and 2) the research content is not systematic enough. This is followed by a summary of the evaluation index system and main calculation methods. Finally, according to the research status and development trends at home and abroad, the possible direction for the development of this research field in the future is proposed.
LI Jianlong, LU Xiaofei, ZHANG Jingjing, MOU Linyun, ZHEN Lin, XU Zengrang, ZHOU Weihong. The Current Status, Problems and Prospects of Researches on the Carrying Capacities of Ecological Environment in China[J]. Journal of Resources and Ecology, 2019, 10(6): 605-613. DOI: 10.5814/j.issn.1674-764X.2019.06.005
1 Introduction
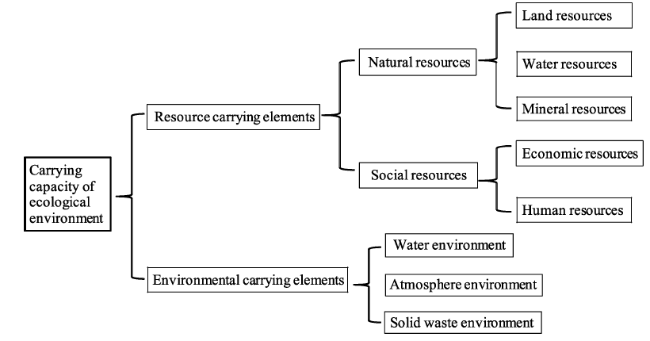
Carrying capacity is an important parameter for measuring regional sustainable development, and resource carrying capacity of the ecological environment is a rigid constraint on sustainable development (Fig. 1). Dai et al. (1992) put forward the definition of “the most appropriate carrying capacity of land resources”. Under certain technical, economic and social constraints, a reasonable ecosystem and a stable population sustained by land resources should be considered when assessing carrying capacity. Resources and the environment are the basis of human survival and development. However, the unreasonable development and over-utilization of resources will cause serious damage to the ecological environment and greatly reduce the carrying capacity of the remaining resources and the environment (Fu et al., 2019). Regional resource and environmental carrying capacity is an important indicator for comprehensively measuring whether a region’s population, resources, environment and other elements are sustainable, whether the relationship between economic growth and the environment is harmonious, and whether overall regional development is sustainable.
Resource and environment carrying capacity refers to the capacity of regional resources and the environmental system to withstand various social and economic activities of the human population in a certain period and within a certain area, under the condition that the regional resource structure meets the needs of sustainable development and the regional environmental function still has the ability to maintain its steady-state level (Niu, 1994; Mao and Yu, 2001; Ding, 2005).
Green livable rural construction has served as the guidance. It has benefitted from key breakthroughs in village clean design, town planning, habitable homes, green building materials, and clean energy, as well as key technologies in the construction of a basic research platform and an ecologically wise rural construction platform. These developments have vigorously fostered the rural environmental protection industry, and new incarnations of the energy industry, the housing industry, and the traditional cultural industry for the promotion of green livable rural construction and development. The carrying capacity of the environment is the key index of the health level of mountains, water, forests, farmland and lake life community. Through resource environmental carrying capacity evaluation, researchers can explain the profound effect of the rural environment carrying capacity and influence the different elements of the scientific concepts of: 1) a rural environmental comprehensive carrying capacity of the ecological environment level; 2) a clear green town carrying capacity of the ecological environment; 3) the potential and directions for the overall green town planning target determination; 4) index scale adjustment; 5) space layout and 6) the structure optimization—all in order to provide a scientific basis and foundational support. The main principles are objective and true, yet also restrictive, operable, and applicable, and they represent a “red line”.
Fig. 1 Main elements of environmental carrying capacity
2 Research status
The increasingly severe environmental pollution now poses a serious threat to human existence, which has prompted people to re-evaluate the environmental problems. Therefore, the concepts of environmental self-purification capacity and environmental carrying capacity have been put forward successively, and they have received universal attention from countries all over the world. The concept of environmental carrying capacity of the ecological environment capacity established a link bridging the environment and human activities, leading to better environmental and social economic coordination that also considers the macro criterion of environmental carrying capacity of the ecological environment capacity in order to adjust the social and economic activities of human beings, and to realize that the sustainable development of nature, economy and society has important guiding and practical significance. In recent years, the research on environmental carrying capacity by domestic and foreign scholars has mainly focused on comprehensive environmental carrying capacity and research on the carrying capacity of separate environmental elements (including soil, water environment, atmospheric environment, tourism environment, etc.). Corresponding concepts and quantitative research methods were also put forward (Dang et al., 1998; Graymore, 2008; Running, 2012). The explicit concept of environmental carrying capacity in China first appeared in 1991, in the Chinese scientific research project “comprehensive study on the environment of China’s coastal economic and technological development zone-general report of comprehensive study on the environmental planning of Meizhou bay development zone in Fujian province”. Most foreign studies on environmental carrying capacity have focused on environmental factors carrying capacity, such as water environment carrying capacity, land carrying capacity, tourism carrying capacity and so on (Zhang et al., 2016; Liu and Zhu, 2017).
Since the 1990s, scholars have begun to introduce the concept of carrying capacity into the study of urban sustainable development because of the increasingly significant impact of urban environment carrying capacity on the realization of urban sustainable development. In a study of the ecological environment in Hehei river basin, Gao (2001) put forward a comprehensive evaluation method for ecological carrying capacity. Lan et al. (2007) defined the concept of carrying capacity of urban land resources. Yang and Zhang (1994) studied the population carrying capacity of land resources in Qinghai province. However, with the continuous deepening of the research on carrying capacity, such unilateral studies on the impact of resource carrying capacity or environmental carrying capacity on the sustainable development level of a city could no longer meet the needs of reality and theory, and the research defects gradually began to appear more clearly. Therefore, some domestic scholars began to integrate the two theories in order to carry out practical empirical analysis and research (Gao, 2018). In the Yangtze River delta, Zhejiang university city, the population capacity research team began studying the urban belt with full awareness of the land resources in the region. By using all kinds of resources outside the regional market and human resources that all belonged to the resources in this area, they put forward three main factors affecting the urban population capacity, the group from the perspective of open system to discuss city research methods, the carrying capacity of ecological environment capacity of environment for the further development of resource environmental carrying capacity of ecological environment capacity theory has a guiding significance to the reality. Ye (2018) believed that the study of urban comprehensive carrying capacity should include the study of the urban ecological environment, public services and infrastructure, resource differences and other aspects. Sun et al. (2009) constructed an evaluation system of the urban environmental comprehensive carrying capacity by using the evaluation model of the urban environmental comprehensive carrying capacity, which was mainly used to analyze the regional differences of carrying capacity among Chinese cities, and those authors determined the factors that have the greatest impact on urban carrying capacity.
Since 1990, led by Zhao (2008) for the first time, the concept of natural grassland ecological resource environmental carrying capacity of ecological environment capacity was put forward, as an evaluation standard and new calculation method. With it, they established the typical pastoral areas in China after years of research and development of the ecological carrying capacity using a 5S three-dimensional fast remote sensing dynamic monitoring system (Li et al., 2010), 1) the system put forward our country key with typical fragile ecological system and ecological resource environmental carrying capacity of ecological environment capacity calculation theory focus on farmers and herdsmen, calculation methods and evaluation system, and 2) combining with the responsible for key state science and technology projects, puts forward the comprehensive science typical ecological agriculture in our country poverty counties ecological resource environmental carrying capacity of ecological environment capacity promotion theory, technology and policy, etc. It provides scientific basis and frontier guidance for China to implement a rural revitalization strategy and take the road of green, low-carbon, environmental protection and sustainable development in the future (Li, 2018).
3 Problems
3.1 Concept and connotation are not clear
Scholars at home and abroad have put forward different concepts and connotations of resource carrying capacity in different periods, involving many disparate aspects. They have made great contributions to the study of environmental carrying capacity, but they have not yet defined its connotation and extension accurately or reached a consensus. The research on the concept and connotation of carrying capacity is very important and involves all aspects of carrying capacity research. Therefore, further studies by scholars are needed.
3.2 Research content is not systematic
At present, urban resource carrying capacity, urban environmental carrying capacity and urban ecological carrying capacity have been studied systematically. However, few scholars pay attention to the key aspects of urban systems, such as the carrying capacity of urban infrastructure, urban security carrying capacity and urban public service carrying capacity. The research on the carrying capacity of public service is especially very weak. With the continuing development of society, these aspects are becoming more and more important to the urban carrying capacity. Therefore, the future research on these aspects of carrying capacity should be strengthened.
4 Accounting methods
4.1 Index systems of ecological environment carrying capacity evaluation
(1) Socio-economic indicators (Table 1): Considering the systematic use of statistical data to replace GDP with industrial output value, food is used instead of the agricultural output value to reduce the calculation workload.
Table 1 Evaluation indexes of the ecological environment carrying capacity
Evaluation index
Sub-evaluation index
Geological environment
The geographical position
Highway traffic, Railway traffic, Water transport conditions, Aviation conditions
The area of parks, The area of mining environment restoration and improvement
The water
Total water resources, Surface water quantity, Low water quantity, Runoff regulation quantity, Recoverable water quantity, Industrial water quantity, Agricultural water quantity and ecological water quantity
Evaluation index of the social environment carrying capacity
Demographic factors
Population density, Natural population growth rate
Economic factors
The ratio of annual GDP growth rate, Per capita GDP and environmental protection investment to GDP
Science and technology factors
The proportion of the output value of high-tech industry in GDP, The number of patent applications
Management and construction level
The central treatment rate of sewage, The compliance rate of sewage and wastewater, The treatment rate of industrial waste gas
(2) Ecological environment index (Table 1): This index mainly considers environmental resources and environmental quality. Resource indicators include water resources, land resources, forest and grass resources, etc. The environmental quality index includes air environment quality, water environment quality, land environment, forest and grass quality and comprehensive ecological environment quality. The calculation and prediction of resource indicators are based on the socio-economic development plan.
4.2 Calculation and evaluation models of resource and environmental carrying capacity
The calculation and evaluation models for resource and environment carrying capacity are as diverse as the calculation and evaluation methods. They include traditional models such as logistic growth model, neural network model, grey system model, multiple regression model, coupling model and dynamic model. There are also improved or innovative models built based on the specific characteristics of resource carrying capacity, such as the ARVE-DGVM (present state-of-the-art dynamic global vegetation model) model, geometric relative resource carrying capacity model, etc. In addition, there are also comprehensive evaluation models, such as pulse coupled neural network model (PCNN), which are based on two or more models.
4.3 Main methods of carrying capacity accounting in China
The main methods for evaluating environmental population carrying capacity, environmental economic carrying capacity and reasonable land use scale are discussed in this section.
4.3.1 Environmental population carrying capacity accounting
4.3.1.1 Resource and environmental population carrying capacity accounting based on food security objectives
(1) Calculate grain production capacity. The first step is to determine the future supply of cultivated land according to three factors: the current general plan for land use, the increase or decrease of cultivated land quantity and the change trend of cultivated land quality. The second step is to calculate the production potential of land according to the light, temperature, water, heat and technological level, while considering the impacts that factors such as the improvement of cultivated land quality, agricultural technological progress, soil pollution, natural disasters and geological disasters may have on cultivated land grain productivity.
$G=A\times a\times b\times P$
where, G is annual total grain production, A is annual arable land (considering relevant factors such as finishing, development, reclamation, farmland and disasters, and agricultural structure adjustment on the influence of cultivated land quantity, cultivated land quality improvement, soil pollution, and the influence of coal mining subsidence on cultivated land quality), a is multiple crop index, b is grain percentage, and P is grain yield (target annual grain yield by considering the influence of technology progress, on the basis of historical data from a 1990-2014 multivariate regression forecast).
(2) Set food security level. The first step is to determine the desired level of food security (such as guaranteeing grain ration and grain ration level, or including commercial grain, feed quantity and level, etc.) according to both the land function positioning of the city and each district and county (such as major grain producing areas and industrial parks) and the current situation of grain supply and demand (grain self-sufficiency rate). The second step is to determine the per capita food consumption by referring to the international food security standard of 550 kg per person.
(3) Calculate the population carrying capacity. According to the land production potential, grain supply and security level, and per capita grain consumption standard, the population carrying scale of the target year is calculated. By comparing and analyzing the results of different scenarios, the carrying capacity of the environmental population with a reasonable range is proposed. The results are compared with the present situation and the population carrying capacity of the environment supported by the planned/expected cultivated land area.
$R=\frac{G}{\gamma \times C}$
where R is the population carrying scale of the target year, γ is the food self-sufficiency rate, and C is the food consumption at different levels.
4.3.1.2 Measurement of population carrying capacity of the environment based on the impact on water resources
(1) Calculate the scale of regional water resources. The total amount of water resources includes regional surface water, underground water and external water. Among them, the scale of surface water supply in the target year is composed of the amount of water extracted from provincial-level rivers and non-provincial-level rivers. The amount of water taken from the rivers is controlled by the province and shall not be higher than the amount of water taken from the rivers as determined by the water resources department of Jiangsu province. The amount of water taken from non-provincial controlled rivers shall be determined by the municipal water conservancy bureaus. It is necessary to modify the water quality compliance rate according to the status quo and the planning objectives of the water functional areas.
(2) Set per capita comprehensive water consumption. The first method, quota analysis, refers to the United Nations standard (flood line 3000 m3 per person, warning line 1700 m3 per person, minimum line 300 m3 per person). In the second method, multiple regression variance was used to forecast consumption based on the data from 1990 to 2014 (per capita water consumption, GDP, industrial ratio, per capita income, education level and other factors) when economic scale and structure, urbanization development, improvement of living standards and other factors were considered.
(3) Calculate the population carrying capacity. Population carrying capacity is calculated according to the amount of regional water resources and per capita water consumption in the target year. If the water quality compliance rate of the water functional zone is less than 60%, the corresponding current or planned carrying capacity will be reduced by 20%. If the water quality meeting the standard in the water function area reaches 60%, but is lower than 70%, the calculated carrying capacity will be reduced by 10%. It the water quality in the water functional area reaches 70%, but is less than 80%, the calculated capacity is reduced by 5%. In all other cases, there is no reduction. By comparing and analyzing the results of different scenarios, the carrying capacity of environment population within a reasonable range is proposed.
${R}'=\frac{G}{{\gamma }'\times {C}'}$
where R′ is the population carrying scale of the target year based on water resource impact, C′ is the per capita water resource consumption at different levels, and γ′ is the reduction coefficient based on water resource quality.
4.3.1.3 Environment population carrying capacity calculation based on environmental load
(1) Analyze environmental load history and the current situation. Analyze regional environmental load degree, regional differences and change characteristics by using environmental statistics data.
(2) Predict and analyze total SO2 emission. According to the variation law and trends of SO2 pollutant emission in the regional units, different scenarios were set to calculate and evaluate the annual total amount of pollutant emission, and these were compared with the targeted total amount of pollutant control determined by the environmental protection department.
(3) Determine per capita environmental load (per capita SO2 emission). Based on the calculation results of sulfur dioxide emission and population change predictions, the changes in the rules of environmental load per capita in each evaluation region were analyzed. The prediction method can adopt BP neural network and fuzzy prediction methods, and the basic data used are the historical data from 1990 to 2014.
(4) Calculate the population carrying capacity. Population carrying capacity was calculated according to the total pollutant control target and the environmental load per capita. By comparing and analyzing the results of different scenarios, the carrying capacity of environment population within a reasonable range is proposed.
4.3.1.4 Calculation of carrying capacity of environment population based on ecological footprint
(1) Calculate the total ecological footprint. Ecological footprint refers to the standardized land units needed to maintain all human consumption activities, which are manifested as ecological surplus, ecological balance and ecological deficit. The supply model is used to calculate the ecological footprint, that is, the total ecological carrying capacity of the region is represented by all the ecological land actually owned by the region.
where EC is the total supply of regional ecological footprint, j is the Jth type of land, aj is the total area of biological productive land of the Jth type of group, γj is the equilibrium factor, and yj is the yield factor (expressed by the ratio of the average productivity of biological productive land of the Jth type of area to the average productivity of such land).
(2) Measure per capita ecological footprint. By comparing the per capita ecological footprint with the per capita ecological deficit, the sustainable utilization of ecological resources in each region can be judged, and the population carrying capacity can be calculated accordingly.
$ec=EC/N$
where, ec is the per capita ecological footprint, and N is the predicted population size of the target year.
(3) Calculate the population carrying capacity. According to the ecological footprints of different scenarios, the corresponding population sizes were calculated and compared with the current situation and planned population sizes.
$R=\left( 1-0.12 \right)EC/ec$
where, R is the population carrying capacity of the target year, and 0.12 refers to the 12% of bio-productive land that should be deducted from the ecological space to protect biological diversity.
4.3.2 Measurement of resource, environment and economic carrying capacity of the ecological environment capacity
4.3.2.1 Calculation of environmental economic carrying capacity of the ecological environment capacity based on land consumption rate
(1) Determine the scale of construction land. The present situation and planned scale of construction land shall be based on those determined by the department of land and resources. According to the forecast of the level of improvement of the land consumption rate and the economic development scale planned by the development and reform departments, different scenarios can be set for calculating the total scale of construction land, and a comparison analysis can be conducted with the planning data from the land and resources departments.
(2) Calculation of the land consumption rate. Firstly, the amount of construction land occupied per unit of GDP under the current situation is calculated, and then the rate of land consumption in the future target year is predicted according to the economic development trend. During the forecasting process, the influences of technological progress and policy intensification on land use intensity and economical utilization are taken into account. The land consumption rate can also be directly determined from the land use intensity and economical use of the assessment objectives.
(3) Calculate the economic carrying capacity. The economic carrying capacity of the target year is calculated according to the construction land supply scale and land consumption rate in the target year. By comparing and analyzing the results of different scenarios, the reasonable carrying capacity of ecological environment capacity for the resources, environment and economy is proposed.
$E=\frac{C}{G}$
where E is the economic load scale based on the land consumption rate in the target year, C is the construction land scale in the target year, and G is the construction land occupation per unit GDP at the different levels.
4.3.2.2 Measurement of environmental economic carrying capacity of the ecological environment capacity based on water resource efficiency
(1) Determining the total consumption of water resources. The current and planned values of total water resources consumption shall be subject to the determination of the water resources department (subject to the planning and control target of future water resource utilization). The future development trend of the water consumption sector can also be predicted.
(2) Calculation of water resource efficiency. The first method calculates the amount of water consumed per unit of GDP under the current situation, and then the water consumption rate in the future target year is predicted according to the historical economic development trend. The prediction process takes into account the influences of social and technological progress and the deepening of the water-saving concept. In the second method, the water consumption rate can also be determined directly from the water-saving target, and it can also be set with reference to the national and Jiangsu average levels.
(3) Calculation of the economic carrying capacity. Economic carrying capacity can be calculated according to water resource efficiency and total water resource consumption. As water pollution will lead to the reduction of carrying capacity, the specific calculation is based on the “resource and environment population carrying capacity calculation based on water resource constraints”.
$E=\frac{W}{C}\times a$
where E is the economic load scale based on water resource use efficiency in the target year, W is the total water resources available for consumption in the target year, C is the water resource occupancy per unit of GDP for different levels, and a is the reduction coefficient of water resource quality.
4.3.2.3 Calculation of resource economic carrying capacity of the ecological environment capacity based on environmental load
(1) Predict and analyze pollutant emissions. According to the urban and county environmental protection plans, determine the planned and controlled total amount of SO2 emission in the target year. One can also set different scenarios of economic development speed, predict the scale of the SO2 emission sector in the future, and obtain the total amount of SO2 emission in the target year.
(2) Calculation of sulfur dioxide emissions per unit of GDP. The first method calculates the sulfur dioxide emissions per unit of GDP under historical and current conditions, and it then predicts the sulfur dioxide emissions per unit of GDP in the future target year according to the historical economic development trend, and it predicts the impact of industrial structure adjustments in the process. As a second method, sulfur dioxide emissions per unit of GDP can also be determined directly from the environmental protection target, or by referring to the national and Jiangsu average levels.
(3) Measurement of the economic carrying capacity. According to the total amounts of sulfur dioxide emissions and the sulfur dioxide emission control targets per unit of GDP in different scenarios, the corresponding economic capacity can be calculated and compared with the planned economic scale.
$E=\frac{T}{C}$
where E is the economic carrying capacity of the ecological environment scale based on the environmental load in the target year, T is SO2 total emission at different levels in the target year, and C is sulfur dioxide emission per unit of GDP.
4.3.2.4 Calculation of environmental economic carrying capacity based on ecological footprint
(1) Measure ecological footprint. Ecological footprint refers to the standardized land units needed to maintain all human consumption activities, which may be manifested as ecological surplus, ecological balance or ecological deficit.
(2) Measure the ecological footprint per unit of GDP. By comparing the ecological footprint per unit of GDP with the ecological deficit per unit of GDP, the sustainable utilization of ecological resources in each region can be judged, and the economic carrying capacity can be calculated accordingly.
${e}'{c}'={E}'{C}'/GDP$
where e′c′ is the per capita ecological footprint and GDP is the predicted economic scale of the target year.
(3) Calculate economic carrying capacity. According to the ecological footprints of each different scenario, the corresponding economic scale is calculated and compared with the current situation and the planned economic scale.
${R}'=\left( 1-0.12 \right){E}'{C}'/{e}'{c}'$
where R′ is the economic carrying capacity based on the ecological footprint in the target year, and 0.12 refers to that 12% of bio-productive land that should be deducted from the available ecological space to protect biological diversity.
4.3.3 Calculation of land use scale based on environmental carrying capacity
4.3.3.1 Calculation of minimum cultivated land amount based on environmental carrying capacity
According to the population size of the reference carrying capacity of the ecological environmental capacity of resources and the environment, the minimum amount of cultivated land is calculated. It is the compared with the amount of cultivated land determined by the current land use planning scenario, and the value range of the minimum amount of cultivated land is determined by:
$G=P\times g$
where G is the minimum cultivated land holding amount, P is the population size of the reference carrying capacity of the ecological environmental capacity of resources and environment, and g is the per capita cultivated land holding amount (calculated based on per capita grain demand and per unit yield of grain under different scenarios).
4.3.3.2 Calculation of the optimal ecological land use based on the environmental reference carrying capacity
According to the national ecological construction demonstration area management regulation, this must include: ecological land for nature reserves, the drinking water source reserves, scenic spots, important headwater basic grasslands, forest parks, urban green land, rivers, reservoirs, wetlands, ecological public welfare forests, and the grass, desert and other needs of ecological protection areas.
The calculation is based on the above data and takes into account the influences of both the minimum amount of cultivated land and the maximum scale of construction land.
4.3.3.3 Calculation of the maximum amount of land used for construction
This calculation is based on the reference carrying capacity of the ecological environment capacity of the environment (population/economic scale).
The maximum amount of land used for construction based on the population scale can be calculated as follows:
${{C}_{1}}={{P}_{1}}\times {{c}_{1}}$
where C1 is the maximum amount of land used for construction, P1 is the carrying capacity of the environmental reference population, and c1 is the per capita construction land size.
The maximum amount of land used for construction based on the economic scale can be calculated as follows:
${{C}_{2}}={{P}_{2}}\times {{c}_{2}}$
where C2 is the maximum amount of land used for construction, P2 is the reference economic carrying capacity of the environment, and c2 is the economic output per unit of construction land.
The comparative analysis of the maximum construction land scales based on either the population or economic carrying capacity is combined with the comparison analysis of the maximum construction land scale with the current overall land use planning scenario. Based on both of these analyses, the maximum construction land scale value range is determined.
5 Research trends and prospects
Research on ecological carrying capacity is still in its infancy, and no complete theoretical system has been derived. The research on ecological carrying capacity has evolved from general qualitative description to quantitative and mechanistic discussions, and more robust approaches to the objective nature of ecological carrying capacity. The analysis conducted here has identified four key characteristics.
5.1 The research objects tend to be diversified, and the research fields show a cross-disciplinary synthesis trend
It is difficult to adapt the research of single factor carrying capacity to the specific requirements of the development of ecosystem resources. With the development of ecological carrying capacity research, increasing attention will be paid to the study of mutual substitution between ecosystem resources. Therefore, it is necessary to strengthen the cross- disciplinary nature of the comprehensive research and study the ecological carrying capacity from the perspective of the whole system. Therefore, ecological carrying capacity research is bound to become multi-disciplinary from the cooperation among single-discipline and single-factor research, and involve more multi-factor and multi-level comprehensive research across population, resources, the environment and development.
5.2 Ecologically fragile zones will continue to be the hotspots of ecological carrying capacity research
With the enhancement of human activities, the special features of the natural and ecological environment make the ecologically fragile zones face more serious resource and environmental problems than other regions. Although many scholars have made some efforts in different fields from the aspects of theory and research methods, the research on the ecological carrying capacity of ecologically fragile zones has attracted increasing attention and this has strengthened, enriched and further developed the theory of ecological carrying capacity. However, it still needs to be further improved in the aspects of analysis and evaluation of ecological carrying capacity levels, estimation of carrying capacity thresholds, prediction of dynamically changing processes and quantitative selection of indicators.
5.3 The research focus will continue to develop towards dynamic simulation
At present, there are few modelling methods applied in carrying capacity studies; and, in particular, those of general significance in carrying capacity research are still in the exploration stage. In order to improve the scientific basis and applicability of ecological carrying capacity research, it is necessary to: 1) strengthen the dynamic simulation research of ecological carrying capacity;2) establish a set of model systems that can reflect the essence of ecological carrying capacity, and 3) realize the estimation of ecological carrying capacity and the prediction of dynamically changing processes.
5.4 New methods and technological means will be applied to the research of ecological carrying capacity
The complexity of an ecosystem determines the complexity of the research methods and means of determining its carrying capacity. In metrological analysis, system dynamics, multi-factor analysis, input-output analysis, capital labor production function and migration matrix will become the main forces. Remote sensing (RS) can provide fast and accurate information, and geographic information systems (GIS) can carry out the spatial analysis of carrying capacity. Therefore, the combination of mature models, with RS and GIS technologies will provide more accurate and comprehensive research results for carrying capacity research in the future.
DaiJ, Zhou SQ, Yao XQ . 1992. Research on methods of land production potential and population carrying capacity—A case study of Baoji area in Shaanxi Province. Resources and Science, 14(6):56-62. (in Chinese)
2
Dang AR, Yan SY, Wu HQ , et al. 1998. GIS-based study on land production potential in China. Acta Ecologica Sinica,20(6):910-915. (in Chinese)
Ding RZ . 2005. Economic growth: theoretical debate on resource, environment and limit issues and choices faced by human beings. Economist, ( 4):11-19. (in Chinese)
4
Fu YQ, WangL, HuangC , et al. 2019. Evaluation of environmental bearing capacity of a gold mine in northwest China plateau. Mining Research and Development, 39(6):141-149. (in Chinese)
5
Gao JX. 2001. Discussion on the Theory of Sustainable Development- Theory: Method and Application of Ecological Carrying Capacity. China Environmental Science Press. (in Chinese)
6
Gao JX . 2018. Research on core theories of regional ecology . Chinese science bulletin,63(8):693-700. (in Chinese)
7
Graymore M LM, Sipe NG, Rickson RE . 2008. Regional sustainability: how useful are current tools of sustainability assessment at the regional scale? Ecological economics, 67(3):362-372.
Lan DD, Wei SQ, Chen ZQ . 2007. Preliminary research on urban land resource carrying capacity—A case study of Fuzhou. Journal of Shenyang Normal University (Natural Science Edition), ( 2):252-256.(in Chinese
9
Li JL . 2018. Application for 2018 national key science and technology project “research and development of green livable rural carrying capacity of ecological environment accounting and improvement method” (official application), part ii research background and scheme: 5-10. (in Chinese)
10
Li JL, LiH, Gang CC , et al. 2010. Progress of 5S integration technology and its application in agricultural science. Jiangsu Agricultural Science, ( 5):26-29. (in Chinese)
11
Liu WZ, ZhuJ . 2017. Research progress on resource and environment carrying capacity: From the perspective of comprehensive geographical research. China Population,Resources and Environment, 27(6):75-86. (in Chinese)
12
Mao HY, Yu DL . 2001. Research on regional carrying capacity of ecological environment capacity of Bohai rim region. Acta Geographica Sinica, 56(3):363-371. (in Chinese)
13
Niu WY. 1994. Introduction to Sustainable Development. Beijing: Science Press: 1-6. (in Chinese)
14
Running SW . 2012. A measurable planetary boundary for the biosphere. Science, 337(6101):1458-1459.
SunL, LuB, Zhuo LL . 2009. Research on regional differences of urban carrying capacity in China. Urban Development Research, 16(3):133-137. (in Chinese)
Ye TM . 2018. Transformation of urban governance system and planning. China Construction Informatization, ( 3):9. (in Chinese)
17
Yang XP, Zhang ZL . 1994. Regional distribution and geographical background of population carrying capacity in Qinghai Province. Population in Northwest China, ( 1):23-27. (in Chinese)
18
ZhangY, Hou LG, YuanQ , et al. 2016. Review of research on ecological carrying capacity. Agricultural Science and Information, ( 8):49-50. (in Chinese)
Zhao WY, Li JL, ChenY . 2008. Ecological carrying capacity and sustainable development of the north slope of Tianshan mountain—A case study of Fukang city. Acta Ecologica Sinica,28(9):4363-4371. (in Chinese)
