Ecological Carrying Capacity

Characteristics of Agricultural and Livestock Products Trade Flows between China and the “Belt and Road” Initiative Region: From the Perspective of Biocapacity

  • JIN Mingming 1, 2 ,
  • XU Zengrang , 1, *
Expand
  • 1. Institute of Geographic Sciences and Natural Resources Research, Chinese Academy of Sciences, Beijing 100101, China
  • 2. University of Chinese Academy of Sciences, Beijing 100049, China
XU Zengrang, E-mail:

Received date: 2019-06-28

  Accepted date: 2019-08-18

  Online published: 2019-12-09

Supported by

The Tibetan Scientific-Technology Project(Z2016C01G01/04)

The National Natural Science Foundation of China(41571496)

The National Key Research and Development Programme(2016YFC0503403)

Copyright

Copyright reserved © 2019

Abstract

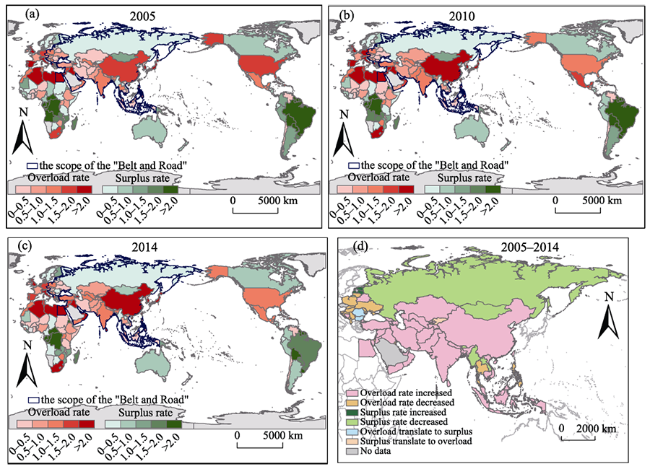
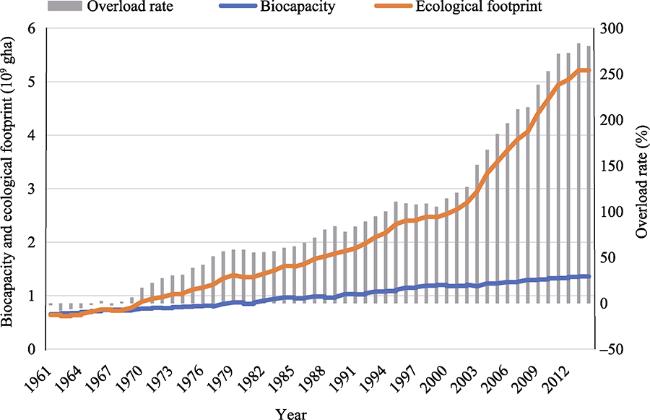
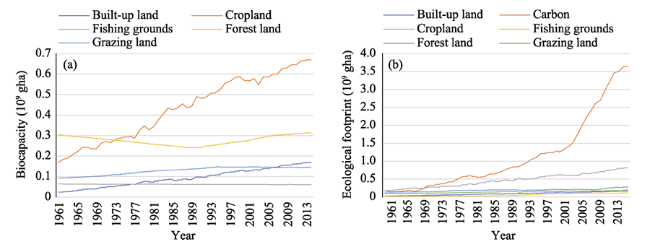
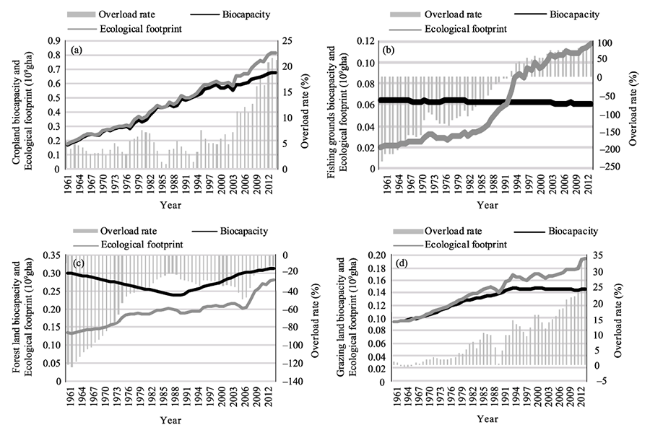
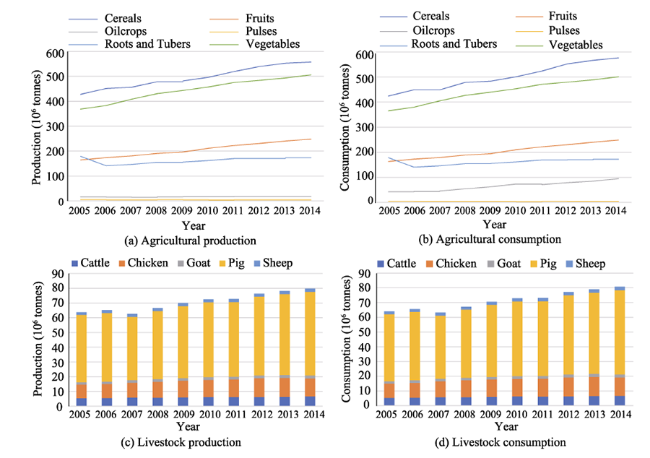
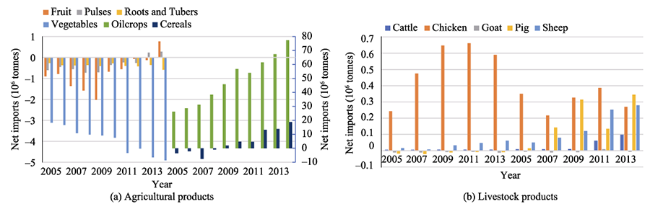
In the context of global ecological overload, international trade has become one of the most important ways to make up for the ecological deficit. This study takes the “Belt and Road” Initiative as the study area to analyze the biocapacity and ecological footprint characteristics between China and other countries along the “Belt and Road” Initiative. Trade flow characteristics were explored from the perspective of biocapacity. The import and export of virtual land was used to assess the effect of trade on compensating for the resource gaps in crop and grazing land. The main results show that: 1) In 2005-2014, the majority of “Belt and Road” countries were experiencing increasing degrees of overload. In China, cropland takes up the largest proportion of biocapacity, while the ecological footprint is dominated by the carbon footprint. 2) The trade flow of agricultural and livestock products in the mainland of China shows a trend of increasing imports and decreasing exports, which increases dependence on specific regions. 3) In 2005-2014, China’s trade in cereals and oil crops along the “Belt and Road” Initiative were generally net imports, and the share of cereals traded along the “Belt and Road” Initiative is increasing gradually, but that of oil crops decreased rapidly. 4) The import trade has alleviated ecological deficit, as the selected products compensated for 1.03 times of the cropland deficit and 0.65 times of the grazing land deficit in China. This study is helpful to understand the relationship between the land use and trade deeply, and provide decision-making references for reducing ecological deficits, optimizing land resource allocation, and promoting win-win cooperation among China and other countries in the “Belt and Road” Initiative.

Cite this article

JIN Mingming , XU Zengrang . Characteristics of Agricultural and Livestock Products Trade Flows between China and the “Belt and Road” Initiative Region: From the Perspective of Biocapacity[J]. Journal of Resources and Ecology, 2019 , 10(6) : 584 -597 . DOI: 10.5814/j.issn.1674-764X.2019.06.003

1 Introduction

In 2016, the 65 countries along the corridor of the “Belt and Road” Initiative included three countries in Northeast Asia, 11 in Southeast Asia, seven in South Asia, five in Central Asia, 20 in west Asia and North Africa, as well as 19 in central and eastern Europe. Collectively, they had a total population of about 4.4 billion, accounting for 63% of the total world population, while the total economic output only accounted for 29% of the world output. Most of these countries are emerging economies and developing countries with significant differences in land cover types. The regions along the “Belt and Road” Initiative are among the world’s most important cereal-producing regions, accounting for more than 40% of the world’s total cereal production. They also include traditional pastoral areas for Tibetan pastoralists, Mongolian and Chinese herders, and central Asian and Middle Eastern pastoralists (Weber and Shannon, 2011), where unique advantages of animal husbandry development have been shown. However, the large population base and rapid growth have caused sharp contradictions between the people and the land, such as a lack of fresh water resources, extensive land management, insufficient input of production factors, outdated technological status, and frequent political conflicts. These factors have led to the widespread low utilization rate and productivity of agriculture and animal husbandry, where yields of crops such as wheat, rice, and maize are lower than the world average and food self-sufficiency is also generally lower (Sun and Li, 2015; Liu, 2017). Factors such as climate change, overgrazing, and changes in the socioeconomic system have accelerated grassland degradation and increased the vulnerability of grassland ecosystems (Dong et al., 2013).
Biocapacity refers to the population size at a certain level of consumption that can be raised within a timed space, under the premise that the ecosystem has the ability to recover (Bicknell et al., 1998). In 1992, the ecological footprint was proposed for estimating the bio-productive land area required to produce consumer products and dispose of waste (William, 1992; Wackernagel and William, 1996). Using the ecological footprint, consumption characteristics can be evaluated in addition to the regional ecological deficit or reserve combined with biocapacity. However, regional biocapacity research is now only rarely combined with trade research. As a result, it is difficult to assess the role of import and export trade in replenishing regional or national resource gaps, and the study of production and consumption changes and the ecological resource effects are limited to internal studies of individual countries or regions, and has little significance for regional resource allocation and ecological governance under globalization. As a result, in this study we analyze the biocapacity and ecological footprint characteristics between China and countries along the “Belt and Road” Initiative, in addition to changes in production, consumption, and import and export volumes, by selecting six types of agricultural and five livestock products based on their usage of cropland and grazing land. We explore the trade flow characteristics by considering the scale of trade flows globally and within the “Belt and Road” Initiative. By calculating the net import of virtual land, we assess the effect of international trade on alleviating the pressure experienced by China’s land resources. This information provides important decision-making references for reducing ecological deficits, optimizing land resource allocation, promoting win-win cooperation among the “Belt and Road” Initiative countries, and promoting stable ecological and socioeconomic development in the region.

2 Methods

This study takes the ecological reserve or deficit as the starting point, and first analyzes the biocapacity and ecological footprint of China and the “Belt and Road” Initiative. It then analyzes the trade flow of agricultural and livestock products, calculates the proportion of China’s trade with the “Belt and Road” Initiative within China’s global trade, and then measures the effect of trade flows on the ecological deficit by calculating the import and export volumes of virtual land, to explore the relationship between biocapacity and trade flows.
The national biocapacity and ecological footprint data were provided by the Global Footprint Network (https://www.footprintnetwork.org/) using the latest data up to 2014. The time range of the “Belt and Road” Initiative includes data for 2005, 2010 and 2014, and for China it covers 1961 to 2014. The agricultural and livestock product trade data were obtained from the Food and Agriculture Organization of the United Nations(http://www.fao.org/faostat/en/#home). The years 2005, 2010 and 2014 were selected for analyzing the changes in production, consumption and import and export levels, and the latest data matches the biocapacity data.

2.1 Biocapacity and ecological footprint1( For more details, see the Global Footprint Network (https://www.footprintnetwork.org/).)

Biocapacity is the ecosystems’ capacity to produce biological materials used by people and to absorb the generated waste material under current management schemes and extraction technologies. Biologically productive land and water areas are categorized into five types: i.e., cropland, grazing land, forest land, fishing grounds, and built-up land.
$BC=\sum\limits_{j}^{5}{{{A}_{j}}\times {{\beta }_{j}}\times {{y}_{j}}}$
where BC is biocapacity (gha), Aj is the area of land type j (ha), βj is the equivalence factor, and yj is the yield factor of land type j.
An ecological footprint is defined as the area used to support the consumption by a defined population, which includes the area needed to produce the materials consumed and the area needed to absorb the carbon dioxide emissions. There are six types of ecological footprints: i.e., built-up land, carbon footprint, cropland, fishing grounds, forest land, and grazing land.
$EF=\sum\limits_{j}^{6}{\Sigma _{i}^{n}(S_{j}^{i}\times {{\beta }_{j}})}$
where EF is the ecological footprint of consumption (gha), j is the land type, i is the the i-th natural resource consumed by people, and $S_{j}^{i}$is the area of land type j converted from the i-th resource due to consumption (ha).
The difference between the biocapacity and ecological footprint of a region or country can be expressed as either deficit or reserve. An ecological deficit occurs when the ecological footprint of a population exceeds the biocapacity of the area available to that population, while an ecological reserve is the opposite.

2.2 Trade flows

According to the FAO classification criteria, some typical agricultural and livestock products were selected, including six types of agricultural products (cereals, roots and tubers, pulses, oil crops, vegetables, and fruits) and five types of meat (cattle, sheep, goat, chicken, and pig). The statistical ranges of production, consumption, and imports and exports of the agricultural and livestock products include all products under each category of the FAO classification criteria, while the statistical ranges of trade flows only select the common products as shown in Table 1.

2.3 Virtual land

Virtual land refers to the amount of land resources needed to produce goods and services, while a virtual land strategy refers to those countries (regions) with poor land that must obtain land-intensive agricultural products from land-rich countries (regions) through trade, in order to ensure land and food security to a certain degree (Yan et al., 2007).
The net import of virtual land is calculated as follows:
$Y=\sum\limits_{i~=1}^{n}{\frac{{{V}_{i}}}{{{W}_{i}}}}$
where Y is the net import area of virtual land (ha), Vi is the net import of the i-th product, and Wi is the current average yield of the i-type product in China. The yields of agricultural products were obtained from FAO, while those of livestock products were estimated by the following method:
W = P ´ C
where P is the raw meat yield of livestock obtained from FAO, and C is the carrying capacity per unit area (sheep unit/ha) according to the distribution of various grazing lands and the standard livestock-carrying capacity in China.1( Natural Resources Comprehensive Inspection Committee of the National Planning Commission of the Chinese Academy of Sciences Compilation. Chinese Natural Resources Handbook. 1990.)
The imported ecological capacity of land type j can be calculated as follows:
BCIj=Yj×βj×yj
where BCIj is the imported ecological capacity, Yj is the net imported area of virtual land, βj is the equivalence factor, and yj is the yield factor for land type j.
According to the Global Footprint Network, the equivalence factors for China’s cropland and grazing land are 2.52 and 0.46, respectively, while the yield factors are 2.18 and 0.81, respectively. These selected common food products were used as representatives of the wide variety of agricultural and livestock products, and the trade compensation for the ecological deficits of other products was not considered.

3 Results

3.1 Changes in the biocapacity and ecological footprint of the “Belt and Road” initiative region from 2005 to 2014

3.1.1 Changes in the ecological carrying capacity of the “Belt and Road” initiative region in 2005-2014
Ecological deficits generally appear in the middle and low latitudes of the northern hemisphere. Consequently, most of the “Belt and Road” countries are always overloaded, and have shown increasing degrees of overloading (Fig. 1).
Fig. 1 The ecological carrying status of the “Belt and Road” countries in 2005, 2010, and 2014 (a-c); Trends in the ecological deficit or reserve of the “Belt and Road” countries from 2005 to 2014(d).
For example, China’s overload rates were 185% in 2005, 253% in 2010, and 280% in 2014. Compared with the changes in the ecological overload situations of the “Belt and Road” countries, the overload rates of most countries in eastern, central, southern, and western Asia and north Africa increased, while the surplus rates of Russia and Mongolia in northeastern Asia and Bhutan, Laos, and Myanmar in southeast Asia all decreased. Thailand and the Philippines have reduced their overload rates, while most of the remaining countries in Southeast Asia have increased their overload rates. The ecological carrying capacity of central and eastern Europe is relatively good, because most countries there have reduced the overload rate: e.g., Bulgaria and Romania have changed from overload to surplus, and Estonia and Latvia’s surplus rates have increased.
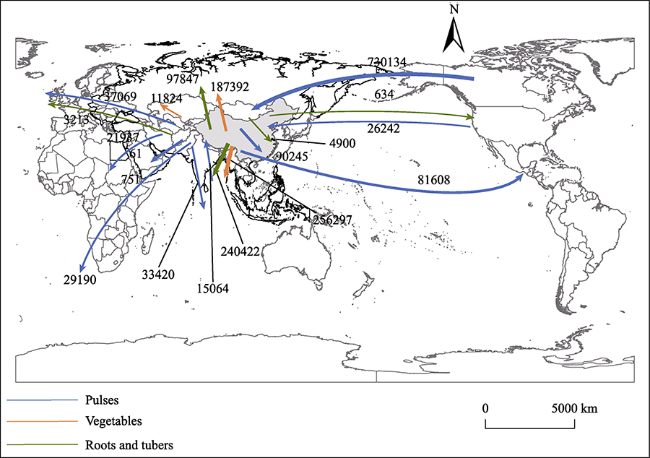
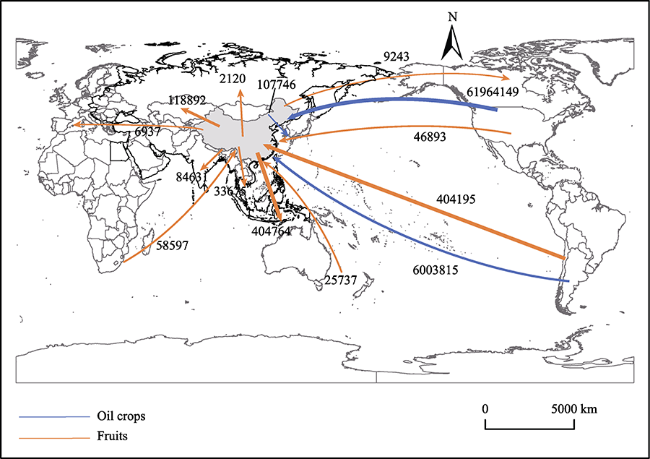
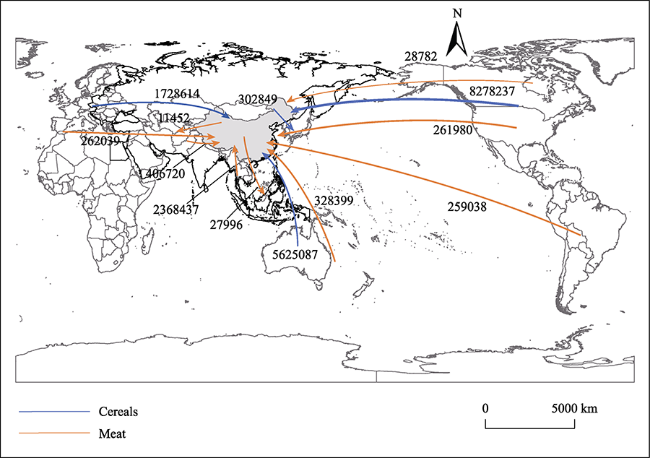
Table 1 Statistical indicators of agricultural and livestock products trade flows
Agricultural products Livestock products
Cereals Roots and Tubers Pulses Oil crops Vegetables Fruits Meat
Barley Potatoes Beans, Dry Soybeans Cabbages and other brassicas Apples Cattle
Maize Sweet potatoes Broad beans,
Horse beans, Dry
Cucumbers and gherkins Bananas Sheep
Rice Peas, Dry Tomatoes Grapes Goat
Sorghum Oranges Chicken
Wheat Pears Pig
Tangerines Mandarins Clementines Satsumas
3.1.2 National biocapacity and ecological footprint of the “Belt and Road” initiative countries in 2014
In 2014, the average global ecological footprint was 2.84 gha, biocapacity was 1.68 gha, and the overload rate was 69%. China’s ecological footprint was 3.71 gha, biocapacity was 0.98 gha, and the overload rate was 280%. In 2014, the biocapacity and ecological footprint of most countries along the corridor of the “Belt and Road” Initiative were close to the global average, i.e., they generally had an ecological deficit. The average global biocapacity and ecological footprint can be divided roughly into five categories (Table 2, Fig. 2).
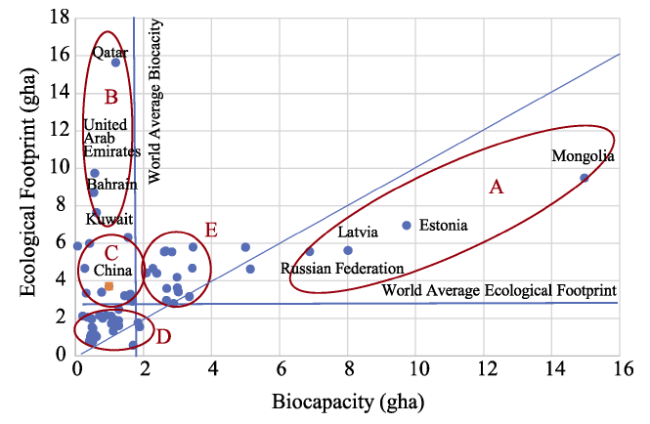
Table 2 Five types of carrying capacity characteristics of the countries along the “Belt and Road” region
Type Carrying capacity characteristics Countries Resources and socioeconomic development characteristics
A Ecological reserve countries with high biocapacity and large ecological footprint Northeast Asia and some eastern European countries Except for Mongolia, the Human Development Index (HDI) is relatively high. The land types are mainly forest and cropland
B Ecological deficit countries with low biocapacity and large ecological footprint Gulf countries, such as Qatar and the United Arab Emirates The HDI is relatively high. These countries have barren land, but abundant oil reserves. The national income leads world incomes. These extremely important locations provide transportation hubs for Asia, Africa, and Europe
C Ecological deficit countries with low biocapacity and relatively small ecological footprint China and some west Asian countries, such as Israel, Lebanon, and Iran The HDI is of a medium or high level. These countries are generally emerging economies or have mineral resources extraction as their pillar industry
D Low biocapacity and small ecological footprint countries, mostly experiencing ecological deficit Most of south, southeast, central, and West Asia, north Africa, and some eastern European countries Most “Belt and Road” countries with lower HDI fall into this category, generally with emerging economies or least-developed countries with a low resource background and a low level of economic development
E Biocapacity and ecological footprint slightly above the global averages Most eastern European countries The HDI is relatively high. These countries have rich mineral resources and a developed industrial level. After the drastic changes in the Soviet Union and eastern Europe, these countries entered a difficult period of economic and political transition.
Fig. 2 Ecological footprint and biocapacity of the “Belt and Road” countries in 2014

3.2 Changes in China’s biocapacity and ecological footprint from 1961 to 2014

From 1961 to 2014, China’s biocapacity increased slowly and its ecological footprint increased rapidly (Fig. 3). From the end of the 1960s, China began to experience an ecological deficit. Especially since the beginning of the 21st century, the rapid improvement in China’s ecological footprint has intensified its ecological deficit, but the degree of deficit has slowed down since 2010, and China’s overload rate in 2014 was 280%.
Fig. 3 China’s total biocapacity and ecological footprint from 1961 to 2014
Considering the proportions of biocapacity for the five land types (Fig. 4), the largest proportion before the 1970s was forest land, followed by cropland, grazing land, fishing grounds, and built-up land. By 2014, the largest proportion was cropland, followed by forest land, built-up land, grazing land, and fishing grounds. After the 1970s, the biocapacity of cropland exceeded that of forest land, and the proportion of cropland biocapacity within the total biocapacity increased from 28.0% in 1961 to 49.2% in 2014. The biocapacity of forest land first decreased and then increased, with a turning point around 1990. The biocapacity of grazing land first increased slowly and then stabilized. The biocapacity of fishing grounds decreased slightly.
The biocapacity of built-up land grew rapidly to surpass that for fishing grounds in the late 1970s and that for grazing land in 2005.
Fig. 4 China’s biocapacity by land types(a); China’s ecological footprint by land types(b).
China’s ecological footprint is dominated by its carbon footprint. The rapid growth of China’s carbon footprint during the 21st century has become the most important reason for its ecological deficit. The proportion of China’s carbon footprint has increased from 29.3% in 1961 to 69.5% in 2014. The ecological footprint of cropland also increased significantly. However, the increases in the ecological footprints of the remaining land types are not obvious.
From the perspective of the biocapacity of various types of land, cropland has always been overloaded and the overload rate has increased significantly since the late 1990s (Fig. 5). The biocapacity of fishing grounds has decreased slowly, while the ecological footprint continued to increase and it has been overloaded since the 1990s. The biocapacity of forest land experienced a turning point in 1990: i.e., it had previously decreased and then increased thereafter, while the fluctuation of its ecological footprint increased and then increased rapidly after 2005. Therefore, the surplus rate decreased before 1990, but then increased, and decreased again after 2005. Grazing land has experienced an overloaded state since the 1970s and the overload rate has increased gradually.
Fig. 5 Ecological overload rates of major land types in China

3.3 Characteristics of the production, consumption, import and export volumes of China’s agricultural and livestock products in 2005-2014

In 2005-2014, production of the six categories of agricultural products showed upward trends. The production of cereals and vegetables was relatively high, while that of pulses and oil crops was very low. Consumption was also dominated by cereals and vegetables, followed by fruits, roots and tubers, and finally oil crops and pulses. The consumption of oil crops was significantly higher than that of pulses, but the production was similar.
The total production of the five livestock products also showed upward trends (Fig. 6). Pork production showed significant fluctuations with a large rate of change, while the production of other products increased slowly. Pork production comprises about 70% of the total, while chicken meat production comprises about 15%, with the remainder being beef and mutton production. The consumption of livestock products is also on the rise, with pork consumption as the mainstay, followed by chicken, beef, sheep, and goat meat.
Fig. 6 China’s production and consumption of agricultural and livestock products
From 2005 to 2014, China’s agricultural and livestock products showed trends of increasing imports and decreasing exports (Fig. 7). The net import of oil crops was significantly higher than the other five types of agricultural products and increased rapidly. The net import volume in 2014 was nearly three times than that of 2005, and the self-sufficiency rate of soybeans decreased from 38.3% in 2005 to 18.4% in 2014.
Fig. 7 China’s import and export of agricultural and livestock products for 2005-2014
Since 2009, cereals have changed from net exports to net imports, with increasing fluctuation in the net import volume. By 2014, 3.28% of cereal consumption was dependent on imports. Vegetables and roots and tubers have always been net exports with slowly increasing volumes, while fruits and pulses were net exports before 2013, but were later converted to net imports.
The five livestock products were generally net imports, with the main net import being chicken meat. Chicken, sheep, and cattle meat have always been net imports, while pork changed from a net export to a net import in 2010. Since then, fluctuations in the net import volume increased. The goat meat trade was relatively small and it was generally a net export. The increases in consumption of mutton and beef have led to significant increases in their net imports in recent years.

3.4 Trade characteristics of mainland China and the “Belt and Road” countries from 2005 to 2014

China’s global share of trade in cereals, oil crops, and meat generally comprise net imports, while trade in roots and tubers, vegetables, fruits, and pulses generally comprise net exports (Fig. 8). The trade in cereals and oil crops in the countries along the “Belt and Road” Initiative are generally net imports, while roots and tubers, vegetables, fruits, pulses, and meat are generally net exports. Although China’s meat trade on a global scale is a clear net import, it is always a net export for the countries along the “Belt and Road” Initiative. The trade in fruits, vegetables, and roots and tubers is highly dependent on the individual consumer markets along the “Belt and Road” Initiative, with net exports comprising around 80%, 45%-60%, and 80%-90%, respectively. The dependence on the production of cereals along the “Belt and Road” Initiative increased from 5.7% in 2008 to 32.6% in 2016 (Table 3).
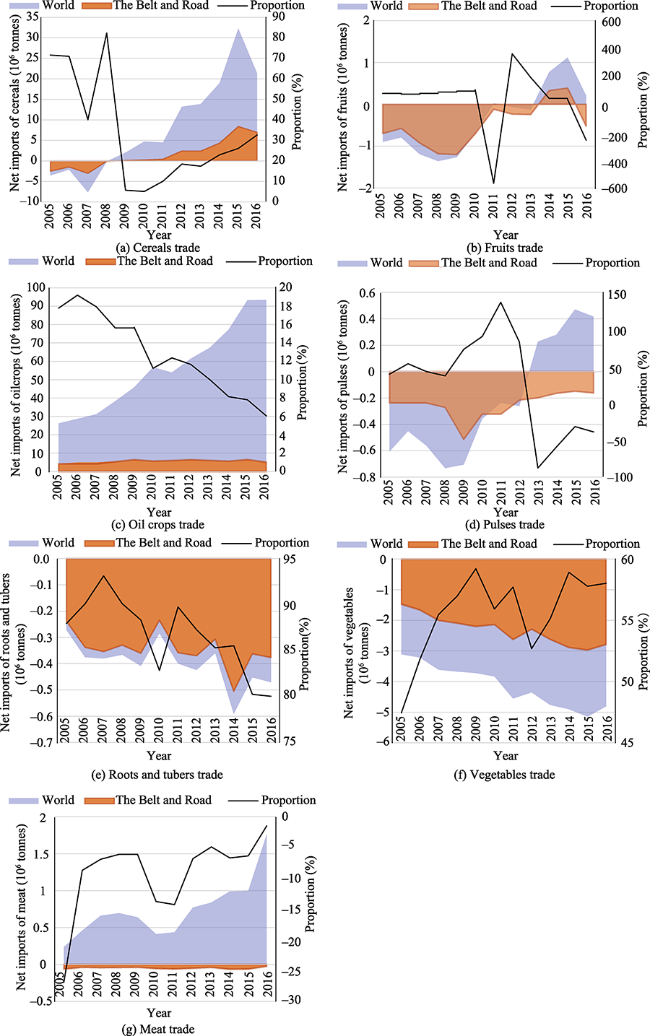
Fig. 8 Global share and China’s trade with the “Belt and Road” countries between 2005-2016
Table 3 Agricultural and livestock product trade characteristics between mainland China and the “Belt and Road” countries for 2005-2014
Categories Trade characteristics for the “Belt and Road” countries Global trade characteristics
Cereals Since 2008, net imports account for an increase in the global share, increasing from 5.7% in 2008 to 32.6% in 2016 The net import volume of global trade since 2008 has increased rapidly
Fruits Net imports were observed in 2014 and 2015, while the remaining years were net exports. The slowly increasing net exports trade with “Belt and Road” countries comprises 80% of the global share From 2010 to 2013, global trade gradually changed from net exports to net imports
Oil crops Always net imports. While the change in net import volume was small, the share of trade fell from 16.0% in 2005 to 5.5% in 2016 Always net imports. The volume increased rapidly
Pulses Always net exports Global trade has changed from net exports to net imports since 2013
Roots and tubers Always net exports. The proportion is generally between 80% and 90%, with a downward trend Always net exports
Vegetables Always net exports. The net export volume is gradually increasing, comprising between 45% and 60% of trade Always net exports. The net export volume is increasing gradually
Meat Always net exports, but the export volume is not large Always net imports. The net import volume is increasing
In the spatial distribution of mainland China’s agricultural and livestock products trade, import concentrations are usually high, and agricultural products are generally imported from the Americas and southeast Asia, while livestock products are generally imported from the Americas, Oceania, and Europe (Figures 9-11). The exports of pulses, fruits, vegetables, and roots and tubers are relatively scattered; i.e., the export volumes of cereals and oil crops were significantly reduced and exports are gradually concentrated in North Korea, South Korea, and Japan. Agricultural and livestock products with increased imports have experienced growing dependence on specific regions; for products with reduced exports, the range of exporting countries tended to shrink.
Fig. 9 Trade flows for vegetables, roots and tubers, and pulses in 2014 (tonnes)
Fig. 10 Trade flows for oil crops and fruits in 2014 (tonnes)
Fig. 11 Trade flows for cereals and meat in 2014 (tonnes)

Note: Values represent net imports or net exports, and only include the trade volume with major trading partners in the mainland of China

Cereal imports are mainly concentrated in countries such as Canada, the United States, Australia, France, and southeastern Asian countries, such as Thailand, Vietnam, and Myanmar. The export volume of barley and wheat was very small, while the exports of other cereals were reduced gradually. Exports tend to be concentrated in countries such as South Korea, North Korea, and Japan. Many soybean imports have come from the Americas, including Canada, the United States, Argentina, and Brazil, which have increased import dependence, and exports were generally to North Korea, South Korea, and Japan. Roots and tubers are mainly exported to Russia, Mongolia, Malaysia, Vietnam, Japan, and South Korea. Pulses are closely traded with southern, southeastern, and western Asia, and North Africa. Vegetables are mainly exported to Vietnam, Thailand, Malaysia, Japan, Russia, Mongolia, and Kazakhstan. Fruit imports are relatively concentrated in southeast Asia, the Americas, and Oceania. Banana imports are relatively large, with imports from the “Belt and Road” countries, such as the Philippines, Vietnam, and Myanmar. Some tangerines are imported from Thailand. Apple, grape, pear, and orange imports depend on the Americas and Oceania. Fruit exports are mainly concentrated along the “Belt and Road” countries in the northern, southern, southeastern, and central Asia.
The import demand for livestock products continues to increase, mainly relying on the Americas and Oceania. In 2014, pork imports became more dependent on Europe. The import concentration of beef and mutton is very high, with usually more than 95% depending on the Americas and Oceania. Exports also tend to be concentrated in specific areas. In 2005, North Korea, Kazakhstan, and countries in eastern Europe and western Asia had a certain amount of trade with mainland China. In 2010, the export trade gradually shifted to Malaysia, North Korea, and western Asia. By 2014, there was a large amount of trade only with Malaysia and Kyrgyzstan.

3.5 The significance of China’s agricultural and livestock product trade for resource ecology

In 2014, among the six categories of agricultural products, the net imports of virtual land for oil crops comprised 88.15%, followed by cereals. Vegetables and roots and tubers behave as net exports of virtual land. The net import of virtual land for the six types of agricultural products was 26.75 million ha, which is equivalent to the import of 146.75 million gha of biocapacity. The ecological deficit of China’s cropland was 142.25 million gha and the virtual land import compensated for 1.03 times the cropland ecological deficit (Table 4). The beef and mutton products imported a total of 85.56 million ha of virtual land, which is equivalent to the import of 31.98 million gha of biocapacity. The ecological deficit of Chinese grazing land was 49.16 million gha in 2014, which was equivalent to 0.65 times the grazing land ecological deficit.
Table 4 The significance of the common agricultural and livestock products trade in 2014 in compensating for the ecological deficit
Category Product Virtual land imports (ha) Biocapacity imports (gha) Deficit (gha) Ratio
multiple
Cropland Cereals 3210164
Fruits 48553
Oil crops 23581359
Pulses 161807
Roots and tubers -31801
Vegetables -217273
Total 26752809 146748776 142246495 1.03
Grazing land Cattle 840092
Sheep 84721539
Total 85561631 31982635 49161140 0.65

4 Discussion

4.1 Change trends of biocapacity and ecological footprint and their driving factors

In China, forest land is the only type of land held in ecological reserve. In addition to the rich resource background of forest land, the formulation of policies and regulations and the implementation of key ecological projects in forestry have also promoted their recovery (Fan, 2002). The biocapacity of forest land returned to the level it had in 1961 by around 2007, and it has continued to increase since then. However, the biocapacity of cropland has increased faster and it became the land type with the largest biocapacity in the 1970s. Population growth and the improvement of living standards have also contributed to the rapid increase in the ecological footprint and the increased overloading of cropland. The grazing land area comprises more than 40% of the country’s land area, but meat supplies still depend on imports from the Americas and Oceania. The majority of available land is used as low- and medium-yield grazing land, and it often suffers from serious local degradation. Compared with China’s intensive agricultural production mode, the grazing land utilization mode is relatively extensive, which leads to a poorly implemented large-scale industrial development, with low input and low economic output. In 2015, the carcass production of cattle and sheep in China was only half that of the United States. Changes in dietary structure have also increased the proportion of meat consumption.
Some studies have classified the characteristics of national biocapacity and ecological footprint trends per capita. In the “Belt and Road” countries from 1961 to 2007, most of south Asia, west Asia, North Africa, eastern Europe, some southeast Asian countries, and China belong to the “scissors” type (Fig. 12a), which generally applies to either industrialized countries with high consumption and low demographic increases or to emerging countries whose economies and demographic trends are still in transition. Other southeast Asian countries generally belong to the “wedge” (Fig. 12b) and “descent” types (Fig. 12c). The wedge type indicates that biocapacity is falling rapidly due to population increase, and sometimes due to either exports of raw materials and agricultural products or to deforestation. Descent-type countries have experienced serious economic downturns, natural disasters, or conflict-related crises (Niccolucci et al., 2012).
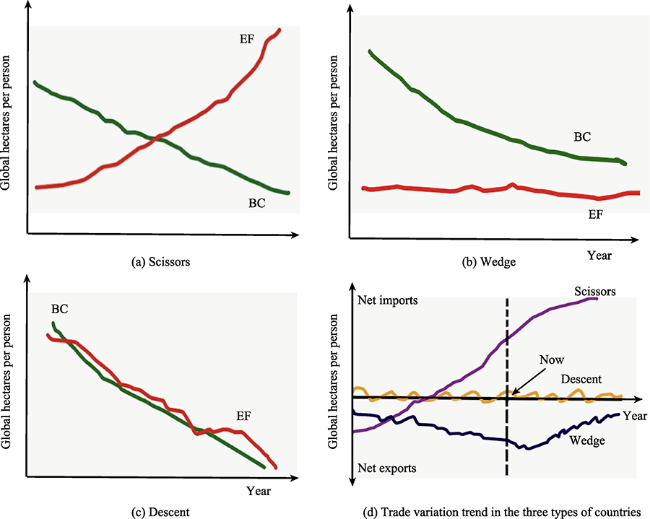
Fig. 12 Three types of countries classified by their relationship between biocapacity (BC) and ecological footprint (EF)

Note: Fig. 12 (a)(b) and (c) are quoted directly from Niccolucci et al.(2012).

When there is an ecological deficit, the region is importing biocapacity through trade or liquidating regional ecological assets, or it is emitting wastes into a global commons, such as the atmosphere. For some developed countries which belong to the “scissors” type, ecological deficits can be alleviated through industrial restructuring, energy conservation, emission reduction, or international carbon trade. Therefore, the trade curve of such countries changes from net exports to net imports, and net imports continue to increase, but the growth rate may decrease in the future. As shown in Fig. 1d, among the scissors-type countries, the overload rates of Asian countries generally increase, while those of eastern European countries decrease. For underdeveloped countries, however, overload conditions are often difficult to contain or convert from surplus to overload because of population, political, and economic conditions, industrial structures, or environmental governance awareness. In the “wedge” type countries with environmental degradation and resource depletion, the raw material export trade will be greatly reduced and imports of agricultural and livestock products will increase, resulting in a decrease in net export volume and even a shift to net imports. Most of the “descent” type countries were classified as being the least developed, which may lead to a volatile trading market (Fig. 12d).

4.2 The role of trade in compensating for the ecological deficit

China’s oil crops and meat imports are highly concentrated and the interference of political and socioeconomic factors will seriously affect the balance of supply and demand in the domestic market. Therefore, we should tap the development potential of the domestic market to ensure agricultural self-sufficiency for land-intensive products. We should combine the importation of products with easing the pressure on resources and the environment to transform the mode of production, adopt import market diversification strategies, improve both international agriculture and livestock product market monitoring and early warning mechanisms, and strengthen trade regulation capabilities (Guo, 2017; Han et al., 2018; Liu et al., 2018; Wu et al., 2018; Zhang, 2018). Agricultural and livestock production has a great impact on land, water, energy, air, other resources, and the environment. For products with high export comparative advantages, the product structure should be adjusted, added value should be increased, and new trade barriers should be addressed (Wu and Xie, 2016).
From 1986 to 2009, China’s net imported virtual land products were transformed from cereals to oil crops (Qiang, 2013). In 2012, a total of 33.67 million ha of virtual land was imported for edible oilseeds, raw cotton, cereals, sugar, fruits, and vegetables (Wang et al., 2015). However, raw cotton and sugar are land-intensive products. Because of the differences in statistical indicators for China’s many imports, the calculation results will likely differ from the results in this paper.

4.3 Cooperation prospects based on complementary resources

China mainly imports textile raw materials, horticultural products, livestock products, processed agricultural products, cereals, and oils from “Belt and Road” countries, and it exports mainly horticultural products, and processed agricultural and livestock products (Wang and Wu, 2017). China has obvious advantages in agricultural production technologies and capital, but lacks agricultural resources. Therefore, the production of land-intensive products such as cereals, cotton, oil, and sugar lacks advantages, while some labor-intensive products, such as vegetables, fruits, and aquatic products, have certain export potential (Guo, 2017). Northeast and central Asia are rich in land resources, but require extensive management and cropland is seriously idle. The agricultural production technology in west Asia is good, with well-developed animal husbandry. Southeast Asia is an important area for producing items such as sugar cane, rice, tropical fruits, and natural rubber, but the agricultural infrastructure is not good and lacks labor. South Asia is rich in jute, tea, wheat, rice, but the risk of natural disasters is serious. Agricultural development conditions in eastern Europe are good, but its infrastructure is antiquated and food production is unstable. Therefore, combined with the advantages of China’s abundant labor resources, vigorously developing overseas agricultural cooperation can effectively alleviate the shortage of land resources in China (Li et al., 2016; Wang and Wu, 2017; Li, 2018; Yu and Zhang, 2018). China and other “Belt and Road” countries have complementary resources, product structures, and technical funds. Developing scientific and technological cooperation and trade in agriculture and animal husbandry will not only help ensure China’s national food security, but also provide an opportunity for the development of animal husbandry in western China. Such developments would also play a key role in stabilizing regional ecological and socioeconomic development (Li, 2016; Wei and Wu, 2017; Li et al., 2018).

5 Conclusions

The vast majority of the “Belt and Road” countries in 2005-2014 were always overloaded, with an increasing degree of overloading. China began to experience an ecological deficit in the late 1960s and the rate of overloading increased rapidly. Cropland is responsible for the largest proportion of biocapacity, while the ecological footprint is dominated by the carbon footprint.
In 2005-2014, upward trends were observed in the production and consumption of selected agricultural and livestock products in mainland China. The production and consumption of cereals and vegetables comprised the largest proportions of agricultural products, and those of pork and chicken accounted for 85% of livestock products. The share of the cereals trade in “Belt and Road” countries is gradually increasing, while that of oil crops has decreased rapidly. The trade flow of agricultural and livestock products in mainland China shows an overall trend of increasing imports and decreasing exports over time, which increases dependence on specific regions.
The import trade has alleviated ecological deficits to some extent. For example, the six types of agricultural products, and livestock products represented by beef and mutton, compensated for 1.03 times the cropland deficit and 0.65 times the grazing land deficit.
While ensuring basic food self-sufficiency, we should promote the diversification of the import market for land-intensive products, and strengthen scientific and technological cooperation with the “Belt and Road” countries, which will help to ensure national food security, provide opportunities for the development of animal husbandry in western China, and promote stable socioeconomic development in the region.
1
Bicknell B, Ball R J, Cullen R , et al. 1998. New methodology for the ecological footprint with an application to the New Zealand economy. Ecological Economics, 27(2):149-160.

DOI

2
Dong S K, Zhu X X, Liu S L , et al. 2013. Crisis of pastoralism associated with global changes and coupled human-natural systems for sustainable pastoralism worldwide. Chinese Journal of Grassland, 35(4):1-6. (in Chinese)

3
Fan B M . 2002. Study on History of Forestry Policy of China since Qing Dynasty. PhD diss., Beijing Forestry University. ( in Chinese)

4
Guo T B . 2017. Study on Dilemma and Way out of China’s Soybean Production. PhD diss, Jilin Agricultural University. ( in Chinese)

5
Han C X, Chen Y Y, Liu H G . 2018. Characteristics and development trend of China’s agricultural products trade. Agricultural Outlook, 14(6):83-89.

6
Li D L, Liu J H, Hao L G , et al. 2018. Analysis of water-food-energy safety in Africa area of “Belt and Road”. Water Resources Protection, 34(4):22-28.

7
Li F J, Dong S C, Yuan L N , et al. 2016. Study on agriculture patterns and strategy of the “Belt and Road”. Bulletin of Chinese Academy of Sciences, 31(6):678-688.

8
Li Y M . 2018. Food security issues and sino-foreign cooperation opportunities along the “Belt and Road”. World Agriculture, (6):29-36.

9
Liu Q J . 2017. Analysis of resources along the “Belt and Road”. Review of Economic Research, 15:70-104.

10
Liu Y, Luo Q Y, Ma L Y , et al. 2018. Analysis on the trade situation and reasonable import scale of China’s agricultural products. Engineering Sciences, 20(5):128-134.

11
Niccolucci V, Tiezzi E, Pulselli F M , et al. 2012. Biocapacity vs ecological footprint of world regions: A geopolitical interpretation. Ecological Indicators, 5(16):23-30.

12
Qiang W L, Liu A M, Cheng S K , et al. 2013. Quantification of virtual land resources in China’s crop trade. Journal of Natural Resources, 28(8):1289-1297.

DOI

( in Chinese)

13
Sun Z L, Li X D . 2015. Current situation and prospects of grain production along the “Belt and Road”. World Agriculture, (12): 253, 251-258.

14
Wackernagel M, William E R . 1996. Our ecological footprint: Reducing human impact on the Earth. New Society Publishers, 1(3):171-174.

DOI PMID

15
Wang B, Zhu Y C . 2017. The prospect research about agricultural cooperation between China and countries along the silk road economic belt—based on the angle of complementary advantages and cooperative path. China Business and Market, 31(11):103-111. (in Chinese)

16
Wang Y F, Feng R X, Guo T B . 2015. Benefit analysis of virtual land import of main agricultural products in China. Journal of Agrotechnical Economics, (4):26-35.

DOI PMID

17
Wang Z H, Wu Y Q . 2017. Study on strengthening agricultural trade cooperation with countries and regions along the “Belt and Road”. China Development, 17(4):38-44. (in Chinese)

18
Weber K T, Shannon H . 2011. Desertification and livestock grazing: The roles of sedentarization, mobility and rest. Pastoralism: Research, Policy and Practice, 1(19):1-11.

DOI

19
Wei H, Wu J . 2017. The status quo and solutions about China’s imports from countries along the “Belt and Road”. People’s Forum Academic Frontier, 9:67-73.

20
William E R . 1992. Ecological footprint and appropriated carrying capacity: What urban economics leaves out. Environment and Urbanization, 6(2):121-130.

21
Wu L J, Xie S H . 2016. International trade of agricultural product under the background of “One Belt and One Road”. Journal of Anhui Agricultural Sciences, 44(2):266-268. (in Chinese)

DOI PMID

22
Wu Y, Gao S, Gao Y K , et al. 2018. Evaluation of import dependency risk for livestock products in china based on food security. Acta Prataculturae Sinica, 27(10):171-182.

23
Yan Z Q, Yan Z X, Hu B Q , et al. 2007. Theoretical discussion on virtual land, virtual land strategy and regional land resources optimal allocation management. Guangxi Social Sciences, (10):70-74. (in Chinese)

24
Yu H L, Zhang Z . 2018. Potential, risk and countermeasure in foreign agriculture cooperation under the “Belt and Road” initiative. On Economic Problems,(2): 108-112,122.

25
Zhang C X, Wang Y K . 2018. Risk analysis and evasion measures for the rapid increase of China’s grain imports. Statistics and Management, (6):120-124.

26
Zhang Y H . 2018. Differentiation and analysis of several basic problems of grain security in China. Issues in Agricultural Economy, (5):27-33.

Outlines

/