
Journal of Resources and Ecology >
Analysis of Water Resources Carrying Capacity of the “Belt and Road” Initiative Countries based on Virtual Water Theory
Received date: 2019-06-29
Accepted date: 2019-08-29
Online published: 2019-12-09
Supported by
The Tibetan Scientific-Technology Project(Z2016C01G01/04)
The National Natural Science Foundation of China(41571496)
The National Key Research and Development Programme(2016YFC0503403)
Copyright
Most countries along the route of the “Belt and Road” initiative are faced with a shortage of water resources. However, successful implementation of the initiative depends on water availability to support economic and social development. We designed a water resources carrying capacity evaluation index system, assigned grades and weights to each evaluation index and calculated a water resources carrying index for the 65 countries along the route. We used virtual water theory to analyze China’s net virtual water import from key bulk agricultural products through international trade. For more than half of the countries along the route, their water resources will be unable to support the economic development that will be necessary for fulfilling the goals of the Initiative. As a country with insufficient water resources carrying capacity, China is a net virtual water importer in the virtual water trade. This virtual water trade can improve China’s water resources support capacity, and ensure China’s water and food security for the future.
ZHENG Xin , XU Zengrang . Analysis of Water Resources Carrying Capacity of the “Belt and Road” Initiative Countries based on Virtual Water Theory[J]. Journal of Resources and Ecology, 2019 , 10(6) : 574 -583 . DOI: 10.5814/j.issn.1674-764X.2019.06.002
Table 1 Regions and countries along the “Belt and Road” initiative |
| Regions | Countries | Total |
|---|---|---|
| Southeast Asia | Vietnam, Laos, Cambodia, Myanmar, Thailand, Malaysia, Singapore, Indonesia, Philippines, Brunei, Timor-Leste | 11 |
| Eastern Europe | Estonia, Latvia, Lithuania, Belarus, Ukraine, Moldova | 6 |
| Southern Europe | Serbia, Montenegro, Croatia, Slovenia, Bosnia and Herzegovina, Romania, Macedonia, Bulgaria, Albania | 9 |
| South Asia | Sri Lanka, Maldives, Pakistan, India, Bangladesh, Nepal, Bhutan, Afghanistan | 8 |
| West Asia | Iran, Turkey, Syria, Lebanon, Palestine, Israel, Jordan, Iraq, Kuwait, Saudi Arabia, Yemen, Oman, United Arab Emirates, Qatar, Bahrain, Georgia, Armenia, Azerbaijan | 18 |
| Central Europe | Poland, Czech Republic, Slovakia, Hungary | 4 |
| Central Asia | Turkmenistan, Uzbekistan, Kyrgyzstan, Tajikistan, Kazakhstan | 5 |
| Other | Egypt, China, Mongolia, Russia | 4 |
Table 2 Water resources carrying capacity evaluation index system for countries along the route of the “Belt and Road” initiative |
| Evaluation criteria | Index | Index selection basis |
|---|---|---|
| Water resources condition | Water resources per capita | This criterion reflects regional water resources conditions and is a common index for evaluating water resources. |
| Economic and social development | GDP per capita | This criterion reflects the economic development and people’s living standards of all countries. |
| State of ecological environment condition | Forest coverage | Forest has an important influence on evaporation, precipitation, runoff and other water balance factors, and it reflects the impact of surface storage capacity on water resources. |
Table 3 Evaluation grades of water resources carrying capacity indices |
| Index | Evaluation grade | ||||
|---|---|---|---|---|---|
| V1 | V2 | V3 | V4 | V5 | |
| Water resources per capita | ≤500 | 500 - 1000 | 1000 - 2000 | 2000 - 3000 | > 3000 |
| GDP per capita | ≤3956 | 3956 - 6716 | 6716 - 9475 | 9475 - 12 235 | > 12 235 |
| Forest coverage | ≤15 | 15 - 30 | 30 - 45 | 45 - 60 | > 60 |
Table 4 Classification of water resources carrying index |
| The bearing state | Severely overload | Moderately overload | Mildly overload | Suitably load | Fully load |
|---|---|---|---|---|---|
| Water resources carrying index | 1 | 1-2 | 2-3 | 3-4 | 4 |
Table 5 Data sources for the three evaluation indices |
| Index | The data source | Year | Note |
|---|---|---|---|
| Water resources per capita (m3 in hab-1 yr-1) | Food and Agriculture Organization of the United Nations (http://www.fao.org/nr/water/aquastat/data/query/index.html?Lang=enWebsite) | 2014 | The missing Montenegro data were obtained from: Meško et al. (2011). |
| GDP per capita (current US$) | The World Bank, World Development Indicators data (https://data.worldbank.org.cn/indicator/NY.GDP.PCAP.CD) | 2014 | Syrian GDP per capita in 2014 is missing, so it was replaced by the 2007 figure. |
| Forest coverage (% of land area) | The World Bank, World Development Indicators data (https://data.worldbank.org/indicator/AG.LND.FRST.ZS?View=chart) | 2014 | Data refer to the ratio of forest area to the total land area. |
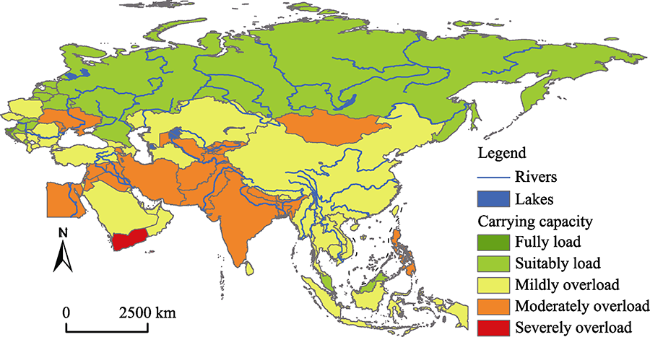
Fig. 1 Water resources carrying capacity of 65 countries along the route of the “Belt and Road” initiativeNote: This map is based on the standard map GS(2016)1663 downloaded from the Standard Mapping Service website of the Ministry of Natural Resources of the People’s Republic of China. The base map has no modification. |
Table 6 Countries in a moderately overloaded condition |
| No. | Country | Level | y1 | Level | y2 | Level | y3 | WRCI |
|---|---|---|---|---|---|---|---|---|
| 1 | Jordan | V1 | 1.00 | V2 | 1.04 | V1 | 1.00 | 1.017 |
| 2 | Egypt | V2 | 1.18 | V1 | 1.00 | V1 | 1.00 | 1.042 |
| 3 | Syria | V2 | 1.84 | V1 | 1.00 | V1 | 1.00 | 1.195 |
| 4 | Pakistan | V3 | 2.25 | V1 | 1.00 | V1 | 1.00 | 1.291 |
| 5 | Uzbekistan | V3 | 2.53 | V1 | 1.00 | V1 | 1.00 | 1.356 |
| 6 | Afghanistan | V3 | 2.84 | V1 | 1.00 | V1 | 1.00 | 1.428 |
| 7 | India | V3 | 2.43 | V1 | 1.00 | V2 | 1.59 | 1.537 |
| 8 | Tajikistan | V4 | 3.46 | V1 | 1.00 | V1 | 1.00 | 1.571 |
| 9 | Armenia | V4 | 3.65 | V2 | 1.01 | V1 | 1.00 | 1.623 |
| 10 | Iran | V3 | 2.69 | V2 | 1.57 | V1 | 1.00 | 1.633 |
| 11 | Bangladesh | V5 | 4.00 | V1 | 1.00 | V1 | 1.00 | 1.698 |
| 12 | Kyrgyzstan | V5 | 4.00 | V1 | 1.00 | V1 | 1.00 | 1.698 |
| 13 | Moldova | V5 | 4.00 | V1 | 1.00 | V1 | 1.00 | 1.698 |
| 14 | Mongolia | V5 | 4.00 | V2 | 1.08 | V1 | 1.00 | 1.732 |
| 15 | Ukraine | V5 | 4.00 | V1 | 1.00 | V2 | 1.11 | 1.738 |
| 16 | Maldives | V1 | 1.00 | V3 | 2.85 | V1 | 1.00 | 1.774 |
| 17 | Lebanon | V2 | 1.48 | V3 | 2.70 | V1 | 1.00 | 1.825 |
| 18 | Nepal | V5 | 4.00 | V1 | 1.00 | V2 | 1.69 | 1.939 |
| 19 | Iraq | V4 | 3.35 | V2 | 2.00 | V1 | 1.00 | 1.963 |
| 20 | Philippines | V5 | 4.00 | V1 | 1.00 | V2 | 1.85 | 1.995 |
Note: y is the score of the index, which is 1 for water resources per capita, 2 for GDP per capita, and 3 for forest coverage. |
Table 7 Countries in mildly overloaded condition |
| No. | Country | Level | y1 | Level | y2 | Level | y3 | WRCI |
|---|---|---|---|---|---|---|---|---|
| 1 | Sri Lanka | V4 | 3.53 | V1 | 1.00 | V3 | 2.19 | 2.005 |
| 2 | Albania | V5 | 4.00 | V2 | 1.23 | V2 | 1.87 | 2.097 |
| 3 | China | V3 | 2.97 | V3 | 2.35 | V2 | 1.49 | 2.195 |
| 4 | Bahrain | V1 | 1.00 | V5 | 4.00 | V1 | 1.00 | 2.256 |
| 5 | Israel | V1 | 1.00 | V5 | 4.00 | V1 | 1.00 | 2.256 |
| 6 | Kuwait | V1 | 1.00 | V5 | 4.00 | V1 | 1.00 | 2.256 |
| 7 | Oman | V1 | 1.00 | V5 | 4.00 | V1 | 1.00 | 2.256 |
| 8 | Qatar | V1 | 1.00 | V5 | 4.00 | V1 | 1.00 | 2.256 |
| 9 | Saudi Arabia | V1 | 1.00 | V5 | 4.00 | V1 | 1.00 | 2.256 |
| 10 | United Arab Emirates | V1 | 1.00 | V5 | 4.00 | V1 | 1.00 | 2.256 |
| 11 | Azerbaijan | V5 | 4.00 | V3 | 2.43 | V1 | 1.00 | 2.295 |
| 12 | Turkmenistan | V5 | 4.00 | V3 | 2.45 | V1 | 1.00 | 2.306 |
| 13 | Myanmar | V5 | 4.00 | V1 | 1.00 | V3 | 2.91 | 2.364 |
| 14 | Georgia | V5 | 4.00 | V2 | 1.17 | V3 | 2.71 | 2.367 |
| 15 | Thailand | V5 | 4.00 | V2 | 1.72 | V3 | 2.14 | 2.400 |
| 16 | Timor-Leste | V5 | 4.00 | V1 | 1.00 | V4 | 3.03 | 2.404 |
| 17 | Serbia | V5 | 4.00 | V2 | 1.81 | V3 | 2.07 | 2.413 |
| 18 | Singapore | V1 | 1.00 | V5 | 4.00 | V2 | 1.54 | 2.443 |
| 19 | Vietnam | V5 | 4.00 | V1 | 1.00 | V4 | 3.20 | 2.467 |
| 20 | Macedonia | V5 | 4.00 | V2 | 1.55 | V3 | 2.64 | 2.499 |
| 21 | Indonesia | V5 | 4.00 | V1 | 1.00 | V4 | 3.32 | 2.508 |
| 22 | Bosnia and Herzegovina | V5 | 4.00 | V2 | 1.45 | V3 | 2.85 | 2.531 |
| 23 | Cambodia | V5 | 4.00 | V1 | 1.00 | V4 | 3.52 | 2.578 |
| 24 | Bhutan | V5 | 4.00 | V1 | 1.00 | V5 | 4.00 | 2.744 |
| 25 | Laos | V5 | 4.00 | V1 | 1.00 | V5 | 4.00 | 2.744 |
| 26 | Bulgaria | V5 | 4.00 | V3 | 2.42 | V3 | 2.36 | 2.764 |
| 27 | Turkey | V4 | 3.62 | V4 | 3.96 | V2 | 1.02 | 2.857 |
| 28 | Kazakhstan | V5 | 4.00 | V5 | 4.00 | V1 | 1.00 | 2.954 |
| 29 | Romania | V5 | 4.00 | V4 | 3.20 | V3 | 2.01 | 2.970 |
| 30 | Poland | V3 | 2.59 | V5 | 4.00 | V3 | 2.06 | 2.994 |
| 31 | Czech Republic | V3 | 2.24 | V5 | 4.00 | V3 | 2.30 | 2.999 |
Note: y is the score of the index, which is 1 for water resources per capita, 2 for GDP per capita, and 3 for forest coverage. |
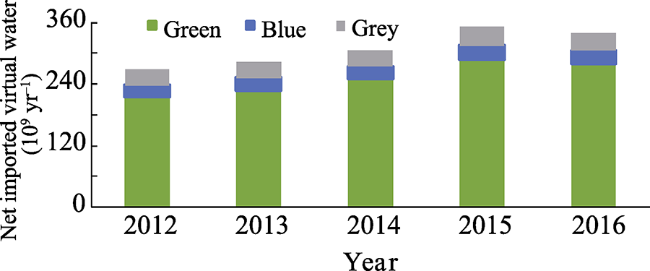
Fig. 2 Net virtual water import from major agricultural and livestock products (2012-2016) |
Table 8 Countries in suitably loaded condition |
| No. | Country | Level | y1 | Level | y2 | Level | y3 | WRCI |
|---|---|---|---|---|---|---|---|---|
| 1 | Belarus | V5 | 4.00 | V3 | 2.58 | V3 | 2.84 | 3.002 |
| 2 | Hungary | V5 | 4.00 | V5 | 4.00 | V2 | 1.53 | 3.137 |
| 3 | Montenegro | V5 | 4.00 | V3 | 2.24 | V5 | 4.00 | 3.263 |
| 4 | Croatia | V5 | 4.00 | V5 | 4.00 | V3 | 2.29 | 3.404 |
| 5 | Lithuania | V5 | 4.00 | V5 | 4.00 | V3 | 2.32 | 3.415 |
| 6 | Slovakia | V5 | 4.00 | V5 | 4.00 | V3 | 2.69 | 3.543 |
| 7 | Russia | V5 | 4.00 | V5 | 4.00 | V4 | 3.32 | 3.762 |
| 8 | Estonia | V5 | 4.00 | V5 | 4.00 | V4 | 3.42 | 3.799 |
| 9 | Malaysia | V5 | 4.00 | V4 | 3.62 | V5 | 4.00 | 3.841 |
| 10 | Latvia | V5 | 4.00 | V5 | 4.00 | V4 | 3.60 | 3.860 |
Note: y is the score of the index, which is 1 for water resources per capita, 2 for GDP per capita, and 3 for forest coverage. |
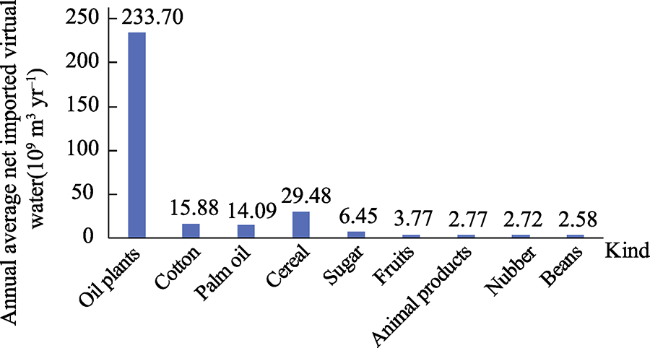
Table 9 The 15 agricultural and livestock products with the highest annual average net virtual water import values (2012- 2016) |
| Ranking | The FAO code | Agricultural and livestock products | Annual average net imported virtual water (×109 m3 yr-1) |
|---|---|---|---|
| 1 | 236 | Soya beans | 223.11 |
| 2 | 767 | Cotton lint | 15.88 |
| 3 | 257 | Palm oil | 14.09 |
| 4 | 56 | Maize | 9.22 |
| 5 | 15 | Wheat | 8.04 |
| 6 | 270 | Rapeseed | 7.39 |
| 7 | 162 | Sugar Raw Centrifugal | 6.45 |
| 8 | 83 | Sorghum | 5.45 |
| 9 | 44 | Barely | 3.87 |
| 10 | 619 | Fruit fresh nes | 3.77 |
| 11 | 289 | Sesame seed | 3.20 |
| 12 | 27 | Rice | 2.89 |
| 13 | 1035 | Meat, pig | 2.77 |
| 14 | 836 | Natural rubber | 2.72 |
| 15 | 187 | Peas, dry | 2.58 |
Table 10 Main source countries and associated net virtual water import values of 11 key bulk products |
| The FAO code | Agricultural and livestock products | Net imported virtual water (×109 m3 yr-1) | The FAO code | Agricultural and livestock products | Net imported virtual water (×109 m3 yr-1) |
|---|---|---|---|---|---|
| 236 | Soya beans | 162 | Sugar Raw Centrifugal | ||
| Brazil | 100.12 | Brazil | 3.95 | ||
| America | 84.94 | Cuba | 0.73 | ||
| Argentina | 21.40 | Thailand | 0.50 | ||
| 767 | Cotton lint | 836 | Natural rubber | ||
| America | 4.18 | Thailand | 2.48 | ||
| India | 4.04 | Malaysia | 0.09 | ||
| Australia | 2.73 | Viet Nam | 0.07 | ||
| 56 | Maize | 867 | Meat, cattle | ||
| America | 2.27 | Uruguay | 0.31 | ||
| Ukraine | 2.20 | Australia | 0.28 | ||
| Laos | 0.12 | New Zealand | 0.12 | ||
| 15 | Wheat | 977 | Meat, sheep | ||
| Australia | 2.25 | New Zealand | 0.59 | ||
| America | 2.17 | Australia | 0.40 | ||
| Canada | 1.13 | Uruguay | 0.02 | ||
| 30 | Rice | 1035 | Meat, pig | ||
| Viet Nam | 1.57 | Germany | 0.49 | ||
| Thailand | 0.62 | Spain | 0.39 | ||
| Pakistan | 0.52 | America | 0.37 | ||
| 257 | Oil, palm | ||||
| Malaysia | 6.83 | ||||
| Indonesia | 6.72 | ||||
| 1 |
|
| 2 |
|
| 3 |
Food and Agriculture Organization of the United Nations (FAO). 2011. The State of the World’s Land and Water Resources for Food and Agriculture (SOLAW) Managing Systems at Risk. London: The Food and Agriculture Organization of the United Nations and Earthscan.
|
| 4 |
|
| 5 |
|
| 6 |
|
| 7 |
|
| 8 |
|
| 9 |
|
| 10 |
|
| 11 |
|
| 12 |
|
| 13 |
|
| 14 |
|
| 15 |
|
| 16 |
National development and reform commission, the ministry of foreign affairs, the ministry of commerce. 2015. Vision and proposed actions outlined on jointly building Silk Road Economic Belt and 21st-Century Maritime Silk Road. Finance & Accounting for Communications, 4:82-87. (in Chinese)
|
| 17 |
|
| 18 |
|
| 19 |
|
| 20 |
Water Conservancy Bureau of Hydrology. 1987. Water Resources Ministry of China Evaluation. Beijing: China Water & Power Press. (in Chinese)
|
| 21 |
|
| 22 |
World Water Assessment Programme (WWAP). 2019. Leaving No One Behind: The United Nations World Water Development Report. Paris: United Nations Educational, Scientific and Cultural Organization.
|
| 23 |
|
| 24 |
|
| 25 |
|
| 26 |
|
| 27 |
|
| 28 |
|
| 29 |
|
| 30 |
|
/
| 〈 |
|
〉 |