Big Data

Spatial Distribution and Dynamic Changes in Research Hotspots for Desertification in China based on Big Data from CNKI

  • LIANG Yuting 1, 2 ,
  • HU Yunfeng , 1, 2, * ,
  • HAN Yueqi 1
Expand
  • 1. State Key Laboratory of Resources and Environmental Information System, Institute of Geographic Sciences and Natural Resources Research, Chinese Academy of Sciences, Beijing 100101, China
  • 2. College of Resources and Environment, University of Chinese Academy of Sciences, Beijing 100049, China
HU Yunfeng, E-mail:

Received date: 2019-08-07

  Accepted date: 2019-09-22

  Online published: 2019-12-09

Supported by

The National Key Research and Development Program of China(2016YFC0503701)

The National Key Research and Development Program of China(2016YFB0501502)

The Strategic Priority Research Program of Chinese Academy of Sciences(XDA19040301)

The Strategic Priority Research Program of Chinese Academy of Sciences(XDA20010202)

The Strategic Priority Research Program of Chinese Academy of Sciences(XDA23100201)

The Key Project of the High Resolution Earth Observation System in China(00-Y30B14-9001-14/16)

Copyright

Copyright reserved © 2019

Abstract

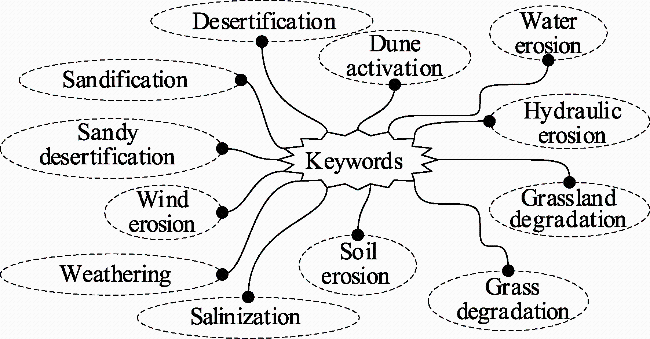
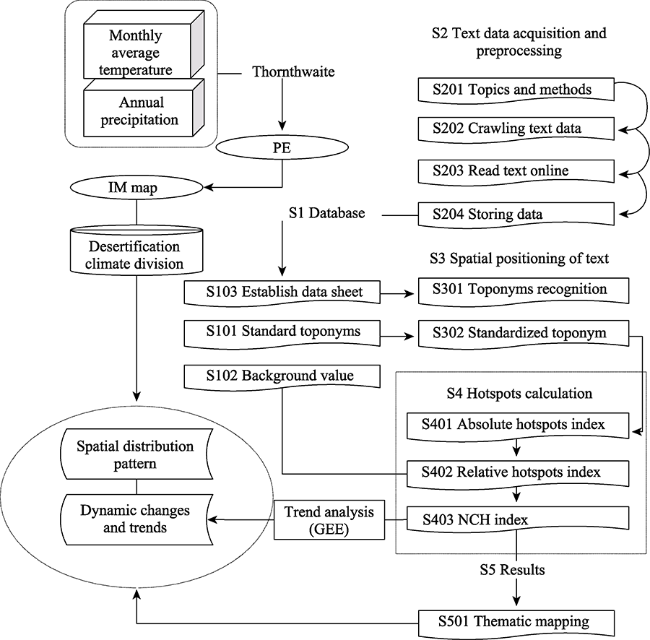
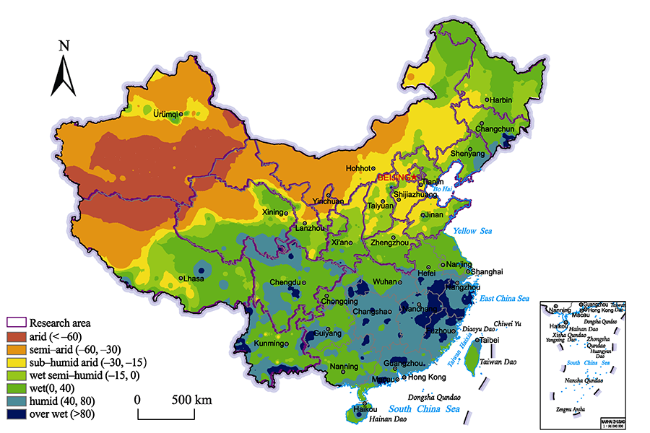
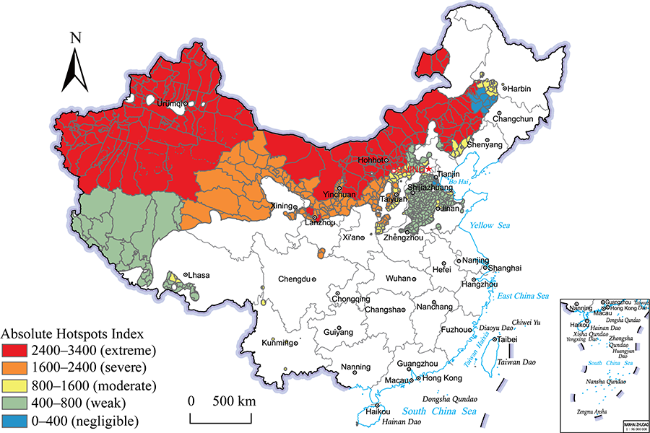
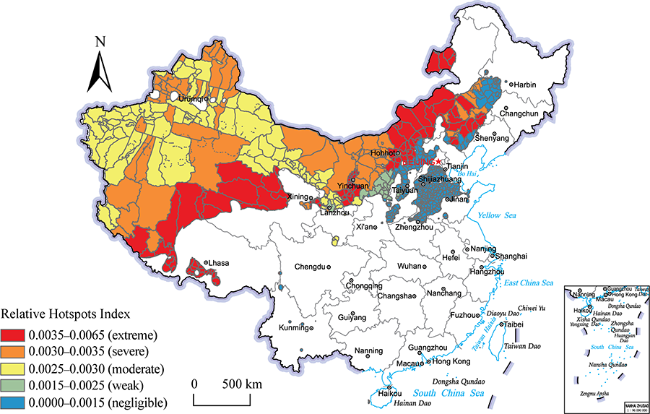
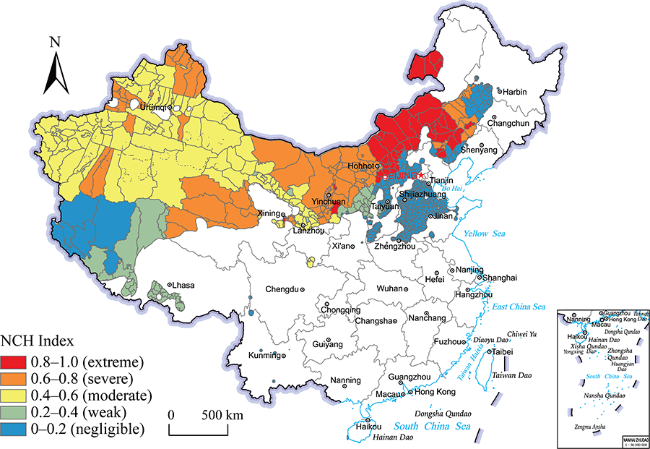
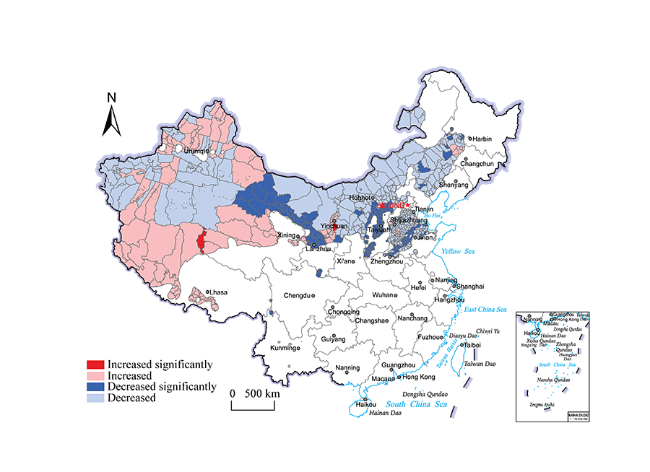
Desertification research plays a key role in the survival and development of all mankind. The Normalized Comprehensive Hotspots Index (NCH) is a comprehensive index that reveals the spatial distribution of research hotspots in a given research field based on the number of relevant scientific papers. This study uses Web Crawler technology to retrieve the full text of all Chinese journal articles spanning the 1980s-2018 in the Chinese Academic Journal full-text database (CAJ) from CNKI. Based on the 253,055 articles on desertification that were retrieved, we have constructed a research hotspot extraction model for desertification in China by means of the NCH Index. This model can reveal the spatial distribution and dynamic changes of research hotspots for desertification in China. This analysis shows the following: 1) The spatial distribution of research hotspots on desertification in China can be effectively described by the NCH Index, although its application in other fields still needs to be verified and optimized. 2) According to the NCH Index, the research hotspots for desertification are mainly distributed in the Agro-Pastoral Ecotone and grassland in Inner Mongolia, the desertification areas of Qaidam Basin in the Western Alpine Zone and the Oasis-Desert Ecotone in Xinjiang (including the extension of the central Tarim Basin to the foothills of the Kunlun Mountains, the sporadic areas around the Tianshan Mountains and the former hilly belt of the southern foothills of the Altai Mountains). Among these three, the Agro-Pastoral Ecotone in the middle and eastern part of Inner Mongolia includes the most prominent hotspots in the study of desertification. 3) Since the 1980s, the research hotspots for desertification in China have shown a general downward trend, with a significant decline in 219 counties (10.37% of the study area). This trend is dominated by the projects carried out since 2002. The governance of desertification in the eastern part of the Inner Mongolia-Greater Khingan Range still needs to be strengthened. The distribution of desertification climate types reflects the distribution of desertification in a given region to some extent. The Normalized Comprehensive Hotspots Index provides a new approach for researchers in different fields to analyze research progress.

Cite this article

LIANG Yuting , HU Yunfeng , HAN Yueqi . Spatial Distribution and Dynamic Changes in Research Hotspots for Desertification in China based on Big Data from CNKI[J]. Journal of Resources and Ecology, 2019 , 10(6) : 692 -703 . DOI: 10.5814/j.issn.1674-764X.2019.06.015

1 Introduction

According to the definition by the United Nations Convention to Combat Desertification in Those Countries Experiencing Serious Drought and/or Desertification, Particularly in Africa in 1994, desertification refers to land degradation in arid, semi-arid and dry sub-humid areas caused by various factors including climate variation and human activities (UNCCD, 1994; Dong et al., 1999). Desertification includes sandy desertification, water erosion and salinization. The main form of desertification in northern China is sandy desertification (Wang T et al., 2004). Desertification is one of the top ten environmental problems facing the world today (Zhao et al., 2019). According to the latest Bulletin on Desertification in China, the total area of desertification land in China is 2611.6 thousand km2 (or 27.20% of China’s land area) (Bulletin, 2015). More specifically, the desert and desertification areas are mainly concentrated in the land of northern China, covering about 4 million km2. Therefore, determining the status of desertification research in China is very urgent. On January 1, 2002, the Chinese Government implemented the Law of the People’s Republic of China on Sand Prevention and Sand Governance, and invested heavily in the comprehensive implementation of the “Three North” shelter forest project, the “returning farmland to forests (grass)” project, the “Beijing-Tianjin sand source control” project, and others, all of which have achieved good results (Qi and Zhao, 2006; Wang T et al., 2011; Yin, 2018). The dry and wet conditions in an area are closely related to the amount of precipitation and evapotranspiration, and they are usually reflected by the dryness index or the wetting index. The annual dryness index is the ratio of annual evapotranspiration to annual precipitation. Conversely, the ratio of precipitation to evapotranspiration is the wetness index (Zhang et al., 2016). Since a single calculation of precipitation does not accurately reflect the dry and wet conditions in an area, most scholars use the wetness index or the dryness index to measure the dry and wet conditions in an area. The Penman-Menteith formula (Wu et al., 2005; Liu and Ma, 2007; Shen et al., 2009; Zhao et al., 2010; Su et al., 2014), the Holdridge formula, and the Thornthwaite formula (Mao et al., 2011; Zhang, 1998; Zhou et al., 2002) have been the most widely used methods for calculating the wetting index since 1947. This study uses the Thornthwaite formula recommended by the Intergovernmental Negotiating Committee for the United Nations Convention to Combat Desertification (INCD) to calculate the potential evapotranspiration (Thornthwaite, 1948; Ci and Wu, 1997).
The China Knowledge Network of CNKI (China National Knowledge Infrastructure project) is the largest Chinese knowledge portal in the world. The China Knowledge Network is an important participant and witness to the digital library construction in China (Tu et al., 2019). Based on knowledge engines such as CNKI and WOS (Web of Sciences), researchers used to rely on traditional bibliometric methods to summarize literature knowledge, such as the evolution of professional noun concepts (Wang and Zhu, 2003), research methods (zhang et al., 2016; Zhou et al., 2002), research hotspots of sub-disciplinary fields (Wu, 2000), research progress in a certain field and existing scientific problems (Mao et al., 2011; Wu, 2000), and many others. For desertification research, a common method is to calculate the wetting index or the dryness index based on observation data from meteorological stations, and then to capture the characteristics of dry and wet climate changes of China in the past few decades (Su et al., 2014; Shen et al., 2009; Liu et al., 2007; Wu et al., 2005; Wang et al., 2004) or to further develop the identification of sensitive areas for desertification (Hu et al., 2018). Such articles in the knowledge engine have accumulated a large amount of professional knowledge (Wang, Chen, et al., 2016). In addition to the variety of data types relevant to desertification control, it is necessary to formulate certain systems that are suitable for desertification control. Then, the emergence of big data and the maturity of its related technology can provide strong support for desertification control (Liu, Feng, et al., 2018; Li, 2016). However, obtaining geospatial information quickly, accurately and efficiently is a key and complicated issue, but the method of geographic information collection based on Web Crawler can solve this kind of issue very well (Liao and Ren, 2019). Currently, the acquisition of information from big data by means of the Web Crawler algorithm has become a novel approach in geography research (Graham and Shelton, 2013).
The retrieval and processing of massive data through an API (Application Programming Interface) can increase the credibility of the research conclusions (Qin et al., 2009), provide decision support for public opinion management (Ge et al., 2016), or be applied to the analysis of research hotspots, such as the research hotspots of smart manufacturing at home and abroad (Wang and Zhou, 2016). A common method is to construct a keyword semantic model of the academic journals in a specific research field based on a digital library (Zhou D H, 2019), so as to effectively and accurately extract research hotspots and research trends in that field. For example, based on the “Scrapy” framework provided by Python, different studies have realized the analysis and statistical characterization of academic research results (Guo, 2018), the data collection of tomato pests and diseases (Xu, 2019), and the extraction and utilization of agricultural network data (Li, Shang, et al., 2018; Liu, Gong, et al., 2018), thus effectively promoting the efficiency of the statistical data. Using the “Web of Science” database to analyze the research hotspots and the development trends of temporal-spatial relationships researchers can break through the technical bottleneck of traditional time-based geography research (Gu et al., 2013). There are many different methods, models and evaluation indexes for obtaining research progress information by crawling literature information from big data. Hu et al. (2017) have proposed the absolute hot regions index, relative hot regions index and standardized comprehensive hot regions index. Their study shows that the standardized comprehensive hot regions index could better describe the spatial distribution pattern of hot regions for grassland degradation research during the 1950s-2016 (Hu et al., 2017). In fact, whether the standardized comprehensive hot regions index is applicable to the analysis of the spatial distribution pattern of desertification research hotspots in China or not remains to be tested.
The so-called Web Crawler is just like a spider crawling along the lines of the Internet—crawling one by one. Frankly speaking, it is essentially just a computer program. Based on the CNKI knowledge engine database, this paper uses the HTTP GET/POST method in the Java language to construct the lists of topic words, and to carry out Chinese word segmentation and toponym matching. Based on SQLite, the county-level spatial database of desertification research hotspots of China covering the 1980s-2018 is established. The data retrieved is processed by first carrying out data cleaning (Zhou and Lin, 2005), Chinese word segmentation (Li et al., 2015; Mo et al., 2013), natural language understanding (Liang and Gu, 2015), and other preliminary steps; and then constructing the automatic extraction model of desertification research hotspots in China from the 1980s to 2018. This study tests the suitability of the standardized comprehensive hot regions index for the analysis of desertification research hotspots in China. Therefore, a revised evaluation index, the “Normalized Comprehensive Hotspots Index” (NCH), is proposed for obtaining the spatial distribution of desertification research hotspots in China. The research area of desertification (i.e., potentially occurring areas) mainly include arid, semi-arid and sub-humid areas, so desertification climate type zoning is required as a first step. Then the Google Earth Engine platform is used to conduct a trend analysis of the NCH Index during the 1980s-2018 to understand the dynamic changes of the research hotspots for desertification in China (Hu et al., 2018).

2 Materials and methods

2.1 Meteorological data sources

Meteorological data are collected from 1915 stations nationwide, of which 335 stations for 1949-1996 are provided by the Institute of Remote Sensing and Digital Earth of the Chinese Academy of Sciences. The data from 1540 stations covering 1981-1990 have been obtained by inputting the national meteorological data compilation. The data for 10 stations in Taiwan are provided by the National Weather Service, which is the aggregated average data from 1949 to 1980. Data for some stations in Tibet and Kunlun Mountains (30 sites) are taken from the China Climate Atlas. All the above data are sorted and inspected to form an original database. The geographical coordinates of each meteorological site are obtained from the “District station Number List of National Meteorological Station” published by the National Meteorological Administration in September 1990.
(1)Thornthwaite method
The formula of the Thornthwaite method for calculating the potential evapotranspiration is as follows (Zhou et al., 2002; Fisher et al., 2011):
$E=\mathop{\sum }^{}16{{(10t/I)}^{a}}$
$\alpha =(0.675{{I}^{3}}-77.1{{I}^{2}}+1790I+492390)\times {{10}^{-6}}$
$I=\mathop{\sum }^{}{{\left( \frac{{{t}_{i}}}{5} \right)}^{1514}}$
$PE=E\times CF$
In these formulas, E represents the potential evapotranspiration (mm). t is the monthly average temperature (°C). α is a constant that varies from place to place. I is 12-month comprehensive heat index. PE is the corrected potential evapotranspiration. CF is the coefficient of the number of days of duration and the number of days per month depending on the latitude, which can be obtained by looking up the appropriate table.
(2) Wetting Index
$IM=\frac{\Sigma 100(S-0.6D)}{PE}.$
S=P‒PE (PPE)
D=PE‒P (P<PE)
In these formulas, IM represents the wetting index, P represents the annual precipitation (mm), and S and D are corrected values.

2.2 Web Crawler data sources

China Knowledge Infrastructure Engineering (CNKI) includes a full range of published resources including Chinese journals, masters and doctoral theses, newspapers, conference papers, yearbooks, encyclopedias, patents, standards, Frontier journals, economic information and political bulletins. As of July 13, 2019, the China Academic Journals full- text database (CAJ) included a total of 10454 journals, 2023587 issues and 66437162 articles.
This study establishes a standard toponym database according to the 2012 edition of the county-level administrative division map provided by the National Map Publishing House. The system of Chinese keywords used in this research contains 12 keywords (Fig. 1). Taking the historical evolution of administrative divisions into account, data for some toponyms have been revised and supplemented according to the 1:250000 basic geographic database provided by the State Bureau of Surveying and Mapping or the county-level administrative division database provided by the Earth System Science Data Sharing Platform of the Ministry of Science and Technology.
Fig. 1 The search system of keywords in Chinese

2.3 Technical routes

The Thornthwaite method is first used to calculate the Wetting Index (IM) to divide the study area into arid, semi-arid, and sub-humid arid regions (McCabe et al., 1990). Regarding the China Knowledge Network (http://www.cnki.net/) as data source, this study summarizes 12 keywords about desertification research, and automatically searches all the journal articles from the 1980-2018 based on the professional code of the web crawler. After the web page analysis, the titles, abstracts, keywords, author names and unit information of these articles are obtained, and this text information is downloaded and saved to the local SQLite database in real time. The area covered in the paper is spatially located after the Chinese word segmentation as well as toponym matching that relies on the abstracts of the 253, 055 desertification research papers retrieved. Then, the spatial statistics of all the localized articles are determined, and the research hotspots index is calculated for all the counties in the study area.
Finally, the spatial distribution thematic map of the desertification research hotspots is obtained. Chinese word segmentation (CWS) is an important task of Chinese natural language processing (Liu, Wu, et al., 2019). We use the model of Ansj to segment abstracts and use the model of Han LP to identify toponyms based on the results of word segmentation (Hu et al., 2017). The KMP algorithm (KMP: Knuth-Morris-Pratt) (Li et al., 2016) can realize character-level fuzzy matching based on the above-mentioned identified toponyms and standard toponyms in the spatial database, and it ultimately counts and records the number of occurrences in each district. After correcting the standardized comprehensive hot regions index, the Normalized Comprehensive Hotspots Index applicable to desertification research is obtained for describing the spatial distribution of the hotspots of desertification research of China from the 1980s-2018. At the same time, the trend analysis is carried out on the GEE platform to capture the dynamic changes of desertification research hotspots. The detailed workflow is shown in Fig. 2.
Fig. 2 General workflow for the analysis of research hotspots for desertification in China

2.4 Extraction model of research hotspots for desertification

Firstly, we calculate the “Absolute Hotspots Index” and the “Relative Hotspots Index”. The Absolute Hotspots Index is the number of occurrences of a county in the 253055 papers retrieved after defining the theme as desertification (Hu et al., 2017). In fact, due to different standards of research, economy and different scales of scientific research personnel in different counties, some places have much higher research intensity than their natural intensity of desertification (Lu et al., 2014). Therefore, this study uses the Relative Hotspots Index to eliminate the statistical bias caused by this “information gap” to some extent. The formula is as follows:
$R=\frac{{{N}_{gd}}}{{{N}_{all}}}$
in the formula, R represents the Relative Hotspots Index. Ngd is equal to the Absolute Hotspots Index, which is the number of occurrences of a county in the 253055 papers retrieved when the topic is desertification. Nall is the number of occurrences of a county in the 253055 papers retrieved when the topic is unlimited.
Previous studies have shown that the use of either the Absolute Hotspots Index or the Relative Hotspots Index alone to evaluate research hotspots cannot effectively describe their spatial distribution patterns and dynamic processes (Hu et al., 2017). In order to generalize the evaluation index, we normalized the values of both Ngd and R to be between 0 and 1. Then we use the field calculator in ArcGIS to perform overlay analysis based on the above normalized results. After the above calculation, we obtain the map of “Normalized Comprehensive Hotspots Index” (NCH Index). The formulas are as follows:
$NCH=\frac{O-\text{mi}{{\text{n}}_{O}}}{{{\max }_{O}}-\text{mi}{{\text{n}}_{O}}}$
$O={{N}_{g{{d}_{S}}}}\times {{R}_{S}}$
${{N}_{g{{d}_{S}}}}=\frac{{{N}_{gd}}-\text{mi}{{\text{n}}_{{{N}_{gd}}}}}{{{\max }_{{{N}_{gd}}}}-\text{mi}{{\text{n}}_{{{N}_{gd}}}}}$
${{R}_{S}}=\frac{R-\text{mi}{{\text{n}}_{R}}}{{{\max }_{R}}-\text{mi}{{\text{n}}_{R}}}$
in these formulas, NCH represents the Normalized Comprehensive Hotspots Index whose value is between 0 and 1. O is the overlay result of the Absolute Hotspots Index and the Relative Hotspots Index. maxO is the maximum value of O, and maxO is the minimum value of O. ${{N}_{g{{d}_{S}}}}$ is the normalized result of the Absolute Hotspots Index whose value is between 0 and 1. RS is the normalized result of the Relative Hotspots Index whose value is between 0 and 1. $\text{ma}{{\text{x}}_{{{N}_{gd}}}}$ is the maximum value of Ngd, and $\text{mi}{{\text{n}}_{{{N}_{gd}}}}$ is the minimum value of Ngd . maxR is the maximum value of R, and minR is the minimum value of R.
In order to analyze the dynamic changes of research hotspots for desertification in China for the 1980-2018, we conducted the trend analysis on the Google Earth Engine platform based on the NCH Index. We use a one-dimensional linear regression method to simulate the trend of the NCH Index in the past forty years pixel by pixel, and take the linear regression slope of the NCH Index and time (i) as the characteristic trend of the index (Reynolds et al., 2007; Zhang et al., 2008). Compared with the method of simply comparing the differences between a field in two-time periods, the trend analysis method used here can eliminate the influence of individual cases in a specific year, and more objectively reflect the research progress and trends of desertification over a continuous period of time (Weller et al., 2019). The formula for the slope of the NCH Index is as follows (Hu et al., 2018):
${{\beta }_{Slope}}=\frac{n\times \sum\limits_{i=1}^{n}{(i\times {{Y}_{i}})}-\sum\limits_{i=1}^{n}{i}\sum\limits_{i=1}^{n}{{{Y}_{i}}}}{n\times \sum\limits_{i=1}^{n}{{{i}^{2}}}-{{\left( \sum\limits_{i=1}^{n}{i} \right)}^{2}}}$
in the formula, βSlope is the slope of NCH Index. When βSlope is above 0, it means the NCH Index rises. When βSlope is below 0, it means that the NCH Index drops. When βSlope is equal to 0, it means the NCH Index is unchanged. Yi is the value of the NCH Index in year i. n represents the number of years for the monitoring period (n=4). In order to verify the confidence of the regression model, the P-value is calculated.
Null Hypothesis (H0): Y1=Y2 (∀Y1, Y2)
If H0 is rejected at 90% confidence, it would prove that the value of the NCH Index changes significantly year by year when P < 0.1. On the contrary, if H0 is not rejected, then there are no significant changes. By means of ArcGIS, we performed overlay analysis on the layer of βSlope and the layer of the P-values with the raster calculator. Then we obtained a change trend map divided into four categories: “increased significantly”, “increased”, “decreased significantly” and “decreased”.

3 Results

3.1 Desertification climate division

China’s typical desert and desertification land is mainly distributed in arid, semiarid, and some semi-humid regions of Northern China, north of 35°N (Yao et al., 2019). The study area covers 18 provinces, including Inner Mongolia Autonomous Region, Northern Shaanxi Province, Northern Qinghai Province, Gansu Province, and Xinjiang Uygur Autonomous Region; and 781 counties, such as Linger County, Horqin District, Aru Kerqin Banner, Yuzhong County, Qilian County and Yanchi County (Fig. 3). We calculate the wetting index according to Eq. (1)-(7), and then map the climate type of desertification in China (Fig. 3), dividing the Chinese land into arid, semi-arid, sub-humid arid (dry semi-humid), wet sub-humid, wet, humid and over-wet. The sub-humid arid zone refers to the relatively arid part of the semi-humid zone, and it is also called the dry semi-humid zone (Zhou et al., 2002). We only discuss the potential areas of desertification in China here, namely the arid, semi-arid and sub-humid arid areas.
Fig. 3 Spatial distribution of climate types of desertification in China (based on the Thornthwaite method)
According to Fig. 3, the arid areas are concentrated in the south of the Tianshan Mountains, the foothills of the Kunlun Mountains, the north of the Qilian Mountains, and the vast areas in the northwestern part of the Qinghai-Tibet Plateau, and they are mainly composed of deserts and arid deserts. The eastern part of the semi-arid area is composed of typical grassland and desert grassland. After entering the Qinghai-Tibet Plateau, it becomes an alpine grassland and an alpine desert. Most of northern Xinjiang is a semi-arid area, mainly composed of desert and semi-desert. The Hulun Buir Sandy Land in the south of Greater Khingan Mountains in the sub-humid arid area is close to the boundary between the typical grassland and the meadow grassland. After crossing the northern part of the Loess Plateau, it continues west along the northern edge of the Qinghai-Tibet Plateau, bypasses the Qaidam Basin to the south, and then reaches the southwestern part of the Qinghai-Tibet Plateau. A small number of island-like areas belonging to the sub-humid arid regions are located in the northwestern, southwestern and Hainan provinces.

3.2 Spatial distribution pattern of research hotspots on desertification

Analysis of the distribution of the absolute hotspots index of desertification for the 1980s-2018 (Fig. 4) reveals that the research hotspots for desertification are mainly distributed in the western, northern and northwestern regions of northeastern China. Nearly all districts and counties in Xinjiang Uygur Autonomous Region and Inner Mongolia Autonomous Region have reached extreme levels, and the research results of Gansu Province, Qinghai Province and Ningxia Hui Autonomous Region are also quite rich. There are some desertification research results in Southwest China, Beijing, Tianjin, Shanxi, Hebei and Northeast China. Obviously, this analysis reveals that the spatial distribution of the research is somewhat different from our traditional understanding of the spatial distribution of desertification in China.
Fig. 4 Spatial distribution of Absolute Hotspots Index of desertification research since the 1980s
Analysis of the relative hotspots index distribution for China's desertification research (Fig. 5) reveals that the research hotspots for desertification are mainly distributed in the western, northern and western parts of northeast China. Desertification research in the central and eastern parts of Inner Mongolia, Hulun Buir Sandy Land, Ningxia Region, Qaidam Basin and the southeastern foothills of the Kunlun Mountains to the Himalayas is the most abundant. In fact, the desertification land on the Qinghai-Tibet Plateau is mainly concentrated in the western and northern parts of the plateau (Li, Zhang, et al., 2018), and the research on desertification in Ningxia is mainly concentrated in the southeast. Therefore, considering the Relative Hotspots Index alone will cause some gaps in the research hotspots in some regions. However, the spatial distribution pattern of desertification research formed by the Relative Hotspots Index is generally consistent with our traditional understanding of the spatial distribution, and it can also reflect some differences among counties.
Fig. 5 Spatial distribution of Relative Hotspots Index of desertification research since the 1980s
Analysis of the NCH Index distribution of China’s desertification research (Fig. 6) reveals that the hotspots of China’s desertification research for the 1980s-2018 are mainly distributed in five regions: the desert and desertification areas in Hulun Buir of Inner Mongolia (including Hulun Buir Sandy Land, Mu Us Sandy Land, Kubuqi Desert, Hunshandake Sandy Land, Horqin Sandy Land, etc.), the desertification zone of Qaidam Basin in the western alpine zone, the central Tarim Basin the area extending to the foothills of the Kunlun Mountains, and the south foothills of the Altai Mountains with the sporadic areas around the Tianshan Mountains. These areas are mainly distributed in the agro-pastoral ecotone or grassland zone of the sub-humid arid and semi-arid regions, the desertification area in the western alpine zone and the oasis-desert ecotone in the arid zone. Among them, the level of research hotspots on desertification in the agro-pastoral ecotone in central and eastern Inner Mongolia is the highest, so it is the region with the most serious desertification development in China and the most urgent need for governance. The reason why desertification land research hotspots are widely distributed in the sub-humid arid and semi-arid regions is that the environment here has natural factors for the potential development of desertification, and human activities are also frequent. This research shows that the NCH Index is superior to the Absolute Hotspots Index and Relative Hotspots Index in reflecting the differences in desertification research among counties, and at the same time it also ensures that the results are highly consistent with the spatial distribution pattern of our traditional understanding.
Fig. 6 Spatial distribution of NCH Index of desertification research since the 1980s

3.3 Dynamic changes and trends in desertification research

According to Fig. 7 and Fig. 8, since the 1980s, the number of counties with a level of severe or above in the study area has been reduced from 152 in the 1980s to only 37 in 2018, and the total area has been reduced from 1.226 million km2 to only 307700 km2. Different patterns also emerge if we divide the full time-span into different periods.
(1) Analysis of the data in the 1980-1990 shows that 56 counties reached the extreme level, mainly those in the agro-pastoral zone in central and eastern Inner Mongolia. Another 96 counties reached the severe level, involving Inner Mongolia Autonomous Region, Xinjiang Uygur Autonomous Region, Gansu, Ningxia and others. In Xinjiang, except for the sporadic distribution near the Tianshan Mountains, most of them were at the moderate level.
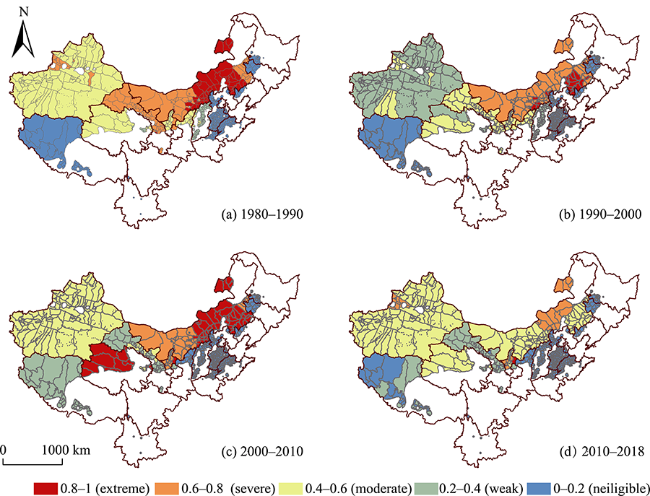
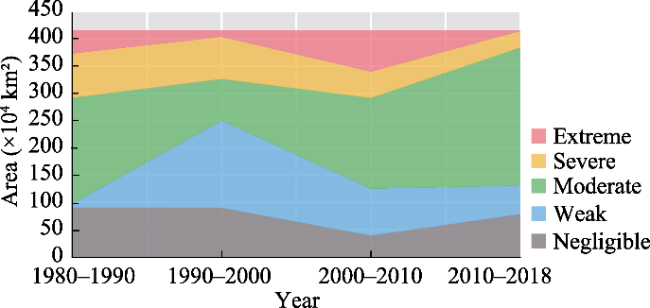
Fig. 7 Dynamic change in the spatial distribution of desertification research since the 1980s (a: NCH of the 1980-1990; b: NCH of 1990-2000; c: NCH of 2000-2010; d: NCH of 2010-2018)
Fig. 8 Area accumulation of different research hotspots levels of desertification in the 1980-2018
(2) Analysis of the data for 1990-2000 shows that 22 counties reached the extreme level, concentrated in the Horqin Sandy Land in Inner Mongolia Autonomous Region, and another 194 counties only reached the weak level. In the Xinjiang Uygur Autonomous Region, except for the values of NCH Index in the desertification zone of the Tianshan Mountains and the Tarim Basin, the values in most parts of Xinjiang were between 0.2 and 0.4.
(3) Analysis of the data for 2000-2010 shows that the number of desertification research studies in this period has generally increased compared to earlier periods. The main reason is that since 2002, the country has vigorously carried out the “Three North” shelter forest project, the “returning farmland to forest (grass)” project, the “Beijing-Tianjin sand source control” project, and others. During this period, 76 counties reached the extreme level, mainly distributed in the Qaidam Basin, the middle and eastern areas of Inner Mongolia, and the agro-pastoral area. Another 118 counties were at the moderate level, mainly concentrated in the Xinjiang Uygur Autonomous Region. The hotspots level of desertification research in Inner Mongolia remained at or above the level of 0.6-0.8.
(4) Analysis of the data for 2010-2018 shows that 481 counties are considered to be at the negligible level, and 196 counties are at the moderate level. Except for the NCH of Yanchi County, which is above 0.8, and the NCH values of Hulun Buir Sandy Land, Central and Eastern Inner Mongolia, and the Tianshan Mountains which reached 0.6, most areas had quite low values. One possible reason is that compared with 2000-2010, the 10-year “Beijing-Tianjin Sandstorm Source Control” project in Beijing, Tianjin, Hebei, Shanxi and Inner Mongolia lasted from 2010 to 2018, so this time period is close to the end of the project (Qi et al., 2006).
Analysis of the trends of NCH in desertification research for the 1980-2018 (Fig. 9) shows that since the 1980s, the hotspots of desertification research in 447 counties decreased, covering an area of 2524600 km2 (51.80% of the study area). The hotspots of desertification research in 172 counties increased, covering an area of 1.627×10⁶ km2 (37.39% of the study area). The NCH Index values decreased significantly for 219 counties located in Gansu, Shanxi, Shandong, Hebei, Inner Mongolia and other provinces, covering an area of 451200 km2 (10.37% of the study area). The hotspots of desertification research in 8 counties located in Tibet and Ningxia increased significantly, covering an area of 19000 km2 (0.44% of the study area). According to the statistics (Zhou, 2019), during 1975-2017, the desert and desertification areas in the northwest were mainly reduced. The desert and desertification areas of the Qinghai-Tibet Plateau and the North China-Loess Plateau mostly remained stable. The desert and desertification areas of Inner Mongolia-Greater Khingan Range increased in the eastern part and declined in the central part. During 2000-2017, the severe desertification areas of the Loess Plateau gradually decreased, and the mild and non-desert areas were extended to the northwest (Liu et al., 2019). This study found that from the 1980s to 2018, the hotspots of desertification research in the southern foothills of the Altai Mountains in Xinjiang, the scattered areas around the Tianshan Mountains, and the central part of the Tarim Basin to the extension of the Kunlun Mountains were all generally increasing. The research on desertification in the Qinghai-Tibet Plateau and the Qaidam Basin maintained an upward trend. The research intensity in central and eastern Inner Mongolia shows a downward trend. The reason for the mostly declining research intensity of desertification in the sub-humid arid and semi-arid areas in Inner Mongolia is that many projects have started since 2002. We can conclude that in recent years, the research on desert and desertification areas in the northwest has achieved remarkable effects, while the research on desertification areas in the Qinghai-Tibet Plateau and the Loess Plateau in North China has achieved significant effects. The central part of Inner Mongolia-Greater Khingan Range has also achieved significant governance effects, but the eastern region still needs to strengthen its governance.
Fig. 9 The trends of NCH Index of desertification research since the 1980s

4 Conclusions

In this study, we used web crawler technology to automatically retrieve the content of the China Academic Journals full-text database (CAJ). According to the acquired literature on desertification research for the 1980s-2018, the database and modelling method for extracting hotspots from desertification research in China were subsequently constructed. Manual processing of big data online not only requires a lot of time, but it also loses a certain amount of literature that humans cannot readily detect (Hsiao and Chen, 2018). Web crawler technology effectively improves data processing efficiency and accuracy. It plays a vital role in improving on the use of bibliometric methods to obtain research hotspots and research trends in large scale repositories of references. This study shows that the research hotspots on desertification are related to the publication years, and for a given place, the earlier the publication years in the 1980-2018, the higher the NCH Index. However, the spatial distribution of the early papers is significantly different from that of the current research papers (including relevant papers at home and abroad) (Dong et al., 1999; Zhao et al., 2019; Dirmeyer and Shukla, 1996; Escadafal et al., 2015; An et al., 2007). In order to avoid influencing the determination of the research hotspots for the current stage by the cumulative effect of early scientific research results, this study derived statistics on the NCH Index in four different periods (Fig. 7). Furthermore, search engines are considered as the most important tools for retrieving information on the Web, but the coverage of any one engine is significantly limited, and no single engine indexes more than about one-third of the “indexable Web” (Gaines et al., 1997; Lawrence and Giles, 1998). Therefore, our future research efforts will expand the data sources that are consulted in order to obtain the most complete desertification research results that are possible, such as the combined use of CNKI, WOS, Wiley and EI, and other major sources.
In view of Hu’s definition of the standardized comprehensive hot regions index, this study has revised the index and proposed the “Normalized Comprehensive Hotspots Index”, applied it to China’s desertification research, and initially realized the general features of the evaluation index. The generalized evaluation index can characterize the real situation of the spatial distribution pattern of desertification research in China and meet the needs of people for understanding the research hotspots and research progress on desertification. This is just a preliminary attempt. The characteristics and properties of different research objects in different research areas will differ by varying degrees. When using the NCH Index to evaluate the spatial distribution patterns of research hotspots in other fields, the researchers will still need to combine their own expertise and expert experience to verify or correct the index. Obviously, the NCH Index will become very widely used in the future by researchers to capture the research hotspots and trends in a given scientific research field. This modelling technology provides a convenient and novel way for researchers to characterize research progress or to integrate that knowledge into their academic writing.
1
An P, Inanaga S, Zhu N , et al. 2007. Plant species as indicators of the extent of desertification in four sandy rangelands. African Journal of Ecology, 45(1):94-102.

2
State Forestry Administration. 2015. Bulletin on The Status of Desertification and Desertification in China. (http://www.forestry.gov.cn ).(in Chinese)

3
Ci L J, Wu B . 1997. Classification of climate types in china’s desertification and determination of potential occurrence range. Journal of Desert Research, 17(2):107-111. (in Chinese)

4
Dirmeyer P A, Shukla J . 1996. The effect on regional and global climate of expansion of the world’s deserts. Quarterly Journal of the Royal Meteorological Society, 122(530):451-482.

DOI

5
Dong G R, Wu B, Ci L J , et al. 1999. The current situation, causes and countermeasures of desertification in china. Journal of Desert Research, 19(4):318-332. (in Chinese)

6
Escadafal R, Barbero-Sierra C, Exbrayat W , et al. 2015. First appraisal of the current structure of research on land and soil degradation as evidenced by bibliometric analysis of publications on desertification. Land Degradation & Development, 26(5):413-422.

DOI PMID

7
Fisher J B, Whittaker R J, Malhi Y . 2011. ET come home: Potential evapotranspiration in geographical ecology. Global Ecology and Biogeography, 20(1):1-18.

DOI

8
Gaines B R, Chen L L J, Shaw M L G . 1997. Modeling the human factors of scholarly communities supported through the internet and world wide web. Journal of the American Society for Information Science, 48(11):987-1003.

DOI

9
Ge X S, Fu K, Cheng G , et al. 2016. Research on geographical visualization of network hotspot events supported by data mining. Journal of Henan Polytechnic University (Natural Science), 35(5):655-659. (in Chinese)

10
Graham M, Shelton T . 2013. Geography and the future of big data, big data and the future of geography. Dialogues in Human Geography, 3(3):255-261.

DOI PMID

11
Gu J, Zhou S H, Yan X P , et al. 2013. Hot spot analysis of temporal and spatial relationship based on literature citation relationship and knowledge mapping. Progress in Geography, 32(9):1332-1343. (in Chinese)

12
Guo L R . 2018. Design of scientific data analysis platform based on scrapy. Electronic Technology & Software Engineering,( 23):136-137. (in Chinese)

DOI PMID

13
Hsiao T M, Chen K H . 2018. How authors cite references? A study of characteristics of in-text citations. Proceedings of the Association for Information Science and Technology, 55(1):179-187.

DOI

14
Hu Y F, Han Y Q, Zhang Y Z , et al. 2017. Extraction and dynamic spatial-temporal changes of grassland deterioration research hot regions in China. Journal of Resources and Ecology, 8(4):352-358.

DOI

15
Hu Y F, Zhang Y Z, Han Y Q . 2018. Identification and monitoring of desertification land in China from 2000 to 2015. Arid Land Geography, 41(6):1321-1332. (in Chinese)

16
Lawrence S, Giles C L . 1998. Searching the world wide web. Science, 280(5360):98-100.

DOI PMID

17
Li L, Jiang Yuan, Lin Jie , et al. 2016. Improved algorithm kmpp based on kmp. Computer Engineering and Applications, 52(8):33-37.

18
Li Q, Zhang C L, Zhou N , et al. 2018. Spatial distribution and regionalization of desertified land in Qinghai-Tibet plateau. Journal of Desert Research, 38(4):690-700. (in Chinese)

19
Li Q Y, Shang M H, Wang F J , et al. 2018. Scrapy-based agricultural network data crawling. Shandong Agricultural Sciences, 50(1):142-147. (in Chinese)

20
Li W Y . 2016. Research on desertification control countermeasures based on big data. Gansu Science and Technology, 32(15):38-40. (in Chinese)

21
Li Z H, Guo F H, li R J , et al. 2015. Method and empirical study on hot place name extraction in a large number of online travel texts. Geography and Geo-Information Science, 31(1):68-73. (in Chinese)

22
Liang X T, Gu L . 2015. Chinese participle and part-of-speech tagging. Computer Technology and Development, 25(2):175-180. (in chinese)

23
Liao Z, Ren M M . 2019. Geospatial information collection method based on web crawler. Computer Knowledge and Technology, 15(18):9-10. (in Chinese)

24
Liu B, Ma Z G . 2007. Regional variation characteristics of dry and wet climate in China in the past 45 years. Arid Land Geography, 30(1):7-15. (in Chinese)

25
Liu D Y, Gong L B, Li W , et al. 2018. Research and implementation of information acquisition system for yunnan rural science and technology service platform based on scrapy reptile framework. Journal of Anhui Agricultural Sciences, 46(35):191-194. (in Chinese)

26
Liu H X, Feng Y M, Cao X M , et al. 2018. Construction and service of big data resource platform for desert ecosystem. Journal of Arid Land Resources and Environment, 32(9):126-131. (in Chinese)

27
Liu J, Wu F, Wu C , et al. 2019. Neural Chinese word segmentation with dictionary. Neurocomputing, 338:46-54

DOI PMID

28
Liu Y, Li Y, Lu Y , et al. 2019. Remote sensing analysis of desertification in the Loess Plateau in 2000-2016. Remote Sensing Information, 34(2):30-35. (in Chinese)

29
Lu Y, Li Z, Arthur D . 2014. Mapping publication status and exploring hotspots in a research field: Chronic disease self-management. Journal of Advanced Nursing, 70(8):1837-1844.

DOI

30
Mao F, Sun H, Yang H L . 2011. Progress in research on dry and wet climate division. Progress in Geography, 30(1):17-26. (in Chinese)

DOI

31
McCabe Jr G J, Wolock D M, Hay L E , et al. 1990. Effects of climatic change on the Thornthwaite moisture index1. JAWRA Journal of the American Water Resources Association, 26(4):633-643.

DOI

32
Mo J W, Zheng Y, Shou Z Y , et al. 2013. Improved dictionary-based chinese word segmentation method. Computer Engineering and Design, 34(5):1802-1807. (in Chinese)

33
Qi Y X, Zhao T N . 2006. Summary of sand prevention and control in china. Journal of Beijing Forestry University (Social Sciences), 5(S1):51-58. (in Chinese)

DOI PMID

34
Qin Y, Na R S, Wang Y Q , et al. 2009. Analysis of the research trend of temperate grassland desertification in china by word frequency analysis. Pratacultural Science, 26(9):227-230. (in Chinese)

35
Reynolds J F, Smith D M, Lambin E F , et al. 2007. Global desertification: Building a science for dryland development. Science, 316(5826):847-851.

DOI PMID

36
Shen S H, Zhang F M, Sheng Q . 2009. Temporal and spatial variation characteristics of china's wet index from 1975 to 2004. Transactions of the Chinese Society of Agricultural Engineering, 25(1):11-15. (in Chinese)

37
Su X C, Wang L, Li Q L , et al. 2014. Study on surface dry and wet conditions in southwest china in recent 50 years. Journal of Natural Resources, 29(1):104-116. (in Chinese)

38
Thornthwaite C W . 1948. An approach toward a rational classification of climate. Geographical Review, 38(1):59-94.

39
Tu J Q, Yang X Y, Wang Y L . 2019. Research on the history and development of cnki in china knowledge network. Library Tribune, 39(9):1-12. (in Chinese)

40
UNCCD. 1994. United nations: Convention to combat desertification in those countries experiencing serious drought and/or desertification, particularly in Africa. International Legal Materials, 33(5):1328-1382.

DOI PMID

41
Wang J, Chen S C, Wang L L , et al. 2016. Analysis of hotspots and trends of education big data based on citespace. Modern Educational Technology, 26(2):5-13. (in Chinese)

42
Wang L, Xie X Q, Li Y S , et al. 2004. Changes of wet index and climate dry and wet belt boundary in northern China in 40 years. Geographical Research, 23(1):45-54. (in Chinese)

43
Wang T, Song X, Yan C Z , et al. 2011. Remote sensing analysis of land desertification trend in Northern China in recent 35 years. Journal of Desert Research, 31(6):1351-1356. (in Chinese)

44
Wang T, Wu W, Xue X , et al. 2004. Temporal and spatial changes of desertified land in northern China in the past 50 years. Acta Geographica Sinica, 59(2):203-212. (in Chinese)

45
Wang T, Zhu Z D . 2003. Some problems in the study of desertification in China——1. The concept of desertification and its connotation. Journal of Desert Research, 23(3):3-8. (in Chinese)

46
Wang Y F, Zhou X Z . 2016. Hot spots and development trends of intelligent manufacturing research at home and abroad. Forum on Science and Technology in China,( 4):154-160. (in Chinese)

47
Weller E, Jakob C, Reeder M J . 2019. Understanding the dynamic contribution to future changes in tropical precipitation from low-level convergence lines. Geophysical Research Letters, 46(4):2196-2203.

DOI

48
Wu S H, Yin Y H, Zhen D , et al. 2005. Study on the dry and wet conditions of land surface in China in the past 30 years. Scientia Sinica(Terrae), 35(3):276-283. (in Chinese)

49
Wu X Y . 2000. Hotspots of restoration ecology in desertification control. Journal of Shenyang Agricultural University, 31(3):290-294. (in Chinese)

50
Xu Z Q . 2019. Scrapy-based tomato pest and disease data collection. Computer Knowledge and Technology, 15(3):24-25, 28. (in Chinese)

DOI PMID

51
Yin Z C . 2018. Governing desertification project in northwest china—analysis of "Three North" shelterbelt project. Anhui Architecture, 24(6):219-220. (in Chinese)

52
Yue YJ, Li M, Wang L , et al. 2019. A data-mining-based approach for aeolian desertification susceptibility assessment: A case study from Northern China. Land Degradation & Development, 30(16):1-16.

DOI PMID

53
Zhang C J, Liao Y M, Duan J Q , et al. 2016. Research progress on dry and wet climate division in China. Climate Change Research, 12(4):261-267. (in Chinese)

54
Zhang Y C, Zhao Z X, Li S C , et al. 2008. Spot NDVI based surface vegetation cover change trend in northern North China. Geographical Research, 27(4):745-754, 973. (in Chinese)

55
Zhang Y X . 1998. Distribution of desertification climate types in China. Arid Zone Research, 15(2):46-50. (in Chinese)

DOI PMID

56
Zhao J F, Guo J P, Xu J W , et al. 2010. Trend of dry and wet conditions in china based on wetting index. Transactions of the Chinese Society of Agricultural Engineering, 26(8): 18- 24, 386-387. (in Chinese)

57
Zhao Y Y, Gao G L, Qin S G , et al. 2019. Progress in research on desertification monitoring and evaluation indicators. Journal of Arid Land Resources and Environment, 33(5):81-87. (in Chinese)

DOI PMID

58
Zhou D H . 2019. Exploration on the construction and development of digital library in the age of big data. Think Tank Era,(27): 262, 270. (in Chinese)

59
Zhou L Z, Lin L . 2005. Summary of research on focusing reptile technology. Journal of Computer Applications, 25(9):1965-1969. (in Chinese)

DOI

60
Zhou R P . 2019. Desertification division and spatial and temporal evolution in China. Journal of Geo-information Science, 21(5):675-687. (in Chinese)

DOI PMID

61
Zhou X D, Zhu Q J, Sun Z P , et al. 2002. Preliminary discussion on the classification methods of desertification climate types in China. Journal of Natural Disasters, 11(2):125-131. (in Chinese)

Outlines

/