
Journal of Resources and Ecology >
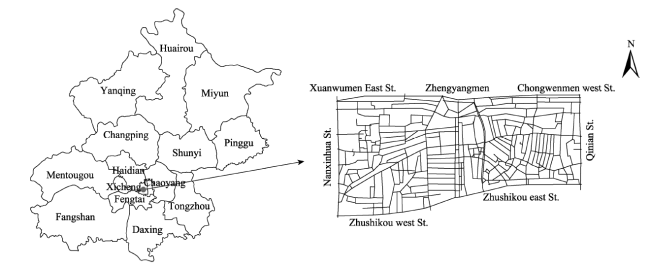
Comprehensive Assessment of Sustainable Tourism-oriented Revitalization in a Historic District: A Case Study of Qianmen Area, Beijing, China
Received date: 2019-04-05
Accepted date: 2019-07-20
Online published: 2019-10-11
Supported by
National Natural Science Foundation of China(41801139)
Science and Technology Support Program of the Institute of Geographic Sciences & Natural Resources Research, CAS(Y8V80105YZ)
Social Science Planning Project of Beijing Municipal Education Commission(SM201810017002)
The Strategic Priority Research Program of the Chinese Academy of Sciences(XDA23100302)
Copyright
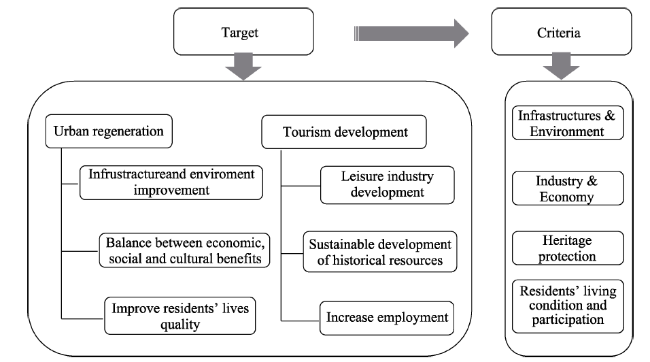
Tourism-oriented revitalization of historic districts has been identified as a form of sustainability which is believed to contribute to both conservation and development. Comprehensive assessments of the effects of such tourism-oriented revitalizations in historic districts are thus a great challenge, and are needed to support sustainable development and management efforts. In this study criteria and indicators were identified by using the AHP method with experts scoring four aspects on two levels. We assess a case in China using this system and outputs indicated infrastructure and environment performed best, while the score for residents’ living condition and participation was the lowest. Finally, we offer some suggestions to improve the relatively poor status in order to assist historic districts in achieving sustained revitalization.
ZHU He , WANG Jingru , ZHANG Xiyue . Comprehensive Assessment of Sustainable Tourism-oriented Revitalization in a Historic District: A Case Study of Qianmen Area, Beijing, China[J]. Journal of Resources and Ecology, 2019 , 10(5) : 559 -568 . DOI: 10.5814/j.issn.1674-764X.2019.05.013
Table 1 9-point scale numerical |
| Comparison with indicator i and j | Quantized value |
|---|---|
| Equally important | 1 |
| Slightly important | 3 |
| Significantly important | 5 |
| Strongly important | 7 |
| Extremely important | 9 |
| The intermediate value of two neighboring judgements | 2, 4, 6, 8 |
Table 2 The comprehensive assessment system |
| First level | Weight | Second level | Weight | Score | ||||
|---|---|---|---|---|---|---|---|---|
| 1 | 2 | 3 | 4 | 5 | ||||
| Infrastructures & Environment | 0.2176 | Environmental quality | 0.0210 | Bad | Low | General | Good | Prefect |
| Service facilities condition | 0.0786 | Bad | Low | General | Good | Prefect | ||
| Transport convenience | 0.0473 | Bad | Low | General | Good | Prefect | ||
| Infrastructure quality | 0.0197 | Bad | Low | General | Good | Prefect | ||
| Regional fame | 0.0511 | Bad | Low | General | Good | Prefect | ||
| Industry & Economy | 0.2689 | Per capita GDP | 0.0159 | If it equal or above the whole urban average scored 5, else calculated for the proportion a. | ||||
| Tertiary industry | 0.0167 | Bad | Low | General | Good | Prefect | ||
| Visitor capacity | 0.0400 | Bad | Low | General | Good | Prefect | ||
| Tourist satisfaction | 0.1246 | Scores from tourists’ satisfaction survey | ||||||
| Degree of commercial agglomeration | 0.0580 | Bad | Low | General | Good | Prefect | ||
| Abundance of business types | 0.0137 | Bad | Low | General | Good | Prefect | ||
| Heritage protection | 0.3049 | Repair-rate of ancient buildings and relics | 0.0605 | The proportion of repaired ancient architectures multiply 5 b | ||||
| Landscape-architecture coordination | 0.0231 | Bad | Low | General | Good | Prefect | ||
| Degree of heritage utilization | 0.0569 | visitors’ available heritages ratio multiply 5 | ||||||
| Heritage management quality | 0.0901 | Bad | Low | General | Good | Prefect | ||
| Protection of native culture | 0.0743 | Bad | Low | General | Good | Prefect | ||
| Residents’ living condition and participation | 0.2086 | Population density | 0.0187 | If greater than or equal to urban average, score is 5; if less, a proportion is calculated | ||||
| Per capita living space | 0.0585 | If greater than or equal to urban average, score is 5; if less, a proportion is calculated a | ||||||
| Per capita green area | 0.0939 | If greater than or equal to urban average, score is 5; if less, a proportion is calculated a | ||||||
| Community residents’ participation | 0.0374 | Scores from residents’ participation survey | ||||||
a. The indicator score = the district value/the whole urban average value × 5; b. According to the classification in government documents. |
Table 3 Results of the comprehensive assessment of Qianmen |
| First level (score) | Second level | Score |
|---|---|---|
| Infrustracture & Environment (4.56) | Environmental quality | 4.30 |
| Service facilities condition | 4.33 | |
| Transport convenience | 4.78 | |
| Infrastructure quality | 4.43 | |
| Regional fame | 4.85 | |
| Industry & Economy (4.29) | Per capita GDP | 5.00 |
| Tertiary industry | 5.00 | |
| Visitor capacity | 5.00 | |
| Tourist satisfaction | 3.66 | |
| Degree of commercial agglomeration | 4.72 | |
| Abundance of business types | 4.46 | |
| Heritage protection (3.82) | Repair-rate of ancient buildings and relics | 3.00 |
| Landscape-architecture coordination | 4.20 | |
| Degree of heritage utilization | 4.00 | |
| Heritage management quality | 3.87 | |
| Protection of native culture | 4.17 | |
| Residents’ living condition and participation (2.16) | Population density | 0.29 |
| Per capita living space | 4.37 | |
| Per capita green area | 1.61 | |
| Community residents’ participation | 1.00 |
| [1] |
|
| [2] |
|
| [3] |
|
| [4] |
|
| [5] |
|
| [6] |
|
| [7] |
|
| [8] |
|
| [9] |
|
| [10] |
|
| [11] |
|
| [12] |
|
| [13] |
|
| [14] |
|
| [15] |
|
| [16] |
|
| [17] |
|
| [18] |
|
| [19] |
|
| [20] |
|
| [21] |
|
| [22] |
|
| [23] |
|
| [24] |
|
| [25] |
|
| [26] |
|
| [27] |
|
| [28] |
|
| [29] |
|
| [30] |
|
| [31] |
|
| [32] |
|
| [33] |
|
| [34] |
|
| [35] |
|
| [36] |
|
| [37] |
|
| [38] |
|
| [39] |
|
| [40] |
|
| [41] |
|
| [42] |
|
| [43] |
|
| [44] |
|
| [45] |
|
| [46] |
|
| [47] |
|
| [48] |
|
| [49] |
|
| [50] |
|
| [51] |
|
| [52] |
|
| [53] |
|
/
| 〈 |
|
〉 |