Resource Economy

Analysis of CO2 Emissions and the Mechanism of the Industrial Enterprises above Designated Size (IEDS) in Resource-based Cities by Application of Geographical Detector Technology

  • ZHANG Wang , 1, 2, *
Expand
  • 1.College of City and Environmental Sciences, Zhuzhou, Hunan 412007, China
  • 2.Research Base for Green Industry and Low Carbon Development of City in Hunan Province, Hunan University of Technology, Zhuzhou, Hunan 412007, China
* ZHANG Wang, E-mail:

Received date: 2019-01-24

  Accepted date: 2019-07-02

  Online published: 2019-10-11

Supported by

The Ministry of Education on Cultivate Project Fund of Philosophy and Social Science Research Development Report(13JBGP004)

Copyright

Copyright reserved © 2019

Abstract

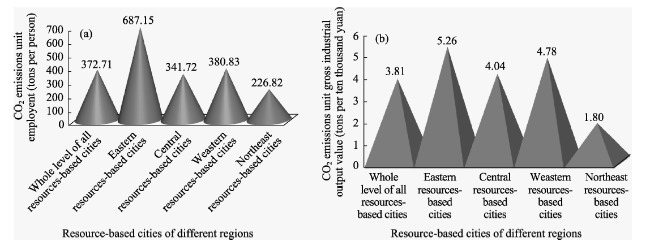
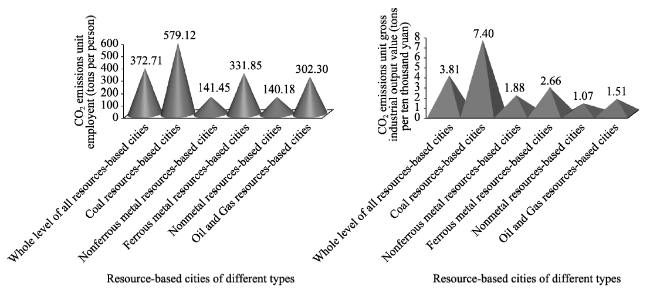
Resource-based cities are the most important players in responding to climate change and achieving low carbon development in China. An analysis of relevant data (such as the energy consumption) showed an inter-city differentiation of CO2 emissions from energy consumption, and suggested an influence of the Industrial Enterprises above Designated Size (IEDS) in resource-based industrial cities at the prefecture level and above in different regions. Then by geographical detector technology, the sizes of each influencing mechanism on CO2 emissions from energy consumption of the IEDS were probed. This analysis showed that significant spatial differences exist for CO2 emissions from energy consumption and revealed several factors which influence the IEDS in resource-based cities. (1) In terms of unit employment, Eastern and Western resource-based cities are above the overall level of all resource-based cities; and only Coal resource-based cities far exceeded the overall level among all of the cities in the analysis. (2) In terms of unit gross industrial output value, the Eastern, Central and Western resources-based cities are all above the overall level for all the cities. Here also, only Coal resource-based cities far exceeded the overall level of all resources-based cities. Economic scale and energy structure are the main factors influencing CO2 emissions from energy consumption of the IEDS in resource-based cities. The factors influencing CO2 emissions in different regions and types of resource-based cities show significant spatial variations, and the degree of influence that any given factor exerts varies among different regions and types of resource-based cities. Therefore, individualized recommendations should be directed to different regions and types of resource-based cities, so that the strategies and measures of industrial low carbon and transformation should vary greatly according to the specific conditions that exist in each city.

Cite this article

ZHANG Wang . Analysis of CO2 Emissions and the Mechanism of the Industrial Enterprises above Designated Size (IEDS) in Resource-based Cities by Application of Geographical Detector Technology[J]. Journal of Resources and Ecology, 2019 , 10(5) : 537 -545 . DOI: 10.5814/j.issn.1674-764X.2019.05.010

1 Introduction

With the typical high carbon economy of China, resource- based industries that are work- and energy-intensive and have high carbon usage, are predominantly in resource- based cities, which are usually either national or regional industrial bases or energy bases. These cities are the most important ones in China’s attempts to deal with climate change and realize low carbon development. They are now facing a great deal of pressure and many challenges in the processes of achieving green and low carbon transformation and constructing an ecologically-sound civilization. Therefore, it is of great theoretical and practical value to calculate and compare the industrial CO2 emissions from energy consumption of the Industrial Enterprises above Designated Size (IEDS) in these resource-based cities at the prefecture level and above, and also to analyze the mechanisms behind their CO2 emissions. Managing these mechanisms can be used to promote the low carbon transformation of resource- based cities, to accelerate energy-savings and CO2 reductions, and to realize the sustainable development of the economy and society.
Ramanathan (2005) studied energy consumption and CO2 emissions in Middle Eastern and North African countries, but there are few studies on resource-based cities in the United States, Germany, Canada, Australia and other countries, and they have focused mainly on either resource-based towns or mining areas. In addition, there is also limited research on the CO2 emissions of resource-based cities in domestic (Chinese) academia, and those studies that do exist can be divided into two categories. The first includes studies that focus on CO2 emissions of all resource-based cities, such as the work of Sun Shumei, who calculated the CO2 emissions and CO2 intensity per capita of 87 resource-based cities at the prefecture level. In these studies, five types of regression equations on CO2 emissions of resource-based cities were constructed, and the main factors influencing CO2 emissions in these cities were compared and analyzed (Sun, 2011). Sun et al. (2016) selected 106 resource-based cities as the research object, and then comprehensively applied DEA and SE-SBM models to study the CO2 emissions efficiency. Feng et al. (2017) combined the DPSIR model, comparisons by classification and situational analysis methods to systematically analyze the CO2 emission characteristics of 126 resource-based cities in China, based on China's high spatial resolution grid data (CHRED). That study revealed many of the challenges faced by these cities in terms of energy structure and industrial structure, as well as the future CO2 emissions trends and potential for reduction (Feng et al., 2017).
The second category includes studies on the CO2 emissions of individual resource-based cities. For example, Zhang et al. (2012) selected the modern industrial and traditional resource-based cities as the research object, choosing Baotou and Wuxi as the representatives, in order to compare and explore the similarities and differences between these two cities in terms of the CO2 emission characteristics and driving factors. Based on the analysis of the environmental Kuznets curve, Liu et al. (2014) studied the correlation and influences between CO2 per capita and GDP per capita for Urumqi, Xinjiang, in 1998-2012. Huang successively studied the CO2 emissions characteristics of Huzhou, which is a developed city (Huang, 2014), and Pingdingshan, a coal city (Huang, 2015a), and further discussed the influencing factors and the dynamic response characteristics of industrial CO2 emissions to those influencing factors in Pingdingshan city (Huang, 2015b). Zhu et al. (2015) used a Carbon Footprint Model to analyze the dynamic changes of carbon and ecological pressures from energy consumption in Xingtai during 2003-2013. In other words, although the research on CO2 emissions in resource-based cities is now becoming abundant, the methods used for exploring their failing mechanisms have mainly relied on STIRPAT, IDA and SDA models, and the research on the characteristics and mechanisms of industrial CO2 emissions in the main CO2 emission fields of Chinese resource-based cities at the prefecture level and above has not yet been conducted. For the analysis of the mechanisms, so far there has been no concern about the correlation among various factors, and studies which quantify the mechanisms influencing CO2 emissions in different resource-based cities have been very few.
In this paper, relevant data such as the energy consumption by the Industrial Enterprises above Designated Size (IEDS), is used as the basis for calculating and analyzing the spatial differences in the industrial CO2 emissions from energy consumption and its mechanisms between different regions and types of resource-based cities, and then geo- detector technology is used to explore the mechanisms influencing CO2 emissions. The aim of this paper is to provide quantitative support and a policy-making basis in order to promote individualized industrial energy-saving and CO2 reduction solutions for various resource-based, resource- intensive cities in China.

2 Data processing and research methods

2.1 Data sources and processing

There are 116 resource-based cities at the prefecture level and above, as defined by the Sustainable Development Plan of Resource-based Cities in China (2013-2020). Taking into account the more representative CO2 emissions of mining cities, six forest industry cities have been eliminated. So, this paper finally chose 110 resource-based cities at the prefecture level and above in China (Fig. 1). The data for these cities are mainly derived from the Statistical Yearbook 2016, and the energy types of these cities include coal, coke, clean coal, petrol, kerosene, diesel, fuel oil, liquefied petroleum gas, natural gas, heating power, electricity and others.

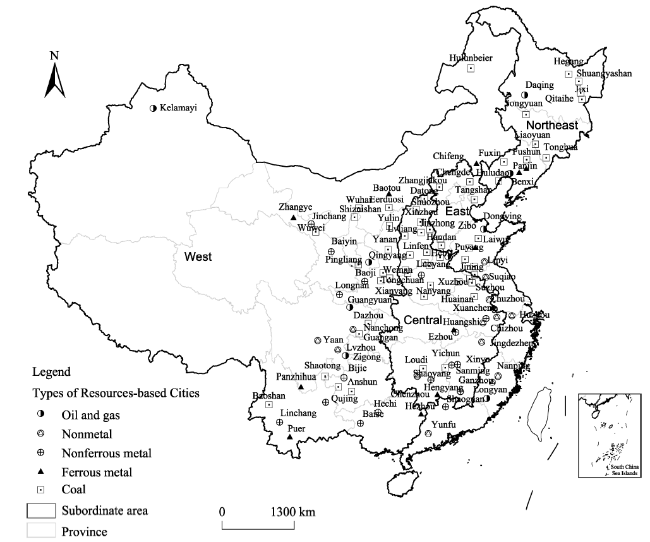
Fig. 1 The spatial distribution of subordinate areas and types of the 110 resource-based cities at prefecture level and above

Note: The subordinate areas are divided into four regions: “East”, “Central”, ”West”, and ”Northeast”, according to regional development in China; the resource-based cities are classified to five categories as “Oil and Gas”, “Nonmetal”, “Nonferrous metal”, “Ferrous metal” and “Coal”, based on the major resource types for each city.

2.2 Research methods

2.2.1 Measurement of CO2 emissions from industrial energy consumption
To measure the CO2 emissions from industrial energy consumption by the IEDS in resource-based cities, this study uses the method in the IPCC Guideline for Greenhouse Gas Emissions Inventory (IPCC, 2007). The equation is as follows:
$C=\sum\limits_{i}{{{F}_{i}}}\times {{a}_{i}}$
where C represents the total CO2 emissions from industrial energy consumption (104 t); i represents the type of energy consumption; Fi represents the total amount of terminal consumption for i type energy (104 tons of standard coal); and ai represents the coefficient of CO2 emissions for i type of energy (calculated as per ton):
ai = Average low calorific value of unit fuel × Potential CO2 emission factor × Oxidation rate in the combustion process × 44/12
The coefficients for the respective types of fossil energy, including the average low calorific value, the potential carbon emission factor and the oxidation rate in the process of fuel combustion, are derived from the Study on key issues of city carbon emission inventory (Cai, 2014); and the average calorific values of various fuels, which were converted into standard coal coefficients, are derived from the Yearbook of Energy Statistics 2016 in China.
2.2.2 Geographical detector technology
Geographical detector technology is a statistical method which can be used to detect spatial heterogeneity and reveal the driving forces. It was developed by Wang Jingfeng and Xu Chengdong. The geographical detector is a powerful tool for determining driving forces, factor analysis and spatial analysis. Because of these advantages, this technology is used to explore the explanatory variables of CO2 emissions in this study. It is very suitable when the dependent variable Y is a type of numerical data (e.g., CO2 emissions) and the independent variable X is a type of categorical data (e.g., a land use graph) (Wu et al., 2016). If the dependent variable Y and the independent X are both numerical values, then the X can be converted to categorical values by discretization. Therefore, geographical detector technology can provide a relationship between Y and X that is more reliable than the one obtained through classical regression, especially when the number of samples is less than 30 (Wang, 2017). Geographical detector software has been widely used in the natural sciences, social sciences, environmental sciences and human health studies. In this study, it is used to explore the explanatory variables of CO2 emissions. Meanwhile, according to the improved STIRPAT model (Dietz, 1994), the main factors affecting CO2 emissions are population, scale, technology and structure, and others, so we chose sector employment, economic scale, energy efficiency and energy structure as the independent variables in the paper (Table 1).
Table 1 Definition of variables
Variable symbol Variable type Description
Y Dependent The CO2 emissions from industrial energy consumption by the IEDS in resource-based cities
X1 Independent Sector employment in each city
X2 Independent Economic scale (ratio of industrial output value to sector employment) of each city
X3 Independent Energy efficiency (the ratio of total energy consumption to industrial output) of each city
X4 Independent Energy structure (sum of the ratios of energy consumption from coal to consumption of coal, petroleum,
natural gas, heat and electricity, respectively) of each city
According to the operational requirement of geographical detector technology, the four numerical independent vari- ables need to be discretized and converted into categorical values through the equal spacing method.
The spatial heterogeneity of geographical objects is normally influenced by factors from either the natural environment or the economy and society. In addition, the geographical detector method is a logical choice for exploring the formative mechanisms and analyzing the influential factors. The first application of this method was for analyzing the causes of local diseases (Wang, 2010), and the model formula is as follows:
${{P}_{D,U}}=1-\frac{1}{n\delta _{U}^{2}}\sum\limits_{i=1}^{m}{{{n}_{D,i}}\delta _{{{U}_{D,i}}}^{2}}$
where ${{P}_{D,U}}$ is the factor influencing the CO2 emissions from industrial energy consumption by the IEDS in resource-based cities, ${{n}_{D,i}}$ represents the number of samples in the secondary region (type), n is the number of samples of the whole region (type), and m is the number of secondary region (type); and $\delta _{U}^{2}$ represents the variance of CO2 emissions for the whole region (type), while $\delta _{{{U}_{D,i}}}^{2}$ denotes the variance of the secondary region (type). Assuming $\delta _{{{U}_{D,i}}}^{2}$≠0, the model is established, and the value range of ${{P}_{D,U}}$ is [0,1]; if ${{P}_{D,U}}$= 0, it indicates that the distribution of CO2 emissions is random, and the larger the value of ${{P}_{D,U}}$, the greater the impacts of the subregion (type) factors on the CO2 emissions. In the next of this paper, the extents to which the four types of potential influencing factors (sector employment number, economic scale, energy efficiency and energy structure) affect CO2 emissions are determined.

3 Results

3.1 Correlation analysis of variables based on CO2 emissions

According to formula (1), the CO2 emissions from industrial energy consumption of the IEDS in 110 resource-based cities at the prefecture level and above were calculated, and the data for factors influencing CO2 emissions were collected and collated from the Statistical Yearbook 2016 of each city. After that, we used Pearson correlation coefficients to investigate the relative relationships among five variables. These five variables included the dependent variable Y, which represents the CO2 emissions from industrial energy consumption of the IEDS in the resource-based cities, and the independent variables, such as sector employment (X1), economic scale (X2), energy efficiency (X3) and energy structure (X4). The results show that:
(1) The correlation coefficient between CO2 emissions from industrial energy consumption of the IEDS and energy efficiency is 0.672, while the correlation coefficient between economic scale and energy efficiency is -0.328, and these two correlation coefficients are statistically significant at the 0.01 level (bilateral).
(2) The correlation coefficient between CO2 emissions from industrial energy consumption and sector employment is 0.247, while the correlation coefficient between sector employment and economic size is -0.252. The figure for economic size and energy structure is 0.284, and these three correlation coefficients are statistically significant at the 0.05 level (bilateral).
(3) The correlation coefficients between the other variables are minimal (< 0.15), and three groups of correlation coefficients indicate negative correlations, including those between CO2 emissions from industrial energy consumption and economic scale, sector employment and energy efficiency, as well as energy structure and energy efficiency. The other correlation coefficients for the remaining variables groups are all positive.
(4) In general, the Pearson correlation coefficients between the four independent variables are less than 0.33, and these relatively low values just indicate that the variables are independent, and also show that multi-collinearity does not exist. So, it is suitable to use this multivariate geographical detector model.
Table 2 Results of the correlation analysis between variables
Variable Y X1 X2 X3 X4
Y 1
X1 0.247* 1
X2 -0.090 -0.252* 1
X3 0.672** -0.068 -0.328** 1
X4 0.066 0.089 0.284* -0.144 1

Note: * indicates significant correlation at the 0.05 level, ** indicates significant correlation at the 0.01 level (bilateral).

3.2 Analysis of the inter-city differences in CO2 emissions and their mechanisms

There are significant spatial differences in CO2 emissions from the industrial energy consumption of the IEDS and their influencing factors (Table 3). From the perspective of CO2 emissions from industrial energy consumption of the IEDS, there is a large gap between the highest and lowest values, with the maximum value (42716.77×104 t) at Tangshan and the minimum value (56.89×10⁴ t) at Panjin; the average value is at 7519.81×104 t, and the standard deviation is 8425.11×104 t. The second perspective is sector employment. Its average and standard deviation are 20.18×10⁴ and 14.12×10⁴ persons, respectively; the largest value is from Linyi, up to 77.80×10⁴ persons while the lowest value is from Xuancheng, at only 4.32×10⁴ persons. Thirdly, from the perspective of economic scale, the average and standard deviation are 112.68 and 86.00×10⁴ yuan per person, respectively; the largest value is from Xingtai, at 451.14×10⁴ yuan per person, while the smallest value is from Huaibei, at 7.46×10⁴ yuan per person. The fourth perspective is in terms of energy efficiency. The differences here are particularly uneven (spanning three orders of magnitude), as the most efficient city is Panjin with only 0.01 tons per 104 yuan, and the least efficient city is Shuozhou with 21.28 tons per ten thousand yuan. The average is 2.55 tons per ten thousand yuan and the standard deviation is 4.24 tons per ten thousand yuan. Lastly, the descriptive statistics of the energy structure are as follows: the average is 1.81 and the standard deviation is 2.75; the difference is also very large, as the oil city of Dongying has a value of 21.52, while the value is just 1.00 at Huaibei where the clear majority of burning energy is coal.
Table 3 The CO2 emissions from energy consumption and influencing factors of IEDS in resource-based cities
Variable Average Standard deviation Maximum value Minimum value
CO2 emissions (×104 t) 7519.81 8425.11 42716.77 56.89
Sector employment (×104 person) 20.18 14.12 77.80 4.32
Scale of the economy (×104 yuan per person) 112.68 86.00 451.14 7.46
Energy efficiency (tons per 104 yuan) 2.55 4.24 21.28 0.01
Energy structure 1.81 2.75 21.52 1.00
The resource-based cities in China are divided into four regions (Fig. 1) as “East”, “Central”, “West” and “Northeast”, in order to compare and analyze the spatial differences of CO2 emissions per unit of employment and CO2 emissions per unit of output (Fig. 2). From the viewpoint of CO2 emissions per unit of employment, the values of the industrial cities in the eastern and western areas in China exceed the overall level of the resource-based cities, with the maximum value (687.15 tons per person) in eastern resource-based cities. On the other hand, the values of the central and northeastern resource-based cities are lower than the overall level, with the minimum value (226.82 tons per person) in the northeastern industrial cities. From the viewpoint of CO2 emissions per unit of output, the figures for eastern, central and western resource-based cities all exceed the overall level of the resource-based cities; and only the figure for northeast resource-based cities is below the overall figure for the resource-based cities. The eastern resource- based cities have the largest number of 5.26 tons per ten thousand yuan, while the northeastern resource-based cities have the smallest, with only 1.80 tons per ten thousand yuan, which may be related to the economic downturn in northeast industries in recent years. In short, the tasks of reducing CO2 emissions and achieving low carbon transformation in the eastern and western resource-based cities are the most onerous, with the central second and the northeast the least.

Fig. 2 CO2 emissions from energy consumption per unit of employment and per unit of output of the IEDS in resource-based cities of different regions

According to the types of resource endowment, the 110 resource-based cities are divided into five categories, which are Oil and Gas, Nonmetal, Nonferrous metal, Ferrous metal and Coal (Liu, 2016). A comparative analysis in terms of CO2 emissions per unit of employment and per unit of output was carried out for the 110 cities (Fig. 3). The results in terms of CO2 emissions per unit of employment show that only the values in Coal-based cities are larger than the overall level of all resource-based cities (and they are much larger), while the remaining four categories are all lower than the overall level. For example, the figures for Nonferrous metal and Nonmetal cities are just 40% of the overall level of the resource-based cities. The results from CO2 emissions per unit of output show similar trends, with the values in Coal-based cities being far larger than the overall level of the resource-based cities, while the values in the remaining four categories of cities are lower than the overall level of the industrial cities. Here, the figure for Nonmetal-based cities is the lowest, at only 1.07 tons per ten thousand yuan. In sum, the characteristics of high CO2 emissions are obvious and the pressure for reducing CO2 emissions is greatest in Coal-based cities.

Fig. 3 CO2 emissions from energy consumption per unit of employment and per unit of output of the IEDS in different types of resource-based cities

3.3 Analysis of mechanisms of CO2 emissions based on the geographical detector

According to the steps of the geographical detector technology, every independent variable should be first discretized by the equal spacing method, and then formula (2) can be used to calculate the coefficients of each factor’s influence on CO2 emissions from industrial energy consumption of the IEDS in all of the resource-based cities (Table 4). The ${{P}_{D,U}}$ values of all factors in the results are arranged in order from largest to smallest as: economic scale (0.9855), energy structure (0.8529), sector employment (0.5094), and energy efficiency (0.0196). Thus, economic scale and energy structure generally constitute the main factors that affect CO2 emissions from industrial energy consumption in all resource-based cities. To explore the mechanisms of CO2 emissions from industrial energy consumption, this study divides resource-based cities into four regions and five types and analyzes the differences in the influencing coefficients.
Table 4 Results of geographical detector analysis of the different factors influencing CO2 emissions from industrial energy consumption in resource-based cities of different regions
Region name Sector employment Economic scale Energy efficiency Energy structure
Eastern industrial cities 0.4302 0.5635 0.0001 0.8116
Central industrial cities 0.9976 0.9971 0.0001 0.3520
Western industrial cities 0.4250 0.9674 0.5435 0.9452
Northeast industrial cities 0.0871 0.9943 0.8539 0.5584
Overall level for all of the industrial cities 0.5094 0.9855 0.0196 0.8529
3.3.1 Analysis of mechanisms and their inter-city differences for CO2 emissions in resource-based cities in different regions
After the analysis of CO2 emissions from industrial energy consumption by using the geographical detector, ${{P}_{D,U}}$ values for each factor in the industrial cities in different regions are reported (Table 4). For the eastern industrial cities, the coefficients for influences on CO2 emissions from industrial energy consumption of the IEDS for the energy structure, economic scale, sector employment, and energy efficiency are 0.8116, 0.5635, 0.4302 and 0.0001 respectively; the figures for the central industrial cities are sector employment (0.9976), economic scale (0.9971), energy structure (0.3520) and energy efficiency (0.0001); the figures for western industrial cities are economic scale (0.9674), energy structure (0.9452), energy efficiency (0.5435), and sector employment (0.4250); and the figures for northeast industrial cities are economic scale (0.9943), energy efficiency (0.8539), energy structure (0.5584), and sector employment (0.0871).
The degrees of influence for any given factor on resource-based cities in different regions vary. Arranged from largest to smallest, for the resource-based cities the influences of sector employment are central (0.9976), east (0.4302), west (0.4250), and northeast (0.0871); the influences of economic scale are central (0.9971), northeast (0.9943), west (0.9674), and east (0.5635); the influences of energy efficiency are northeast (0.8539), west (0.5435), central (0.0001), and east (0.0001); and the influences of energy structure are west (0.9452), east (0.8116), northeast (0.5584) and central (0.3520).
3.3.2 Analysis of mechanisms and inter-city differentiation of CO2 emissions in different types of resource-based cities
With the application of the geographical detector, ${{P}_{D,U}}$ values for each factor that is related to CO2 emissions from industrial energy consumption in different types of resource-based cities were determined, and the results are shown in Table 5. The factors influencing CO2 emissions from industrial energy consumption of the IEDS for Coal resource-based cities are economic scale (0.9986), energy structure (0.8394), sector employment (0.6614), and energy efficiency (0.2886). But since reducing the size of the economy is not advisable, the key ways to reduce carbon are likely to involve constraining excess capacity and reducing the proportion of coal consumption. For Nonferrous metal resource-based cities, the results are energy efficiency (0.8388), economic scale (0.8376), sector employment (0.2879) and energy structure (0.2609), which indicates that the main options for reducing CO2 emissions are significantly improving energy efficiency and properly removing capacity. For Ferrous metal resource-based cities, the figures are economic scale (0.7512), energy efficiency (0.5209), sector employment (0.1702), and energy structure (0.0001), indicating that limiting steel production capacity and achieving attrition and efficiency can be the core paths for achieving the low carbon goal. Figures for Nonmetal resource-based cities are energy structure (0.8722), energy efficiency (0.7073), economic scale (0.0757), and sector employment (0.0430), indicating that reducing the proportion of coal consumption and increasing the efficiency of energy consumption can be the main ways to save energy and reduce CO2 emissions. For Oil and Gas resource-based cities, the figures are economic scale (0.7371), energy efficiency (0.7154), energy structure (0.5697), and sector employment (0.5265), which indicates that the important keys for CO2 reduction are likely to be the proper limiting of production capacity and improving energy structure.
Table 5 Results of geographical detector analysis of the factors influencing CO2 emissions from industrial energy consumption in different types of resource-based cities
Resource-based city type Sector employment Economic scale Energy efficiency Energy structure
Coal 0.6614 0.9986 0.2886 0.8394
Nonferrous metal 0.2879 0.8376 0.8388 0.2609
Ferrous metal 0.5209 0.7512 0.0001 0.1702
Nonmetal 0.0430 0.0757 0.7073 0.8722
Oil and Gas 0.5265 0.7371 0.7154 0.5697
Industrial cities overall 0.5094 0.9855 0.0196 0.8529
Compared horizontally in Table 5, the degrees of influence for a given factor in different types of resource-based cities vary. Arranged in order from largest to smallest, for the influence of sector employment, the coefficients in terms of resource-based city type are Coal (0.6614), Oil and Gas (0.5265), Ferrous metal (0.5209), Nonferrous metal (0.2879), and Nonmetal (0.0430); for the influence of economic scale, the figures are Coal (0.9986), Nonferrous metal (0.8376), Ferrous metal (0.7512), Oil and Gas (0.7371), and Nonmetal (0.0757); for the influence of energy efficiency, the figures are Coal (0.9986), Nonferrous metal (0.8376), Ferrous metal (0.7512), Oil and Gas (0.7371), and Nonmetal (0.0757); for the influence of energy structure, figures for each resource- based city type are Nonferrous metal (0.8388), Oil and Gas (0.7154), Nonmetal (0.7073), Coal (0.2886), and Ferrous metal (0.0001); and for the influence of energy structure, figures for each city type are Nonmetal (0.8722), Coal (0.8394), Oil and Gas (0.5697), Nonferrous metal (0.2609), and Ferrous metal (0.1702).

4 Conclusions

This paper classified resource-based cities at the prefecture level and above into four regions and five types. The CO2 emissions from resource-based energy consumption were calculated and the geographical detector method was used to analyze the underlying mechanism and reveal the spatial differences of CO2 emissions and the influencing factors. From these analyses, the following conclusions are drawn:
(1) The correlation coefficient between CO2 emissions from industrial energy consumption of the IEDS and energy efficiency is the largest, and the correlation coefficient between economic scale and energy efficiency is relatively large, while the correlation coefficients for other pairs of the four independent variables, including sector employment, economic scale, energy efficiency and energy structure, are much smaller.
(2) The CO2 emissions from industrial energy consumption of the IEDS and their influencing factors are significantly different among various resource-based cities. The largest and smallest figures, respectively, were for: CO2 emissions in Tangshan and Panjin, sector employment in Linyi and Xuancheng, economic scale in Xingtai and Xuancheng, and energy efficiency in Panjin and Shuozhou. The best and worst cities for energy structure are Dongying and Huaibei, respectively.
(3) For CO2 emissions per employment, the figures for the eastern and western resource-based cities all exceed the overall level of the whole sample of resource-based cities. Only the figure for the Coal resource-based industrial cities exceed the average level, and it did so by a wide margin. For CO2 emissions per unit of output, the figures for the eastern, central and western resource-based cities all exceed the overall level of the whole sample of resource-based cities, and only the figure for the Coal resource-based industrial cities exceed (by far) the average level.
(4) Economic scale and energy structure are the main factors influencing CO2 emissions from industrial energy consumption of the IEDS in resource-based cities. The spatial differentiation of factors that influence CO2 emissions from industrial energy consumption in resource-based cities is significant, both in terms of city types and locations, and the different factors also have diverse influences on CO2 emissions in cities from different regions and types. Therefore, we should adopt different countermeasures and actions to achieve low carbon transformation according to the specific characteristics of each region and type of resource- based city.
The problem of low carbon transformation in resource- based cities is globally-recognized to be a difficult problem, and the green and low-carbon transformation with the background of ecological civilization is more complicated. Therefore, it is necessary to collect more panel data and carry out concrete and in-depth studies on industrial CO2 emissions and their mechanisms in resource-based cities at different times, of different types and at different stages of development.
[1]
Cai B F. 2014. Study on Key Issues of City Carbon Emission Inventory. Beijing: Chemistry Industry Press. (in Chinese)

[2]
Dietz T, Rosa E A . 1994. Rethinking the environmental impacts of population, affluence and technology. Human Ecology Review, (1):277-300.

[3]
Feng X Z, Cai B F, Wang M , et al. 2017. A comparative study on CO2 emission of resource-based cities in China. China Population, Resources and Environment, 27(2):5-9.

[4]
Huang F . 2014. Carbon emissions in resources-based city of developed area: A case study of Huzhou city. Henan Science, 32(19):232-233. (in Chinese)

[5]
Huang F . 2015a. Response of industrial carbon emissions to the driving factors in coal-oriented city. Henan Science, 33(5):806-810. (in Chinese)

[6]
Huang F . 2015b. Carbon emissions in coal-oriented city:A case study of Pingdingshan city. China Mining Magazine, 24(10):83-87, 93. (in Chinese)

[7]
IPCC. 2007. Working Group III Report “Mitigation of Climate Change”. Cambridge, United Kingdom and New York: Cambridge University Press.

[8]
Liu C Y, Gao Z G . 2014. Kuznets curve study on carbon emission in resources-based city: A case study on Urumqi. Resources Industries, 16(5):1-7. (in Chinese)

[9]
Liu Y G . 2016. The reconsideration of the method to define Chinese resource-based cities. Economic Geography, 26(6):940-944.

[10]
Ramanathan R . 2005. An analysis of energy consumption and carbon dioxide emissions in countries of the Middle East and North Africa. Energy, 28(15):2831-2842.

[11]
Sun X M . 2011. Research on the Mechanism and Regulation Measures of Low-carbon Transformation in Resource-based Cities. Xuzhou: China University of Mining and Technology. (in Chinese)

[12]
Sun X M, Wang G, Dong H Z , et al. 2016. Research on efficiency of carbon emission of resource-based cities based on DEA model and SE-SBM model: A case study on 106 level of China mutual ground and above resource-based cities. Science and Technology Management Research, 36(23):78-84. (in Chinese)

[13]
Wang J F, Li X H, George Christakos G , et al. 2010. Geographical detectors-based health risk assessment and its application in the neural tube defects study of the Heshun Region, China. International Journal of Geographical Information Science, 24(1):107-127.

[14]
Wang J F, Xu C D . 2017. Geodetector: Principle and prospective. Acta Geographica Sinica, 72(1):116-134. (in Chinese)

[15]
Wu R N, Zhang J Q, Bao Y H , et al. 2016. Geographical detector model for influencing factors of industrial sector carbon dioxide emissions in Inner Mongolia, China. Sustainability, 8(2):149-160.

[16]
Zhang W Y, Duan X J, Y L , et al. 2012. Comparisons and analysis of the carbon emissions from energy consumption between the resources- based industrial cities and the modern industrial city: A case study on Wuxi and Baotou. Economic Geography, 32(1):119-125.

[17]
Zhu C, Zhang L X, Li Y P . 2015. Dynamic change and measures analysis of carbon footprint of energy consumption in Xingtai City. Acta Scientia rum Naturalism Universitatis Pekinese. 51(6):1166-1170. (in Chinese)

Outlines

/