Environmental Pollution and Ecosystem

Report on the Diatoms and Dinoflagellates Distribution along the Algerian Coasts: Inter-Region Comparison

  • Zakia MOKRANE , 1, 2, * ,
  • Mustapha BOUDJENAH 1, 3 ,
  • Yasmina BELKACEM 1 ,
  • EL Hadi MORSLI 1 ,
  • Ahmed INAL 1 ,
  • Fahima BOUARAB 1
Expand
  • 1. National Center for Research and Development of Fisheries and Aquaculture (CNRDPA)/ Bou-Ismail, Tipaza 42415, Algeria
  • 2. FSB-USTHB/ Pelagic ecosystem laboratory, Algiers No 32 El-Alia, Bab Ezzouar 16111, Algeria
  • 3. Department of Marine Sciences, Faculty of Natural and Life Sciences, Abdelhamid Ibn Badis University of Mostaganem P. 300, Algeria
*Corresponding author: MOKRANE Zakia, E-mail:

Received date: 2018-08-14

  Accepted date: 2019-01-28

  Online published: 2019-07-30

Supported by

Aquatic Environment Monitoring and Quality Research Program Funded by the National Center for Research and Development of Fisheries and Aquaculture (AIEA-RAF 7012 Project)

Copyright

All rights reserved

Abstract

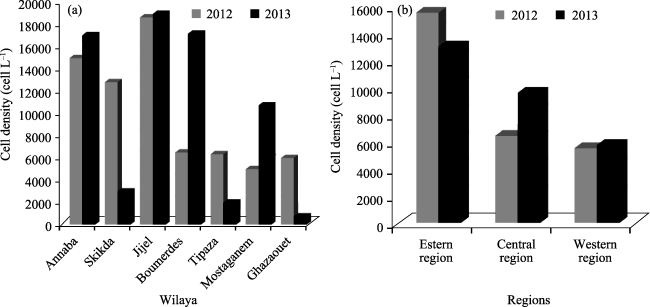
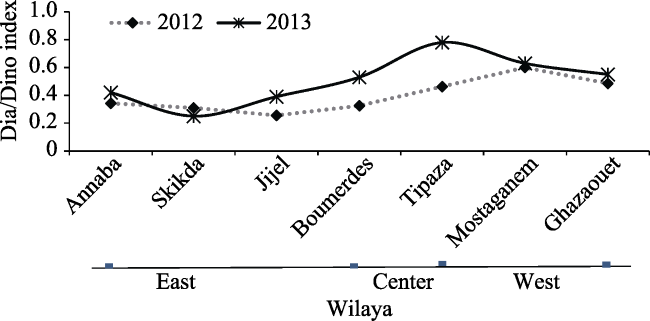
The phytoplankton group’s composition is an excellent indicator of the state of coastal waters. The aim of this study is to explore spatial variability of phytoplankton in shallow coastal areas from different regions (East, Center and West) of the Algerian coast. The quantitative and qualitative study of the phytoplankton population was conducted on samples taken during the 2012-2013 period by the research vessel GRINE BELKACEM. The qualitative results show a significant diversity of diatoms and dinoflagellates, which rank first and second in the total flora (Fr > 50%). This finding is also confirmed quantitatively by the abundance values in both 2013 and 2012 samples which largely exceeds the average value in most other areas of the western region (56%) and slightly exceeding 52% in all central areas which represent an equi-distribution between diatoms and dinoflagellates. The Dinoflagellates contribute significantly to the quantitative richness in the eastern region (>60%). The minimum value of Dia/Dino index, recorded in the eastern region confirms the dominance of the dinoflagellates especially in Skikda (0.31) (Skikda).However, our results reveal the presence, in smaller proportion, of other groups such as the cocolithophoridae and euglenophyceae.

Cite this article

Zakia MOKRANE , Mustapha BOUDJENAH , Yasmina BELKACEM , EL Hadi MORSLI , Ahmed INAL , Fahima BOUARAB . Report on the Diatoms and Dinoflagellates Distribution along the Algerian Coasts: Inter-Region Comparison[J]. Journal of Resources and Ecology, 2019 , 10(4) : 432 -440 . DOI: 10.5814/j.issn.1674-764X.2019.04.010

1 Introduction

Coastal zones are an essential aquatic ecosystem; these areas are very productive although they represent only a small area with 7% of the ocean surface. The phytoplankton which constitutes a true biological pump (Guiselin, 2010), attracted increased attention from marine biologists at the beginning of the twentieth century. The specific composition of phytoplankton communities, the relative abundance of the various species, and the dominance of one population over another are all evolving traits and phenomena that characterize phytoplankton successions in coastal zones (Gailhard, 2003). In this view, the dynamics of phytoplankton populations is examined through the overall community responses to environmental changes, which is essential to understanding the role of autotrophic producers in the functioning of the coastal pelagic ecosystem (Smayda, 1997). Studies on this composition and dynamics of plankton communities in the coastal areas of the Mediterranean Sea have increased over the last few decades. However, information is often limited to coastal areas and is generally confined to the northern Adriatic. Phytoplankton has been the subject of few studies and articles at the national level, and this is the first study that targets the biodiversity, distribution and structure of this population. Though, in Algeria, the protection of marine ecosystems is a priority in the national development program of aquaculture and fishing activities (Madrep, 2015), the present work is part of a process to determine the phytoplankton composition in some sites along the Algerian coast. The main thrust of this study is to make a quantitative and qualitative assessment in order to explore the phytoplankton diversity, and in parallel, to provide some indicators for the monitoring of the Algerian marine environment. This paper focuses on a phytoplankton indicator, the diatom/dinoflagellate index (Dia/ Dino index) first suggested for the Baltic Sea by Wasmund et al. (2017). Subsequently, the index was endorsed by the Baltic Marine Environment Protection Commission (HELCOM) as a core indicator (HELCOM, 2016). Phytoplankton is one of the important resources information necessary in every ecosystem-approach of the present work, especially with the very ambitious program launched by the Algerian State in marine aquaculture for the 2020 horizon.

2 Materials and methods

2.1 Study area

To understand the information on the different qualitative and quantitative aspects of the phytoplankton population along the Algerian coast, the study relies on data collected during the prospecting campaign of the Algerian demersal resources, conducted during the summer 2013 by the research vessel CNRDPA1)( CNRDPA/ National Center for Research and Development of Fisheries and Aquaculture) (National Center for Research and Development of Fisheries and Aquaculture) which is named “Grine Belkacem”. The campaign collected seawater samples over the entire Algerian coast, across the western, central and eastern sectors, taking into account the temperature and salinity of each chosen station.
Campaign ALDEM 20122)(ALDEM2012/Algerian demersal campaign for the year 2012) and ALDEM 20133)( ALDEM2013/ Algerian demersal campaign for the year 2013): The demersal resources assessment campaign “ALDEM 2012 and ALDEM 2013” was conducted aboard the research vessel. It concerned the trawl bottoms of the Algerian coast between 20 and 800 meters deep (Plateau and continental slope), Cape Segleb (36°56°45ʺN, 8°36°57ʺE) Algerian-Tunisian borders to Wadi Kiss (35°3°49ʺN, 2°12°50ʺW) Algerian- Moroccan borders. The Algerian coastline is divided into three sectors: Center, East and West (Fig. 1). Ras El Afia (36°49°00ʺN, 5°41°00ʺE) represents the boundary between the East and the Center, and Cape Kramis (36°19°41ʺN, 00°39°43ʺE) represents the boundary between the Center and the West.
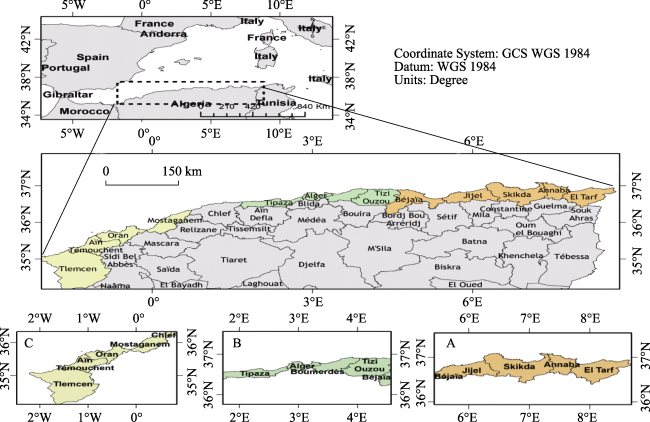
Fig. 1 Location of the study area (Wilaya) and subdivision of the Algerian basin
Note: A is Eastern Region, B is Central Region and C is Western Region.

2.2 Sampling and methods

The samples were taken by the research vessel “GRINE BELKACEM” along 50 radials perpendicular to the coast with one or two stations per radial. The radials were selected in a grid pattern across the study region. During this campaign, In-situ hydrological measurements (temperature and salinity records) were carried out vertically by a CTD probe (Sea Bird SBE 19 plus) and horizontal by a thermosalinograph (Sea Bird SBE 21) installed onboard the research vessel. In this work, and for each campaign, about 60 stations were chosen for the treatment and study of phytoplankton. The position of the different study areas are noted in the following table 1.
Table 1 Geographical coordinates for each sampling wilaya per region (East, Center and West)
Zones Wilaya Longitude (N) Latitude (E)
Eastern region Annaba 37°1°21ʺ 8°2°0ʺ
Skikda 37°1°18ʺ 7°14°7ʺ
Jijel 36°54°45ʺ 6°3°11ʺ
Central region Boumerdes 36°50°15ʺ 3°25°30ʺ
Tipaza 36°49°42ʺ 2°45°12ʺ
Western region Mostaganem 36°3°7ʺ -0°5°57ʺ
Ain-Temouchent 35°29°3ʺ -1°14°26ʺ
The phytoplankton dynamics study is divided into three distinct stages: sampling; fixation, observation of the samples; and finally, the graphic and statistical processing of the data.
(1) Sampling: Seawater for qualitative and quantitative study is carried out using 5 liter capacity Niskin PVC bottles. The treatment protocol of this stand adopted in this study is based on the standards related to the Utermöhl method (Utermöhl, 1958).
(2) Observation and identification of species: Phytoplankton analysis in this framework is carried out in accordance with the recommendations of the Guide Standard for the Counting of Phytoplankton by Reverse Microscopy - Standard AFNOR(2006) of December 2006- corresponding to the Utermöhl method ((Utermöhl, 1958), adopted at the European level. Determination of phytoplankton species was performed at the specific level or in case of difficulty or uncertainty at a lower level (genus, family and class) using the following keys: monograph phytoplankton catalog, Meunier (1915); Schiller (1933); Schiller (1937); Meave-Del Castillo (2009); Meave-Del Castillo et al. (2012) and Taylor (1976).
(3) Analysis of results: In this section, we are also interested in the cell density variations in the different stations and wilaya (province).

2.3 Diversity and structure of the phytoplankton population

Two main indices have been developed, the Shannon- Wiener Index and Equitability Index.
2.3.1 Shannon-Wiener index (H°)
The Shannon Index would indicate that the number of species in a community depends on the stability of the environment and the large index can be explained by a stable environment and vice-versa. This index is given by the following formula:
${H}'=-\mathop{\sum }^{}\left( {{P}_{i}} \right)\left( {{\log }_{2}}{{P}_{i}} \right)$ (1)
Where ${{P}_{i}}={{n}_{i}}/N$, Pi is specific abundance; N is total number of phytoplankton population considered; ni is the number of individuals of the species i.
This index varies in the range -log2 S and log2 S (S is the specific richness); The unit of information is the Bits Ind-1 (The Bits is the simplest unit in a number system).
2.3.2 Equitability index (E)
Since diversity depends on both the relative frequencies of the species and the number of species that can vary widely from one stand to another. It is defined by the formula:
$E=\frac{ISh}{\text{lo}{{\text{g}}_{2}}S}$ (2)
Equitability Index varies between “0” and “1”. It tends towards “0” when the most effective are concentrated on one species; It tends to “1” when all species have the same abundance.

2.4 Diagrams Rank-Frequency (RFD)

The Rank-frequency diagrams (RFD) were established to describe phytoplankton samples. The species were ranked by decreasing abundance along the x-axis and by relative frequency along the y-axis. According to Margalef (1961), it is possible to characterize a phytoplankton succession by three stages. These successions can be graphically monitored using “Diagrams Rank-Frequency” of Frontier (1983). Stage1: Beginning of succession and indicating the predominance of a very small number of species (one or two species); Stage 2: Maturity of the system and maximum diversity; Stage 3: The end of this succession with reduced diversity.

2.5 Diatoms/ Dinoflagellates index

Dia/Dino index reflects the dominance patterns in the phytoplankton composition (Abundance or Biomass HELCOM (2014) and HELCOM (2016). It is defined by the following formula (Wasmund et al., 2017):
Dia/Dino index= Ab Dia / (AbDia+Ab Dino) (3)
Where, Ab Dia is Diatoms Abundance (%); Ab Dino is Dinoflagellates Abundance (%). Averages of planktonic diatoms biomass (BMDia) have to be divided by the combined biomass or abundance of planktonic diatoms + mixotrophic dinoflagellates (BMDino). This leads to a simple absolute measure with values ranging from 0 to 1. The value of the Dia/Dino index is more than 0.5 if diatoms are dominant and the value of the index is less than 0.5 if Dinoflagellates are dominant.

3 Results and discussion

3.1 Qualitative approach

It consists of identifying and enumerating directly the planktonic flora. In this work, the inventory of phytoplankton species obtained in 2012 and 2013 is respectively106 and 125 species listed in two different important groups: Diatoms and Dinoflagellates. Another less frequent group was considered; it includes the Cyanobacteria, Euglénophycées, Chlorophyceae and Foraminifera classes. In reference to the ALDEM 2013 data, Dinoflagellates rank first with 69 species, representing more than 55% of the total phytoplankton community, Followed by Diatoms with 46 species or a proportion of 36%. Specifically for 2012, Dinoflagellates ranked first with 88 species, or more than 83.01% of the phytoplankton community, followed by Diatoms (with 18 species and aproportion of 16.98%). For both campaigns, in the third rank and with a weak representation we can mention Coccolithophorids and various other classes with 1.6% and 4%, respectively.
3.1.1 The dinoflagellates
In 2012: In this qualitative analysis we observed a large diversification of dinoflagellates represented by planktonic and other benthic units. The main genera regularly encountered were Peridinium, Protoperidinium and Ceratium genus holding the first places with respectively 15.90%, 13.63% and 15.90% of the total abundance.
In 2013: The main genera encountered regularly are: Gymnodinium with 10 species or 28.98% in total Dinoflagellates specific richness with a maximum in the eastern Algerian coast. The second genus Ceratium with 15.94% (11 species, the most frequent C. furca, C. shrank, C. longipes, C. fusus, C. declimatum). During this period of study (2012-2013) we identified a contingent of less frequent to rarest species: Oxytoxum, Peridinium, Dinophysis, Fragilidium, Ornithocercus, Gyrodinium, Katodinium, Oodinium.
3.1.2 Thediatoms
In 2012: a low specific diversity observed with only 18 species (16.98%) in this plankton group and the Amphora genus marks this inventory with two species, with a proportion of more than 27.2% (A. angusta, A.pusio). Some rare species of diatoms belonging to the genus Fragilidium sp and Cycolotella sp were observed.
Table 2 The different genera and their classification
Dinoflagellates species Diatoms species
Order Family Genus Order Family Genus
Prorocentrales Prorocentraceae Mesoporos Biddulphiales Thalassiosiraceae Skeletonema
Prorocentrum Thalassiosira
Dinophysiales Dinophysiaceae Dinophysis Melosiraceae Melosira
Ornithocercus Stephanopyxis
Oxyphysaceae Oxyphysis Leptocylindraceae Leptocylindrus
Gymnodiniales Gymnodiniaceae Ampbidinium Coscinodiscaceae Coscinodiscus
Gymnodinium Hemidiscaceae Hemidiscus
Karenia Rhizosoleniaceae Rhizosolenia
Katodinium Guinardia
gyrodinium Biddulphiaceae Biddulphia
Torodinium Hemiaulaceae Cerataulina
Amphitholaceae Achradina Eucampia
Noctilucales Kofoidiniaceae Kofoidinium Chaetocerotaceae Chaetoceros
Noctilucaceae Noctiluca Lithodesmiaceae Bellerochea
Gonyaulacales Ceratiaceae Ceratium Dtylum
Goniodomataceae Alexandrium Bacillariales Fragilariaceae licmophora
gonyaulax Synedra
Protoceratium Rhaphoneidaceae Rhaphoneis
Oxytoxaceae Oxytoxum thalassionemataceae Thalassionema
Pyrocystaceae Pyrocystis Naviculaceae Navicula
Fragilidium Pinnulariaceae Pinnularia
Pyrophacus Haslea
Peridiniales Heterocapsaceae Heterocapsa Pleurosigma
Peridiniales Calciodinellaceae Scrippsiella Bacillariaceae Bacillaria
Diplopsalopsis Cylindrotheca
Diplopsalis Pseudo-nitzschia
Preperidinium
Peridiniaceae Peridinium
Protoperidiniaceae Protoperidinium
Kryptoperidinium
Blastodiniales Oodiniaceae Oodinium
Nitzschia
Surirellales Surirellaceae Surirella
In 2013: In reference to this campaign the group of diatoms is significantly represented with a specific richness of 46 species (36%). This group combines two subclasses centric and pinnate diatoms with respective proportions of 52% and 28.22%. In fact, two genera, namely Leptocylindrus and Coscinodiscus which are equitably preeminent with 4 species and a proportion of more than 8.69%. Among these species we can list L. danicus, L. belicus, L. minim and C. granii.

3.2 Quantitative approach

3.2.1 Frequency and abundance of phytoplankton groups (2012-2013)
The results show the abundance of dominant groups in East, Center and West regions where the frequency of dinoflagellates and Diatoms classes are the highest and constant phytoplankton groups (Fr> 50%) compared to other taxonomic groups. This is also confirmed by the values of abundance in the sample of 2013 and 2012 which largely exceeds the average value of 50% in most wilayas of the western region (56%) and slightly exceeding 52% in the wilayas of the central region with an equi-distribution between diatoms and dinoflagelates. The dinoflagellates contribute significantly to the quantitative richness in the eastern region with more than 60%. The remainder of the phytoplankton composition indicates that the Coccolithophorids are the rarest group (Fr<25%). This explains the fact that they are less competitive than the others microalgae. The observations recorded during our study show that the most important relative frequencies are indicated by the genus Prorocentrum and Gymnodinium (Fr=59% and Fr=30%). For Diatoms, we recorded a relatively high value of the genus Coscinodiscus, chaetoceros and Thalassiosira, while the other genera of Diatoms and Dinoflagellates are marked by a rarity situation.
3.2.2 Variation of the phytoplankton cell density
Fig. 2 shows the distribution of total cell densities, explored in each region (East, Center and West) for both 2012 and 2013. We can see that low cell density was recorded in the wilaya of Mostaghanem in 2012; Ghazaouet, Tipaza and Skikda in 2013. While in the wilayas of Annaba, Jijel and Boumerdes, we have a high cell density.
Fig. 2 Distribution of total cell densities in each region (East, Center and West) in 2012 and 2013
The observations recorded in 2013 show a total cell density ranging from 740 cell L-1 (Ain-temouchent) to 18980 cell L-1 (Jijel) with alternation between the numerically dominant groups. By contrast, in 2012 the density ranges from a maximum of 6000 in Mostaghanem (Western region) to 18666 cell L-1 recorded, as in the previous year, in Jijel (eastern region). This division by region has enabled us to observe that the highest phytoplankton densities for the period 2012-2013 are recorded in the eastern region with 57.5% for 2012 and 61.07% for 2013 and the western region shows the lowest concentration in phytoplankton with a value not exceeding 25%.
3.2.3 Specific diversity index
3.2.3.1 Shannon “H”, simpson and equity “E
The diversity of our studied phytoplankton population is evaluated using the Shannon index “H” and equity index “E”. The calculations of the specific diversity index of the treated samples are illustrated in Fig. 3 and Fig. 4.
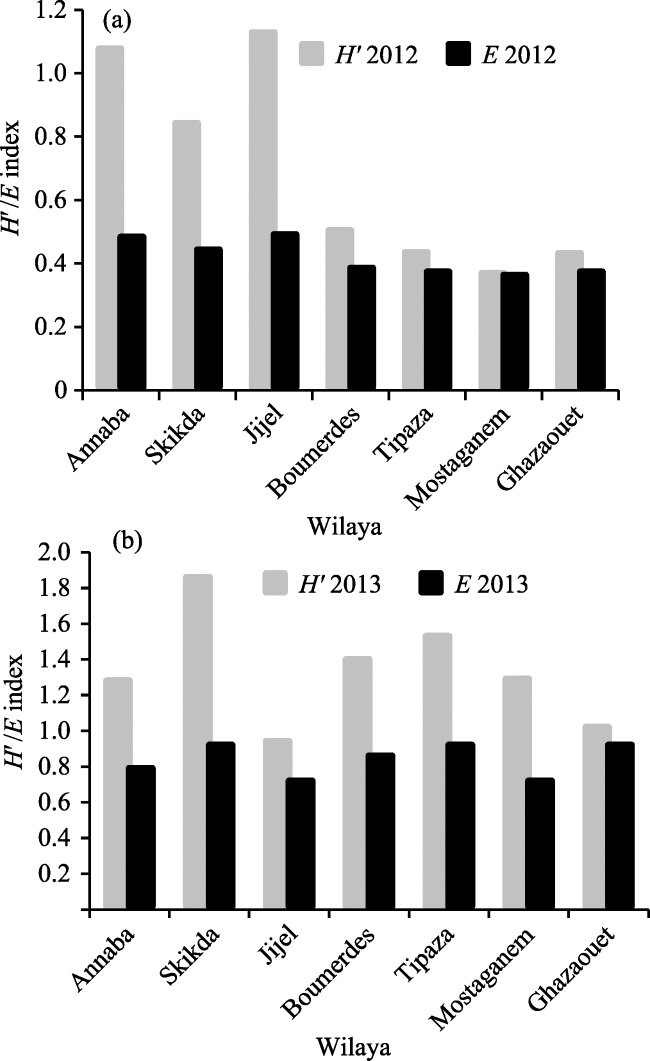
Fig. 3 Spatio-temporal evolution of the Shannon (H°) and Equitability (E) indexes
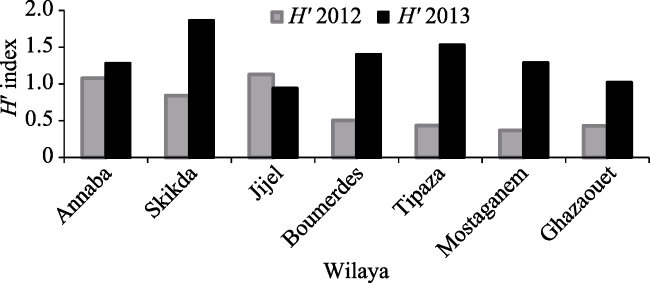
Fig. 4 Comparison of the spatial variation of the Shannon index (H°) for the year 2012 and 2013
In 2013: The computation of the Shannon index “H” for the treated samples show that values are between 0.94 and 1.86 Bits Ind-1. This can be considered as not close to the optimal value, which is 2.09 Bits Ind-1 (H°max = log2S). The wilayas of Skikda, Boumerdes and Tipaza are respectively the most diversified with maximum values of H'. On the other hand, the minimum value was reported for the wilaya of Jijel with 0.94 Bits Ind-1. The values of the equitability index for each wilaya varies between 0.72 and 0.92. The minimum (tend to 0) is related to the wilaya of Jijel.
In 2012: We may note that the specific diversity and Shannon index vary from one wilaya to another, the lowest value is in the province of Mostaghanem west of Algeria (0.36 Bits Ind-1), while the highest value linked to the East and specifically to the wilaya of Jijel is 1.12. Concerning the regularity index, all recorded values are lower than 0.5 and two wilayas (Annaba and Jijel) mark the maximum threshold index (0.48 and 0.49) and less regularity in phytoplankton population for the province of Mostghanem.
Comparison of the average values of Shannon index H' between 2012 and 2013 in each wilaya shows a reverse trend of the spatial variation (r = 0.23). Indeed, the maximum values recorded in 2012 for the wilayas of Skikda, Boumerdes, Tipaza, Mostaghanem and Ghazaouet correspond to the minimum values recorded in the same sites the following year (2013). This fact is not recorded only in two wilayas along the eastern region (Annaba and Jijel) or they mark similar values of Shannon index H° for the entire period 2012-2013.
3.2.3.2 Diagrams Rank-Frequency (RFD)
The rank-frequency diagram provides a synthetic representation of the structure of the phytoplankton community observed. Following logarithmic transformations of taxa ranks, in order to linearize the curve, observation of the graph makes it possible to distinguish the type of the community from the study area and estimate the ecological stage at this period 2012-2013 in reference to the diversity, abundance and equitability of the distribution.
In 2013: Generally, the rank frequency diagrams (Fig. 5) reveal no dominance of any phytoplanctonic groups based on frequency or abundance, but there are species which are often present but not dominant, and a right-skewed tail containing many rare groups. The RFD of the Eastern region in 2013 has a biphasic aspect typical of a stage I, characterized by the dominance of one species (Prorocentrum sp). This community is less diverse (0.94 to 1.86 Bits Ind-1) with an inequitable distribution related to an ecological status of an immature population also marked by numerous rare species of less abundance, and which holds the last rank (7thout of 10) (see the basic part of the diagram).
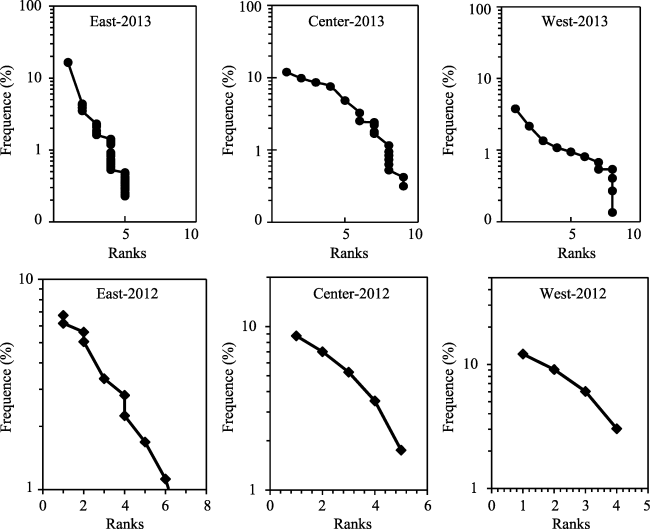
Fig. 5 Diagrams Rank-Frequency (RFD) in the study area (Stage I)
In 2012: The pace of the curve in the three regions is almost similar; the RFD curve becomes entirely convex, approaching the broken stick distribution especially in the two central and western regions (subrectilinear). This allure of the curve can be interpreted as a population with less diversity (does not exceed 1.5). One can see that diversity decreased compared to the previous stage of the year 2013. All abundant species contribute almost in the same way to the total abundance phytoplankton averaging 34 and 24%. These groups of species also occur very frequently (present in more than 50% of 60 samples) (Fig. 5) thus we do not observe for the three regions a sudden fall of the curve explained by rare species to the basic part of the RFD.
3.2.4 Spatial variation of Dia/Dino index
The Dia/Dino index requires only biomass data on diatoms and dinoflagellates, without input of species information, and is therefore fairly robust. Using the same strategy employed by Wasmund et al. (2016), variation of Dia/Dino index was determined from abundance data. These values are plotted as a line in Fig.2. Diatoms are the dominant class, mainly shown by the values of Dia/Dino index > 0.5. Even without statistical evaluation, a comparison of recent data reveals a clear trend. Diatoms dominance (Dia/Dino index > 0.5) occurred in the center and western areas of the Algerian coast in 2012 (Fig. 6). The average value calculated for this index was 0.4 for the center region and 0.54 for the western one. This is close to the reversal point of 0.5 between diatoms and dinoflagellates dominance. A year later, we see a slight increase in this index which confirms the decline in the rate of diatoms recorded in the total flora. The minimum value of this index is recorded in the eastern region confirming the dominance of the dinoflagellates especially in Skikda (0.31).
Fig. 6 Spatial variation of Dia/Dino index

4 Discussion

This study has shown remarkable quantitative phytoplankton richness with the diversity of two main groups (Diatoms and Dinoflagellates). The qualitative study of phytoplankton represented by the sample results collected by the CNRDPA during the period 2012-2013 by the “GRINE BELKACEM” research vessel along the Algerian coast indicates the presence of more than 125 species in 2012and 106 in 2013. Dinoflagellates and diatoms predominate in all stations (Fr>50%), so this work reveals the presence of other groups such as Cocolithophoridae and Euglenes but with a low percentage (Fr <10%).
In this work, as indicated above, abundance data were used for the exploration of spatial variation (data 2012- 2013). According to an assemblage of data between our results on the Algerian coast and the distribution of phytoplankton classes in the other sites of the Mediterranean basin reported by different authors, we notice a difference that can probably be explained either by the number of samples carried out in each study, or by the conditions of the marine environment (temperature, salinity…) which differs from one zone to another (East, West and Center). If we compare the results of our study period in the Algerian basin to those of other sites, we notice some fluctuations in phytoplankton diversity. For Coccolithophoridae, the distribution is poorly represented, but it should be noted that due to the calcareous nature of their coccoliths, these organisms do not withstand prolonged conservation in Lugol and often have a very advanced state of deterioration (Illul, 2014). Our results indicate the presence of species that may threaten marine life as well as human health. For dinoflagellates we mention the presence of the genera Gymnodinium; Alexandrium that can cause PSP from human consumption of toxins accumulated in marine bivalves.
Quantitatively, we observe a total cell density of phytoplankton decrease from east to west, and Diatoms mark a large abundance in most stations of the Algerian coast region except in the East indicated by the value of the index Diat/Dino, which are replaced by Dinoflagellates. This group of phytoplankton has exhibited a remarkable quantitative richness with the dominance of two main genera: Prorocentrum, Ceratium, Gymnodinium which was already reported by Gaumer (1981), in Algerian waters.
The cause of this poverty in these Bacillariales in some study zone can generally be attributed due to environmental factors which prevent primary production, and consequently affect the development of these organisms in this sampling period. Indeed, temperature and poverty in silica are factors which have a crucial influence on the fluctuation of dinoflagellates (Wasmund et al., 2017).
The seasonal decrease in phytoplankton biomass generally coincides with the decrease in temperature from east to west, which would explain the influence of this factor on productivity.
Recently, the diatom/dinoflagellate index (Dia/Dino index) was adopted as an indicator in the assessment of the ecological status of water Sea within the scope of the Marine Strategy Framework Directive (MSFD).Dia/Dino index reflects the dominance patterns in the phytoplankton composition (Abundance or Biomass) HELCOM (2016).
Disappearance of diatoms and their replacement by Dinoflagellates was discussed in several studies. (Wasmund et al., 1998, 2013 and 2016; Alheit, 2005). According to some authors, this decline in the Dia/Dino index indicates a worsening of environmental conditions. According to Lassus (1988), Dinoflagellates can develop with low concentrations of nutrient salts, usually necessary for the development of phytoplankton. For other authors, sampling strategy is another factor that may cause this fluctuation between Diatoms and Dinoflagellates when it is based on a very late sampling (June) such that the diatom bloom, which generally occurs earlier, was most likely missed.
Wasmund (1998 and 2013) noted that the magnitude of the Diatom bloom is controlled by the minimum winter temperature. This conclusion is supported by Klais et al. (2013). A succession from diatoms to dinoflagellates occurs in most areas of the Mediterranean Sea. The relative contributions of these competing organisms may vary from year to year and over many years, which may have consequences for the ecosystems functioning because diatoms and dinoflagellates differ in their nutritional value (Wasmund, 2017).
On the structural level, the results obtained by the Shannon and the equitability index show a phytopalnctonic diversity that was already reported by other authors. Low values in equitability index are linked to an unequal distribution in cell density of different taxa in some wilayas of the study area.
An unbalanced distribution of the phytoplankton structure has been reported to be at the origin of dinoflagellate dominance. Indeed (Wasmund, 2017), has reported that in the Baltic Sea relatively high Ceratium abundances was still found in February and March which were remnants of the preceding autumn bloom. This dinoflagellate disturbs the Dia/Dino index because it does not belong to the spring bloom. Finally, this work contributes to understanding the functioning of Algerian coastal ecosystems, the distribution of phytoplankton populations especially according to the spatial variation. Indeed, it will be more interesting as a prospect to continue this study according to the different seasons thus ensuring a follow-up of phytoplankton successions in time.

5 Conclusions

This work is a contribution to the understanding of the functioning of the Algerian coastal ecosystem. Indeed, the specific objective is to contribute to the exploration of the phytoplankton diversity and to the description of the diatom and dinoflagellates dynamics at the different regions of the Algerian coast. Data obtained on species diversity showed a balance of species richness between the two phytoplanktonic group’s diatoms and dinoflagellates at different stations. The spatial distribution of cell densities revealed a heterogeneous phytoplankton composition between booth target phytoplankton groups according to eastern, central and western region of the Algerian coast. In recent years, deterioration in the quality of water reported in several studies has a major negative impact on biodiversity and other aspects of ecological change. This study can give a rough idea of the aquaculture sites of interest that can contribute to the orientation of some aquaculture projects planned under the “AQUAPECHE 2025” program related to the fisheries and aquaculture sector Algerian. Indeed, it will be more interesting as a prospect to continue this study, according to the different seasons, thus ensuring better temporal monitoring of phytoplankton successions all along the Algerian coast.
[1]
AFNOR.2006. Guiding standard for phytoplankton counting by inverted microscopy (Utermohl method) -NF EN 15204, 10-12. (in Franch)

[2]
Alheit J, Möllmann C, Dutz J, et al.2005. Synchronous ecological regime shifts in the central Baltic and the North Sea in the late 1980s.ICES J. Marine Sci. 62, 1205-1215.

[3]
Frontier S.1983. Sampling of Specific Diversity. In: Frontier S (eds.). Sampling Strategies in Ecology, Paris: Masson-Presses of Laval University, 416-436. (in Franch)

[4]
Gailhard I.2003. Analysis of the Spatio-temporal Variability of Coastal Microalgal Populations Observed by the “Phytoplankton and Phycotoxin Monitoring Network”. Diss, University of Mediterranean. (in Franch)

[5]
Gaumer M.1981. Annual evolution of the micro-planktonic communities of Algiers Bay. Variation of the specific composition related to the nature of the nutritional factor limiting the algal biomass. Doctoral Thesis 3rd cycle, Univer. Pierre and Marie Curie, 91. (in Franch)

[6]
Guiselin N.2010. Characterization of Phytoplankton Events in Coastal Zone: Test of Alternative Techniques and Development of Water Quality Indicators. PhD Diss. University of the Littoral Opal Coast, France. (in Franch )

[7]
HELCOM.2016. Outcome of the Fifth Meeting of the Working Group on the State of the Environment and Nature Conservation (State & Conservation 5-2016). 50.

[8]
HELCOM.2014. Manual for Marine Monitoring in the COMBINE Programme of HELCOM.

[9]
Ignatiades L, Gotsis-Skretas O, Pagou K, et al.2009. Diversification of phytoplankton community structure and related parameters along a large-scale longitudinal east-west transect of the Mediterranean Sea,Journal of Plankton Research, 31: 411-428.

[10]
Klais R, Tamminen T, Kremp A, et al.2013. Spring phytoplankton communities shaped by inter annual weather variability and dispersal limitation: mechanisms of climate change effects on key coastal primary producers.Limnol. Oceanogr, 58: 753-762.

[11]
Lassus P, Paulmier G, Le Baut C.1988. Role of phytoplankton in disturbances of coastal and estuarine ecosystems.IFREMER, 5-14. (in Franch)

[12]
MADREP.2015. Aquapeche 2020 Master Plan—Sectoral Development of Ministry of Agriculture, Rural Development and Fisheries.

[13]
Margalef R.1961. Hydrography and phytoplankton of a marine area of the southern coast of Puerto Rico.Fishery Research, 18(1): 33-96. (in Spain)

[14]
Meave Del Castillo M E.2009. Dinoflagellates and diatoms of the Mexican tropical Pacific. Final information National Information System on Biodiversity of Mexico-National Commission for the Knowledge and Use of Biodiversity project DJ022 Project. Mexico, D.F., Mexico. (in Spain)

[15]
Meave-Del Castillo M E, Zamudio-Resendiz Y M, Castillo-Rivera C.2012. Phytoplankton richness of the Acapulco bay and coastal area, Guerrero, Mexico.Acta Botanica Mexicana, 100: 405-487. (in Spain)

[16]
Meunier A.1915. Microplankton of the Flemish Sea. Part 2. Diatomaceae (following the Chaetoceros genus excepted).Memories of the Royal Museum of Natural History of Belgium, 26(7): 8-14. (in Franch)

[17]
Schiller J.1933. Dinoflagellatae (peridineae) in Monographic Treatment. Part 1, Delivery 3. In: Kolkwitz, R., Tenth volume. Flagellatae. In Dr. L. Rabenhorst’s Cryptogam Flora from Germany, Austria and Switzerland. Leipzig, Academic publishing company, 433-617. (in German)

[18]
Schiller J.1937. Dinoflagellate (peridineae) in Monographic treatment. 2nd part, Delivery 4th In: Kolkwitz, R., tenth volume. (in German)

[19]
Smayda T J.1997. Harmful algal blooms: their ecophysiology and general relevance to phytoplankton blooms in the sea.Limnology & Oceanography, 42(5): 1137-1153.

[20]
Taylor E J R.1976. Dinoflagellates from the international Indian Ocean expedition. A report on material collected by the “Anton Bruun” 1963-64, 132, Stuttgart, 234.

[21]
Utermohl H.1958. To complete the quantitative phytoplankton methodology, Mitt Internat. Society.Theor Angew Limnol, 9(1): 1-38. (in German)

[22]
Wasmund N, Göbel J, Jaanus A, et al.2016. “Pre-core indicator ‘Diatom-Dinoflagellate index’ - proposal to shift status to core indicator” in Document to the Meeting of the HELCOM Working Group of the State of the Environment and Nature Conservation.

[23]
Wasmund N, Kownacka J, Göbel J, et al.2017. The Diatom/Dinoflagellate index as an indicator of ecosystem changes in the Baltic Sea. 1. Principle and handling instruction.Frontiers in Marine Science. 4:22. doi: 10.3389/ fmars.2017.00022

[24]
Wasmund N, Nausch G, Feistel R.2013. Silicate consumption: an indicator for long term trends in spring diatom development in the Baltic Sea.Journal of Plankton Research, 35: 393-406.

[25]
Wasmund N, Nausch G, Matthäus W.1998. Phytoplankton spring blooms in the southern Baltic Sea-spatio-temporal development and long-term trends.Journal of Plankton Research, 20: 1099-1117.

Outlines

/