
Journal of Resources and Ecology >
Analysis on Environmental Pollution in China’s Coastal Ecosystem
First author: DOU Qun, E-mail: dou.qun.ge@u.tsukuba.ac.jp
Received date: 2018-12-21
Accepted date: 2019-02-20
Online published: 2019-07-30
Copyright
In recent years, with the rapid development of China’s economy, the coastal environment is facing large pressure. However, the coastal environment pollution has not attracted much attention as air pollution and land water pollution. Based on the data on economic development and marine ecosystem environmental pollution which collected from the National Bureau of Statistics and China’s coastal marine environmental monitoring, the paper analyzes the overall coastal ecosystem environment pollution in China as well as the four sea areas the Bohai Sea, the Yellow Sea, the East China Sea and South China Sea. The paper finds that the coastal marine environment pollution differ in different sea areas, taking the seawater quality, over-standard pollutants, water quality of rivers entering seas and coastal marine environmental disasters, such as red tide as index. Couple of policy suggestions provided based on research findings.
Key words: coastal ecosystem; environmental pollution; China
DOU Qun , ZHANG Zhenya . Analysis on Environmental Pollution in China’s Coastal Ecosystem[J]. Journal of Resources and Ecology, 2019 , 10(4) : 424 -431 . DOI: 10.5814/j.issn.1674-764X.2019.04.009
Table 1 Proportion of GDP of coastal provinces in China during 1997-2016 (unit: %) |
| Year | Tianjin | Hebei | Liaoning | Shanghai | Jiangsu | Zhejiang | Fujian | Shandong | Guangdong | Guangxi | Hainan | Total |
|---|---|---|---|---|---|---|---|---|---|---|---|---|
| 1997 | 1.65 | 5.17 | 4.68 | 4.50 | 8.73 | 6.13 | 3.75 | 8.55 | 10.16 | 2.38 | 0.54 | 56.2 |
| 1998 | 1.66 | 5.14 | 4.69 | 4.60 | 8.70 | 6.11 | 3.82 | 8.49 | 10.31 | 2.31 | 0.53 | 56.4 |
| 1999 | 1.70 | 5.11 | 4.72 | 4.74 | 8.71 | 6.16 | 3.86 | 8.48 | 10.47 | 2.23 | 0.54 | 56.7 |
| 2000 | 1.72 | 5.11 | 4.73 | 4.83 | 8.67 | 6.22 | 3.81 | 8.45 | 10.88 | 2.11 | 0.53 | 57.1 |
| 2001 | 1.76 | 5.07 | 4.63 | 4.79 | 8.69 | 6.34 | 3.74 | 8.45 | 11.07 | 2.10 | 0.53 | 57.2 |
| 2002 | 1.78 | 4.98 | 4.52 | 4.75 | 8.78 | 6.62 | 3.70 | 8.50 | 11.18 | 2.09 | 0.53 | 57.4 |
| 2003 | 1.85 | 4.96 | 4.30 | 4.80 | 8.92 | 6.96 | 3.57 | 8.66 | 11.36 | 2.02 | 0.51 | 57.9 |
| 2004 | 1.85 | 5.05 | 3.97 | 4.81 | 8.93 | 6.94 | 3.43 | 8.95 | 11.23 | 2.04 | 0.49 | 57.7 |
| 2005 | 1.96 | 5.03 | 4.04 | 4.64 | 9.34 | 6.73 | 3.29 | 9.22 | 11.32 | 2.00 | 0.46 | 58.0 |
| 2006 | 1.92 | 4.93 | 4.00 | 4.54 | 9.34 | 6.75 | 3.26 | 9.41 | 11.42 | 2.04 | 0.46 | 58.0 |
| 2007 | 1.88 | 4.86 | 3.99 | 4.47 | 9.30 | 6.70 | 3.31 | 9.21 | 11.36 | 2.08 | 0.45 | 57.6 |
| 2008 | 2.02 | 4.80 | 4.10 | 4.22 | 9.30 | 6.44 | 3.25 | 9.28 | 11.04 | 2.11 | 0.45 | 57.0 |
| 2009 | 2.06 | 4.72 | 4.16 | 4.12 | 9.43 | 6.29 | 3.35 | 9.28 | 10.81 | 2.12 | 0.45 | 56.8 |
| 2010 | 2.11 | 4.67 | 4.22 | 3.93 | 9.48 | 6.34 | 3.37 | 8.96 | 10.53 | 2.19 | 0.47 | 56.3 |
| 2011 | 2.17 | 4.70 | 4.26 | 3.68 | 9.42 | 6.20 | 3.37 | 8.70 | 10.20 | 2.25 | 0.48 | 55.4 |
| 2012 | 2.24 | 4.61 | 4.31 | 3.50 | 9.38 | 6.01 | 3.42 | 8.67 | 9.90 | 2.26 | 0.50 | 54.8 |
| 2013 | 2.28 | 4.48 | 4.29 | 3.44 | 9.42 | 5.95 | 3.45 | 8.71 | 9.85 | 2.28 | 0.50 | 54.6 |
| 2014 | 2.30 | 4.30 | 4.18 | 3.44 | 9.51 | 5.87 | 3.52 | 8.68 | 9.91 | 2.29 | 0.51 | 54.5 |
| 2015 | 2.29 | 4.12 | 3.97 | 3.48 | 9.70 | 5.93 | 3.59 | 8.72 | 10.07 | 2.32 | 0.51 | 54.7 |
| 2016 | 2.29 | 4.11 | 2.85 | 3.61 | 9.92 | 6.06 | 3.69 | 8.72 | 10.37 | 2.35 | 0.52 | 54.5 |
| 2017 | 2.24 | 4.11 | 2.83 | 3.70 | 10.38 | 6.26 | 3.89 | 8.78 | 10.85 | 2.24 | 0.54 | 55.8 |
Data Source: China Statistical Yearbook, 1997-2018. This study does not include Hong Kong, Macao and Taiwan. |
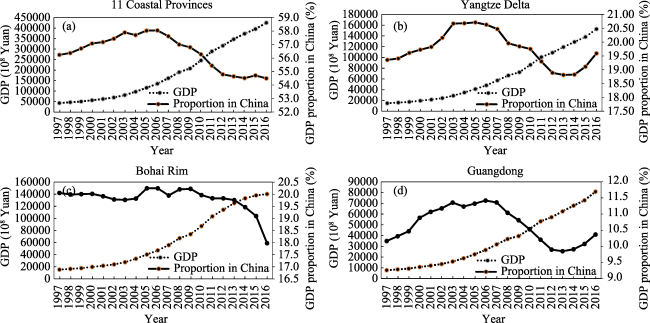
Fig. 1 GDP of coastal provinces and three economic zones in China |
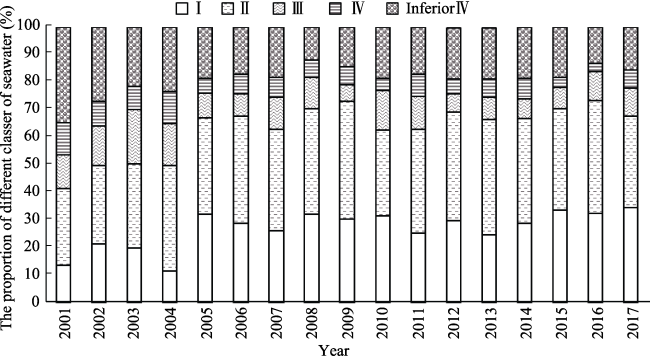
Fig. 2 Sea Water quality in China’s coastal area during 2001-2017 |
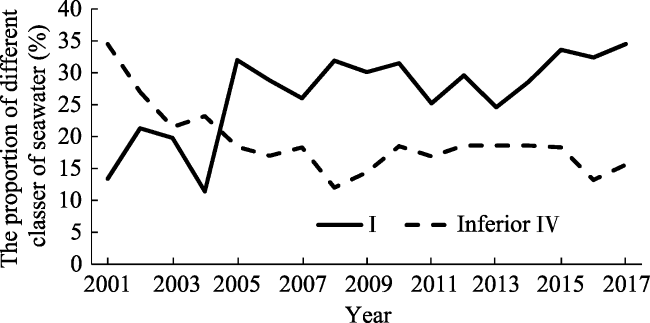
Fig. 3 Trends of China coastal seawater quality, class I vs. class inferior IV, 2001-2017 |
Table 2 Seawater quality of four sea areas in China, 2016 and 2017 |
| MonitorPoints | Class I (%) | Class II (%) | Class III (%) | Class IV (%) | Below Class IV (%) | ||||||
|---|---|---|---|---|---|---|---|---|---|---|---|
| 2016 | 2017 | 2016 | 2017 | 2016 | 2017 | 2016 | 2017 | 2016 | 2017 | ||
| Bohai | 81 | 28.4 | 19.8 | 44.4 | 48.1 | 17.3 | 14.8 | 4.9 | 7.4 | 4.9 | 9.9 |
| Yellow Sea | 91 | 38.5 | 37.4 | 50.5 | 45.1 | 4.4 | 9.9 | 5.5 | 5.5 | 1.1 | 2.2 |
| East China Sea | 113 | 12.4 | 15.9 | 31.9 | 31.0 | 15.0 | 12.4 | 3.5 | 9.7 | 37.2 | 31.0 |
| South China Sea | 132 | 47.7 | 57.6 | 40.2 | 18.2 | 6.1 | 5.3 | 0 | 3.8 | 6.1 | 15.2 |
Source: China’s Coastal Marine Environmental Monitoring, 2016-2017 (CMEEP) |
Table 3 Major over-standard pollutants detected ratio in China coastal waters, 2001-2017 (unit: %) |
| Year | Inorganic nitrogen | Activephosphate | COD | Petroleum | Lead | Copper | Mercury | Cadmium |
|---|---|---|---|---|---|---|---|---|
| 2001 | 67.9 | 59.9 | 1.9 | 18.0 | 62.9 | 25.9 | 6.6 | 2.0 |
| 2002 | 49.0 | 49.2 | 16.1 | 12.9 | 48.6 | 22.2 | 7.9 | 2.5 |
| 2003 | 37.5 | 23.6 | 4.2 | 16.0 | 3.4 | 5.1 | 0.8 | 0.0 |
| 2004 | 34.8 | 23.5 | 2.4 | 9.9 | 6.4 | 8.0 | 3.4 | 0.0 |
| 2005 | 30.5 | 20.3 | 1.8 | 4.9 | 2.5 | 0.7 | 0.0 | 0.1 |
| 2006 | 31.4 | 14.4 | 2.9 | 2.9 | 2.2 | 0.8 | 0.2 | 0.1 |
| 2007 | 34.1 | 13.4 | 2.1 | 3.0 | 4.0 | 1.4 | 0.0 | 0.0 |
| 2008 | 27.5 | 10.4 | 1.1 | 1.0 | 1.8 | 0.7 | 0.0 | 0.2 |
| 2009 | 28.3 | 14.7 | 1.0 | 1.5 | 2.0 | 0.8 | 0.3 | 0.4 |
| 2010 | 35.0 | 15.0 | 1.3 | 2.9 | 1.2 | 0.4 | 0.5 | 0.5 |
| 2011 | 29.6 | 11.0 | 1.7 | 4.3 | 5.3 | 1.3 | - | 1.0 |
| 2012 | 28.6 | 15.9 | 0.3 | 2.3 | 0.3 | - | - | |
| 2013 | 28.6 | 15.6 | 4.3 | 2.0 | 1.0 | - | - | 0.3 |
| 2014 | 31.2 | 14.6 | 1.0 | 1.7 | - | - | - | - |
| 2015 | 29.2 | 14.6 | 1.0 | - | 0.3 | - | - | - |
| 2016 | 23.3 | 10.1 | 0.7 | 2.2 | 0.5 | 0.5 | - | - |
| 2017 | 30.2 | 7.0 | 0.7 | 1.4 | - | 0.7 | - | - |
Source:The Coastal Marine Environmental Monitoring of China, 2001-2017 (CMEEP). |
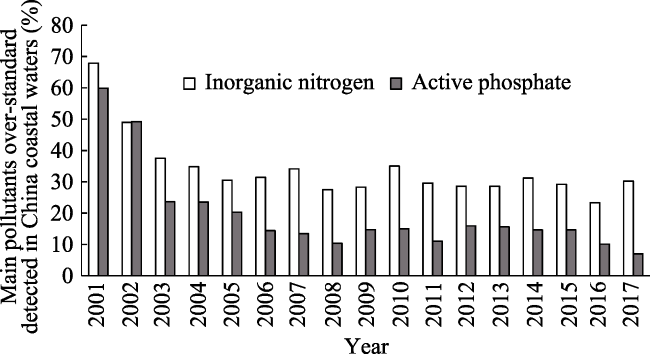
Fig. 4 Main pollutants over-standard detected in China coastal waters (%) during 2001-2017 |
Table 4 Water quality of monitored rivers into the sea, 2011-2017 (unit: %) |
| Year | Class I | Class II | Class III | Class IV | Class V | Inferior Class V |
|---|---|---|---|---|---|---|
| 2011 | 0.5 | 11.9 | 32.5 | 20.1 | 7.7 | 27.3 |
| 2012 | 0.0 | 13.4 | 33.3 | 20.9 | 8.0 | 24.4 |
| 2013 | 0.0 | 12.5 | 34.0 | 24.0 | 11.0 | 18.5 |
| 2014 | 0.0 | 15.1 | 27.3 | 26.3 | 13.1 | 18.2 |
| 2015 | 0.0 | 11.3 | 30.2 | 22.6 | 14.1 | 21.5 |
| 2016 | 0.0 | 13.5 | 33.3 | 25.5 | 10.4 | 17.2 |
| 2017 | 0.0 | 13.8 | 33.8 | 24.6 | 6.7 | 21.0 |
Source: The Coastal Marine Environmental Monitoring of China, 2011- 2017 CMEEP. |
Table 5 Ratio of rivers into the four sea areas of China in different water quality (2016) (unit: %) |
| Area | Class I | Class II | Class III | Class IV | Class V | Inferior Class V |
|---|---|---|---|---|---|---|
| Bohai | 0.0 | 4.3 | 8.7 | 34.8 | 17.4 | 34.8 |
| Yellow Sea | 0.0 | 5.9 | 31.4 | 31.4 | 15.7 | 15.7 |
| East China Sea | 0.0 | 12.0 | 56.0 | 24.0 | 8.0 | 0.0 |
| South China Sea | 0.0 | 25.7 | 42.9 | 15.7 | 2.9 | 12.9 |
| National average | 0.0 | 13.5 | 33.3 | 25.5 | 10.4 | 17.2 |
Source: The Coastal Marine Environmental Monitoring of China, 2016 (CMEEP). |
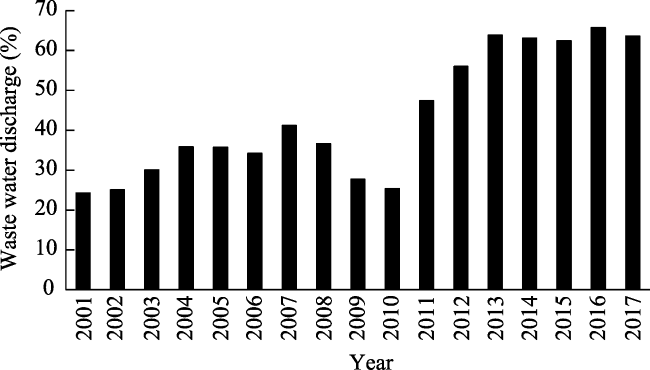
Fig. 5 Waste water from sources directly discharged into the sea of China during 2001-2017 |
Table 6 Number of Red tide happened in China's coastal waters, 2001-2010 |
| Year | Bohai | Yellow Sea | East China Sea | South China Sea |
|---|---|---|---|---|
| 2001 | 20 | 8 | 34 | 15 |
| 2002 | 3 | 14 | 51 | 11 |
| 2003 | 5 | 12 | 86 | 16 |
| 2004 | 12 | 13 | 53 | 18 |
| 2005 | 9 | 13 | 51 | 9 |
| 2006 | 11 | 2 | 63 | 17 |
| 2007 | 7 | 5 | 60 | 10 |
| 2008 | 1 | 12 | 47 | 8 |
| 2009 | 4 | 13 | 43 | 8 |
| 2010 | 7 | 9 | 39 | 14 |
Data Source: The coastal water quality environmental bulletin of China 2001- 2010. |
Table 7 Red tide in four sea areas of China, 2017 |
| Area | Number of occurrences | Cumulative area (km2) |
|---|---|---|
| Bohai | 12 | 342 |
| Yellow Sea | 3 | 100 |
| East China Sea | 40 | 2189 |
| South China Sea | 13 | 1048 |
Data Source: The coastal water quality environmental bulletin of China 2017. |
| [1] |
|
| [2] |
|
| [3] |
|
| [4] |
China National Oceanic Administration (CNOA). 1990-2017, China Marine Environment Bulletin.
|
| [5] |
|
| [6] |
|
| [7] |
|
| [8] |
|
| [9] |
|
| [10] |
|
| [11] |
|
| [12] |
|
| [13] |
|
| [14] |
|
| [15] |
|
| [16] |
Ministry of Environmental Protection of China. 1997.Sea Water Quality Standard, GB 3097-1997. in Chinese)
|
| [17] |
Ministry of Environmental Protection of China. 2011. China Coastal Marine Environment Bulletin 2011 . (in Chinese)
|
| [18] |
National Statistics Bureau of China. 2017. China Statistical Yearbook. Beijing: China Statistics Press, 1-64. (in Chinese)
|
| [19] |
OECD. 2010. OECD environmental performance reviews: Japan 2010, OECD Publishing, Paris.
|
| [20] |
|
| [21] |
|
| [22] |
|
| [23] |
UN.1982. Convention on the Law of the Sea. https: //treaties.un.org/ doc/Treaties/1994/11/19941116%2005-26%20AM/Ch_XXI_06p.pdf
|
| [24] |
UN.2017. The 19th Global Meeting of the Regional Seas Conventions and Action Plans, November 29 2017, the Regional Seas annual meeting, Cape Town, South Africa. The 19th Global Meeting of the Regional Seas Conventions and Action Plans, November 29 2017, the Regional Seas annual meeting, Cape Town, South Africa.
|
| [25] |
|
| [26] |
|
| [27] |
|
| [28] |
|
| [29] |
|
/
| 〈 |
|
〉 |