Water and Soil Resources

Analysis on the Spatio-temporal Patterns of Water Conservation Services in Beijing

  • XU Jie , 1, 2, 3 ,
  • XIAO Yu , 1, 2, * ,
  • XIE Gaodi 1, 2
Expand
  • 1. Institute of Geographic Sciences and Natural Resources Research, Chinese Academy of Sciences, Beijing 100101, China
  • 2. University of Chinese Academy of Sciences, Beijing 100049, China
  • 3. School of Conservation, Beijing Forestry University, Beijing 100083, China
*Corresponding author: XIAO Yu, E-mail:

First author: XU Jie, E-mail:

Received date: 2018-11-29

  Accepted date: 2019-01-30

  Online published: 2019-07-30

Supported by

National Key Research and Development Program of China (2016YFC0503403, 2016YFC0503706)

Strategic Priority Research Program of Chinese Academy of Sciences (XDA20020402)

National Natural Science Foundation of China (31400411).

Copyright

All rights reserved

Abstract

The shortage of water resources is a key factor limiting the sustainable development of the economy and society in Beijing. This study analysed the spatiotemporal patterns of Beijing’s water conservation services (WCS) based on the water balance equation at multiple scales, including city, main functional areas and key districts and counties, determined the differences in the water conservation amount among different land cover types and investigated the reasons for the spatiotemporal differences in the water conservation amount. The results indicated that: (1) compared to 2005, water conservation amount increased substantially in 2010. However, the overall water conservation capacity was low. (2) Among the various land cover types in Beijing, the average water conservation capacity decreased in the following order: wetland, forest, grassland, cropland, bare land and artificial surface. (3) The average water conservation amount in the main functional areas of Beijing varied substantially and was positive only in the ecological conservation area (ECA). (4) The water conservation capacity of each district and county varied substantially within ECA, among which the contribution of the forest in Miyun District, Huairou District and Pinggu District was the highest. The changes in the spatiotemporal patterns of Beijing’s WCS were the synthetic effects of changes in the land covers and meteorological conditions. This study is helpful in achieving the sustainable utilization of water resources in Beijing.

Cite this article

XU Jie , XIAO Yu , XIE Gaodi . Analysis on the Spatio-temporal Patterns of Water Conservation Services in Beijing[J]. Journal of Resources and Ecology, 2019 , 10(4) : 362 -372 . DOI: 10.5814/j.issn.1674-764X.2019.04.003

1 Introduction

With the increasing demand for global water resources and the rapid deterioration of water environments, water shortage has become a global issue (Green et al., 2015) as well as a key factor limiting the socioeconomic development especially for the megapolises (Cui et al., 2012; Sun et al., 2017). Beijing faces most of the water problems of other megapolises (Wei, 2005), including river pollution (Zhang et al., 2011a), over-exploitation of groundwater (Sun, 2019) and water scarcity (Gao et al., 2014). The water supply and demand balance in Beijing depends on the water input from other areas (Chang et al., 2012; Zhang et al., 2012; Wang et al., 2015; Wang et al., 2016). Since 1999, Beijing has experienced 13consecutive years of drought with annual precipitation below 500 mm, suggesting it has entered a dry period (Liao et al., 2013). The changes in natural factors, such as the decrease of runoff generation due to changes in the spatiotemporal distribution of precipitation and watershed underlying surface, intensify the water shortage (Xu et al., 2017). Additionally, with the acceleration in population growth, economic development and urbanization processes, the increase in the upstream water usage leads to reduced input into Beijing (Zhang et al., 2012; Li et al., 2017; Song et al., 2018). Nevertheless, the water demand in Beijing will increase continuously (Cheng et al., 2013). Based on the above two reasons, the average per capita water resources in Beijing decreased to 95.1 m3 in 2014, which was less than 1/21 of the national per capita water resources of 1998.6 m3 and 1/80 of the worldwide per capita water resources, making it an area of severe water shortage (Wei et al., 2018). Water conservation services (WCS) are closely related to water resources and play a critical role in the regional hydrological cycle and water balance and they are an important topic in ecosystem services research (Sun et al., 2018). Therefore, the study of the spatiotemporal patterns of Beijing’s WCS is helpful in achieving the sustainable utilization of water resources in Beijing.
Currently, the study of the WCS in Beijing mainly focused on the water conservation function of the mountainous forest ecosystems and excluded the spatiotemporal differences in the WCS across the entire city of Beijing (Zhang et al., 2011b; Mo et al., 2011; Yu et al., 2012; Liu et al., 2017). Therefore, it lacked the overall perspective of the importance of the WCS in the key areas in Beijing. In addition to the forest ecosystems, grasslands and wetlands also show strong water conservation capacities. How to accurately access the spatiotemporal patterns of the large-scale water conservation amount is a difficult challenge in studying the function of water conservation. The Beijing Municipal Major Functional Zoning Plan was developed and issued in July 2012 and its planning period was from 2010 to 2020, which divided Beijing into the capital function core area (CFCA), urban function development area (UFDA), urban development new area (UDNA) and ecological conservation area (ECA). The ECA is not only an important area for protecting the ecological security of Beijing, but it is also a key water conservation district of Beijing. The analysis of and solution to issues such as the difference between the ECA and other functional areas in terms of WCS and the overall water conservation amount of Beijing are the foundations for the future water resource management and protection policy development. To eliminate the influence of major functional zoning plan and get more objective evaluation on the WCS in ECA and its original difference with other functional areas. We need to clarify the background condition of WCS in ECA before the implementation of zoning plan first, namely, the average state of the regional ecosystem before the ecological protection and restoration policy. This average state is more referential to evaluate the scientificity of functional zoning and can lay an objective and reliable foundation for an effect assessment of the planning. Therefore, we analyzed the spatiotemporal patterns of Beijing’s WCS in 2005 and 2010, which was before the implementation of the zoning plan.
The understanding of WCS varies with scholars. Currently, most comprehensive research concerns the water conservation function of forest ecosystem, which involves the function of effective water conservation and runoff adjustment through the interception and redistribution of precipitation by forest canopies, litter layers and soil layers (Li et al., 2001). The WCS can be evaluated by numerous methods, such as the soil water storage capacity method, water balance method, underground runoff increase method, precipitation storage method and forest canopy interception residual method (Zhang et al., 2009). A large number of studies have proven that the regional water balance method is the basis for studying water conservation mechanisms. The method can accurately calculate the water conservation capacity, which is easy to perform and is applicable for all temporal and spatial scales (Lü et al., 2015). It is currently the most effective and widely used method for calculating the water conservation amount (Sun et al., 1995). Therefore, this study used the water balance equation to calculate the water conservation amount, including water content in soil, litter layer water holding capacity and canopy interception. It analysed the spatiotemporal patterns of the WCS in Beijing at various scales (including city, the main functional areas, key districts and counties), determined the difference in water conservation among different land cover types, investigated the reasons for the spatiotemporal differences in WCS, identified the high-value areas of WCS, aiming to promote the scientific management and planning of Beijing’s water resources.

2 Materials and methods

2.1 Study area

Beijing is located at the northwestern section of the North China Plain (39°28ʹ-41°05ʹN, 115°25ʹ-117°30ʹE) (Fig. 1), with a total area of 16 410.5 km2, of which 62% is mountainous area (Zhang et al., 2010). The climate of Beijing is a temperate semi-wet monsoonal continental climate, with a multi-annual mean temperature of 12.0 ℃ and multi-annual mean precipitation of 640 mm (He et al., 2016). The topography in Beijing is high in the northwest and low in the southeast, with the southeastern plain surrounded by mountains on three sides. The Beijing Municipal Major Functional Zoning Plan divides Beijing into CFCA, UFDA, UDNA and ECA (Fig. 1). The CFCA, including the Dongcheng District and Xicheng District, had a population of 2.162 million and an area of 92.4 km2 in 2010. The UFDA, including the Chaoyang District, Haidian District, Fengtai District and Shijingshan District, had a population of 9.554 million and an area of 1275.9 km2 in 2010. The UDNA, including the Tongzhou District, Shunyi District, Daxing District (Beijing Economy and Technology Development District) and the plain areas of Changping District and Fangshan District, had a population of 5.418 million and an area of 3782.9 km2 in 2010. The ECA included the Mentougou District, Pinggu District, Huairou District, Miyun District, Yanqing District and the mountainous areas of Changping District and Fangshan District, with a population of 2.478 million and an area of 11259.3 km2 in 2010. The ratio of the four functional areas (CFCA, UFDA, UDNA and ECA) was 23:47:26:4 for gross domestic product (GDP), 11:49:27:13 for resident population and 0.6:7.8:23.0:68.6 for land area in 2010, respectively.
Fig. 1 The location and functional zoning of Beijing
The ECA is mainly located at the mountainous area. The land cover types have changed over time. Based on the average for 2005 and 2010, the forest area in Beijing was 8632.57 km2, of which 94.4% was within the ECA and most of which was deciduous wide leaf forest and deciduous wide leaf shrubs. The grassland of ECA accounted for 80.9% of the total grassland area (692.94 km2), which was mainly thick grass. The wetland area was 259.35 km2, of which 64.7% was located within the ECA. The cropland area was 2255.85 km2, of which 54.7% was located in the UDNA and 39.6% was located in the ECA (mainly dry land). The artificial surface area was 2470.43 km2, of which 41.0% was located in the UDNA and 31.15% was located in the UFDA (mainly residency area). Although the artificial surface in the CFCA only accounted for 3.43% of the total artificial surface in Beijing, it accounted for 91.63% of the CFCA. Other land cover types, including sparse grassland, bare rock and bare soil with an area of 68.47 km2, were mainly located in the ECA (61.4%) and UDNA (35.8%).

2.2 Data

Data about land cover, meteorology, soil, digital elevation, society and economy were needed. Land cover data (2005,2010) (spatial resolution 1 km) were derived from NationalEcosystem Survey and Assessment of China (2000-2010). Meteorological data were obtained from China Meteorological Data Sharing Service System (http://data.cma.cn/). To avoid the poor representativeness of data from a single year, daily meteorological data (including precipitation, wind speed, sunshine duration, average air pressure, monthly average temperature, daily maximum temperature, daily minimum temperature and average vapor pressure) of 28 meteorological stations in Beijing-Tianjin-Hebei Region for the periods of 2000-2007 and 2008-2015 were acquired. The digital elevation model (DEM) (spatial resolution 90 m) was obtained from the Data Center for Resources and Environmental Sciences of Chinese Academy of Sciences (http:// www.resdc.cn/). For the data of precipitation, potential evapotranspiration and actual evapotranspiration, a multi- year average was required first before obtaining the related spatial grid data (spatial resolution 90 m) for two stages by relying on Kriging spatial interpolation in ArcGIS 10 to calculate the water conservation amount.

2.3 Calculation of water conservation amount

This study used the following water balance equation to calculate the water conservation capacity, which was closely related to factors that include precipitation, evapotranspiration, surface runoff and land cover type:
$TQ=\underset{i=1}{\overset{j}{\mathop \sum }}\,({{P}_{i}}-{{R}_{i}}-E{{T}_{i}})\times {{A}_{i}}$(1)
where TQ is the total amount of water conservation (m3), Pi denotes precipitation on pixel i (mm), Ri represents surface runoff on pixel i (mm), ETi is evapotranspiration on pixel i (mm), Ai is the area of pixel i, j is the total number of pixels.
The surface runoff (Ri) is the product of precipitation and surface runoff coefficient, the formula is as follows:
${{R}_{i}}={{P}_{i}}\times {{\alpha }_{i}}$(2)
where αi is the average surface runoff coefficient on pixel i (%). Based on the regional conditions of Beijing in combination with data from the literature, we obtained the average runoff coefficient for various land covers in Beijing (Table 1).
Table 1 Surface runoff coefficient of different land cover types in Beijing
Land cover types Surface runoff coefficient (%) Location Source
Forests
Deciduous broadleaf forest 1.31 Yanqing Ye, 2007; Huang, 2012
Evergreen/ Deciduous needleleaf forest 0.93 Mentougou Huang, 2012; Lü, 2013
Mixed forests 1.64 Mentougou Lü, 2013
Evergreen/ Deciduous broadleaf shrub 4.02 Mentougou Lü, 2013
Arbor plantation/Arbor greenbelt 9.14 Huairou Wang, 2011
Grassland 9.57 Huairou Wang, 2011
Wetland 0 - Xu et al., 2018
Cropland
Paddy field 0 - Xu et al., 2018
Dryland cropland 22.95 Huairou Wang, 2011
Artificial surface 65.00 urban area of Beijing Wang et al., 2011
Others 32.88 Huairou Wang, 2011

Note: “-”means no data

Actual evapotranspiration (ETi) was calculated using the Technical Guidelines for the Redline Delimitation of the Ecological Protection:
$E{{T}_{i}}=\frac{{{P}_{i}}(1+{{\omega }_{i}}\times E{{T}_{0i}}/{{P}_{i}})}{1+{{\omega }_{i}}\times E{{T}_{0i}}/{{P}_{i}}+{{P}_{i}}/E{{T}_{0i}}}$(3)
where ET0i is multi-annual mean latent evapotranspiration on pixel i, and ωi is the underlying surface (land cover) impact coefficient from the Technical Guidelines for the Redline Delimitation of the Ecological Protection (Table 2) on pixel i.
Table 2 Reference value of water conservation function importance coefficient ω
Land cover types Cropland Forest Shrub Grassland Artificial surface Others
ω 0.5 1.5 1 0.5 0.1 0.1
The latent evapotranspiration was calibrated with the FAO56 Penman-Monteith formula (Allen, 1998) based on daily meteorological data of each weather station:
$E{{T}_{0}}=\frac{0.408\Delta \times ({{R}_{n}}-G)+\frac{900}{T+273}\times {{U}_{2}}\times ({{e}_{s}}-{{e}_{a}})}{\Delta +\gamma \times (1+0.34{{U}_{2}})}$ (4)
where Rn is surface net radiation (MJ m-2 d-1) from the crops, G is the soil heat flux density (MJ m-2 d-1), T is monthly mean temperature (℃), U2 is 2-m wind velocity(m s-1), es is saturated water vapour pressure (kPa), ea is the actual water vapour pressure (kPa), ${\Delta}$ is the slope of the saturated water vapour-temperature curve (kPa ℃-1) and ${\gamma}$; is the psychrometric constant (kPa ℃-1).

3 Results

3.1 The spatiotemporal patterns of Beijing’s water conservation services

In 2005, the average water conservation amount was -8.96 mm in Beijing and the actual evapotranspiration and surface runoff were generally higher than precipitation. Compared to 2005, water conservation amount in Beijing in 2010 showed an overall increasing trend, with an average of 12.21 mm and a total amount of 2.00×10⁸ m3. Precipitation, actual evapotranspiration and runoff are the three key factors determining the WCS when considering the water balance. Precipitation is an important variable of climate change, and the actual evapotranspiration and runoff are affected by both climate (solar radiation, temperature, humidity, wind speed) and land cover. Precipitation, actual evapotranspiration and runoff in 2010 in Beijing all increased relative to 2005. The annual mean precipitation in 2010 was 109.33 mm, more than that in 2005. The average actual evapotranspiration increased 65.40 mm in 2010 and the average runoff increased from 75.28 mm in 2005 to 98.04 mm in 2010.
Among the previous studies on the water conservation amount in Beijing, Zhang (2012) calculated that the annual mean evapotranspiration was 494 mm, and river runoff was 46 mm and precipitation was 485.4 mm in Beijing between 2001 and 2009 based on the precipitation-runoff-evapotranspiration equilibrium model. Because the river runoff was more than the average runoff, the annual mean water conservation amount of Beijing between 2001 and 2009 was approximately -54.6 - -8.6 mm for each soil cover type based on the water balance equation. Zhou (2015) determined that the average water conservation amount for Beijing in 2003-2012 was less than 6 mm based on the water balance method, with an average evapotranspiration of 517 mm and an average precipitation of 523 mm. Li et al. (2017) calculated the Beijing-Tianjin-Hebei water production in 2000, 2005 and 2010 based on the InVEST model, indicating that the water production in 2010 in Beijing was higher than that in 2005. The above water conservation estimations from the literature are comparable to those calculated in this study.
The spatial patterns of the WCS in Beijing in 2005 and 2010 were similar (Fig. 3), which increased from the central city to its vicinities. The northern and western areas were the high-value zones of Beijing’s WCS, which belonged to the ECA of the Beijing Municipal Major Functional Zoning Plan. Within the ECA, the water conservation amount was the highest in the northeastern Miyun Reservoir and its sur-ounding area, with an average of 170-243.91 mm. With dense urban construction land use, the central city was a negative area of water conservation amount, indicating that this area generally did not have water conservation capacity. In addition, the demand for WCS was becoming increasingly urgent due to population growth and socioeconomic development. According to the water balance equation, the water conservation amount is positively correlated with precipitation and negatively correlated with the actual evapotranspiration and surface runoff (Xu et al., 2016). Therefore, the spatial distribution pattern of the water conservation is closely linked to the spatial difference for each meteorological factor. The spatial distribution of precipitation interpolation showed that precipitation was high in the northeastern area and low in the southwestern and northwestern areas of Beijing (Fig. 4). The latent evapotranspiration and actual transpiration both decreased gradually from the northeast to the southwest. The surface runoff decreased from the centre of the city to its vicinities mainly because the urban construction land was mostly impermeable surface without conservation capacity (Yao et al., 2018).
Fig. 2 Variation of precipitation, evapotranspiration, runoff and water conservation amount in Beijing
Note: P-Average Precipitation; AET-Average Actual Evapotranspiration; R-Average Surface Runoff; WCON- Average Water Conservation Amount.
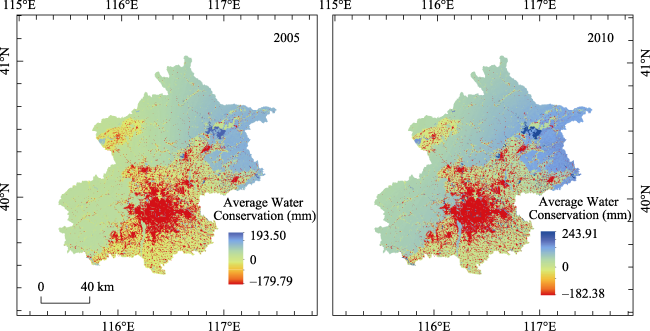
Fig. 3 Spatio-temporal distribution of the average water conservation of Beijing in 2005 and 2010
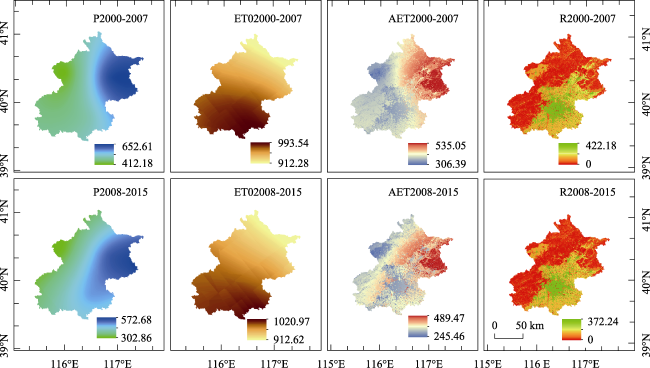
Fig. 4 The spatio-temporal distribution of meteorological elements of Beijing in 2000-2007 and 2008-2015 (mm)
Note: P-Average Precipitation; ET0-Average Evapotranspiration; AET-Average Actual Evapotranspiration; R-Average Surface Runoff.
Therefore, the precipitation infiltration was limited, and the runoff due to the large runoff coefficient was substantially higher than the surrounding area that was covered by vegetation. Compared to 2005, the water conservation amount in 2010 in Beijing increased to some degree citywide. The increase in the average water conservation amount in the northeastern area of the city was large, with an average increase of 23-50 mm. In contrast, the average water conservation amount in the central city showed a decreasing trend, with a magnitude of 0-27.64 mm, indicating that the central city did not have water conservation capacity and that its water conservation loss increased gradually.

3.2 The difference in the water conservation services among different land cover types

Compared to 2005, the average water conservation amount for each land cover type in 2010 in Beijing generally increased to some degree (Fig. 5, Fig. 6), consistent with the temporal changes in the average water conservation amount for the entire city of Beijing. The only exception was that the average water conservation amount for the artificial surface indicated a decreasing trend, which was mainly due to the fact that the climate-induced increase in the actual evapotranspiration and surface runoff was more even though precipitation increased. Among land cover types, the average water conservation capacity decreased in the following order: wetland, forest, grassland, cropland, bare land and artificial surface. The total amount of water conservation was related to the average water conservation capacity and area of each land cover type. The total amount of water conservation decreased in the following order: forest, grassland, wetland, bare land, cropland and artificial surface, among which the contribution of forest water conservation was the largest, with a total of 2.91×10⁸-5.20×10⁸ m3. Overall, wetlands, forests and grasslands can provide WCS, whereas the other land cover types indicate mostly negative quantities of water conservation. There are few studies on the overall average water conservation amount for the land cover types in Beijing. Zhang’s estimation of the water conservation amount in the northern water conservation area of Beijing showed that the annual mean water conservation amount decreased in the following order: shrub land, forest land, sparse forest land and grassland, which was consistent with the order of the water conservation amount for the relevant land cover types in this study (Zhang, 2012).
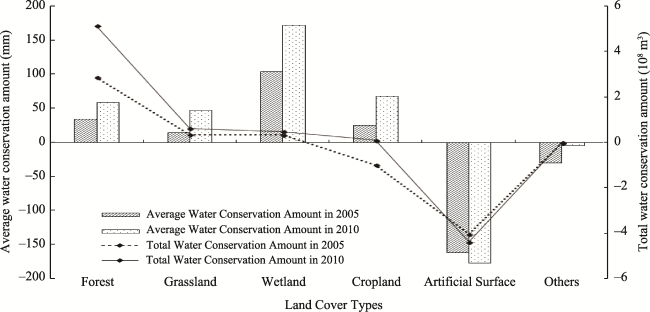
Fig. 5 Average and total water conservation amount of the first land cover types of Beijing in 2005 and 2010
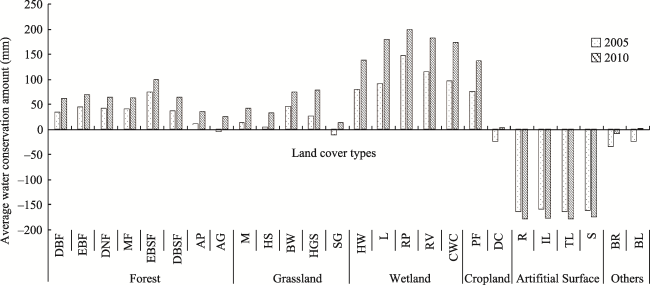
Fig. 6 Average water conservation amount of the second land cover types of Beijing in 2005 and 2010
Note: DBF: Deciduous Broadleaf Forest; EBF: Evergreen Broadleaf Forest; DNF: Deciduous Needleleaf Forest; MF: Mixed Forests; EBSF: Evergreen Broadleaf Shrub Forest; DBSF: Deciduous Broadleaf Shrub Forest; AP: Arbor Plantation; AG: Arbor Greenbelt; M: Meadow; HS: Herbaceous Steppe; BW: Brushwood; HGS: Herbaceous Green Space; SG: Sparse Grassland; HW: Herbaceous Wetland; L:Lake; RP: Reservoir and Pond; RV: Rivers; CWC: Canal and Water Channel; PF: Paddy Field; DC: Dryland Cropland; R: Residence; IL: Industrial Land; TL: Transportation Land; S: Stope; BR: Bare Rock; BL: Bare Land.

3.3 The difference in the water conservation services between different functional areas

The average water conservation amount for each main functional area of Beijing varied considerably (Fig. 7). Among the four main functional areas, only the ECA showed a positive average water conservation amount of 18.23-41.96 mm, and the total amount of water conservation was up to 2.06×10⁸-4.74×10⁸ m3. The average water conservation quantities for the other main functional areas were all negative, and larger absolute values for the negative values suggested more loss of the water conservation per unit area. This was due to the differences in precipitation, actual evapotranspiration and surface runoff in each functional area. The average precipitation and actual evapotranspiration for each functional area varied slightly between 2005 and 2010. They were slightly higher in the ECA and the UDNA than in the CFCA and UFDA. However, the average surface runoff varied substantially among the four main functional areas, indicating a trend of CFCA > UFDA > UDNA > ECA. The average surface runoff was up to 236.56-336.45 mm in the CFCA, which was over six times that in the ECA (41.33-51.12 mm). The reason for the large difference was that the runoff generation in each land cover type was different and decreased in the following order: construction land, shrub, grassland, forest and cropland (Zhu and Li, 2005; Zhu, 2007; Wang et al., 2014; Guo et al., 2014; Farley et al., 2005). Based on the average for 2005 and 2010, the ratio of the artificial surface with high runoff generation capacity in each functional area was 91.63%, 60.31%, 27.00%, and 5.34% in the CFCA, UFDA, UDNA and ECA, respectively (Fig. 8, Fig. 9). The ratio of forest and cropland of low runoff generation capacity was 4.87%, 32.87%, 67.91% and 86.66% in the CFCA, UFDA, UDNA and ECA, respectively. Therefore, the water conservation function of the ECA was critical to the water resource conservation of the entire city of Beijing. It was suggested that protection of the wetlands and forests for water conservation should be enhanced within the ECA of Beijing and that the occupation of ecological land should be avoided due to the chaotic expansion of urban construction land use.
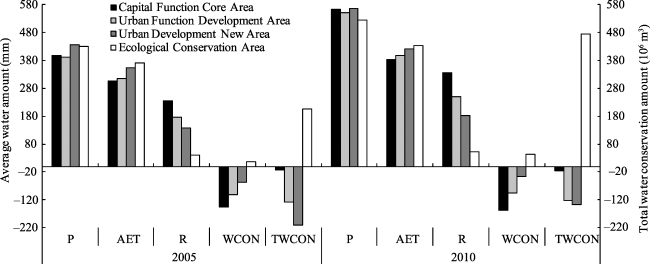
Fig. 7 Variation of precipitation, evapotranspiration, surface runoff and water conservation amount of Beijing’s functional areas in 2005 and 2010
Note: P-Average Precipitation; AET-Average Actual Evapotranspiration; R-Average Surface Runoff; WCON- Average Water Conservation Amount; TWCON- Total Water Conservation Amount.
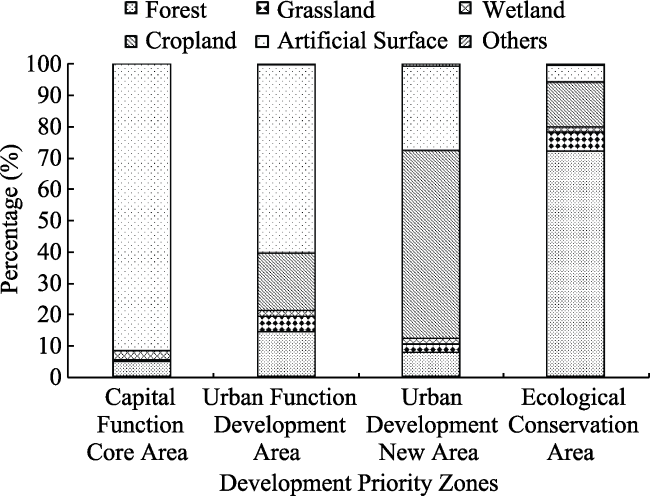
Fig. 8 Land cover types composition of Beijing’s functional areas
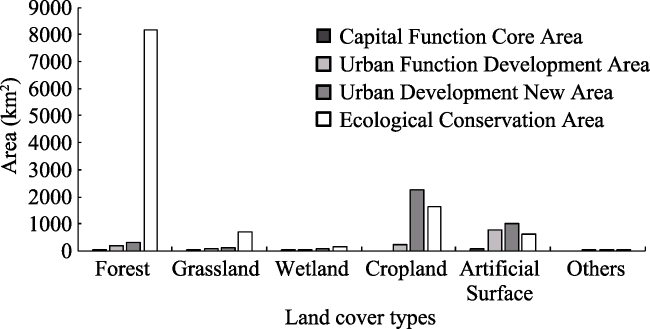
Fig. 9 Land cover types of Beijing’s functional areas

4 Discussion

4.1 The protection focus of the ecological conservation area

The water conservation capacity within the ECA varied substantially between each district and county (Fig. 3). The contribution of each district and county to the overall water conservation of the ECA is the key in determining the protection focus. In 2005 and 2010, the overall water conservation function of Miyun District was the largest, accounting for 55.23% and 34.13%, respectively, followed by Huairou District (28.97%, 21.97%), Pinggu District (14.14%, 11.44%), Mentougou District (5.58%, 10.69%) and Yanqing District (2.65%, 10.37%), whereas the contributions from the mountainous Fangshan District and the Changping District were small. The average water conservation quantities for the districts and counties within the ECA in 2005 and 2010 were 15.93 mm and 40.45 mm, respectively. Only Miyun District, Pinggu District and Huairou District exceeded the average (Fig. 10). The average water conservation amount was the largest in Miyun District, which was 51.09-72.66 mm, followed by the Pinggu District (30.71- 57.17 mm), Huairou District (28.13-49.08 mm), Mentougou District (7.94-34.97 mm), Yanqing District (2.73-24.55 mm), the mountainous Changping District (-1.70- 26.67 mm) and Fangshan District (-7.38-18.08 mm).
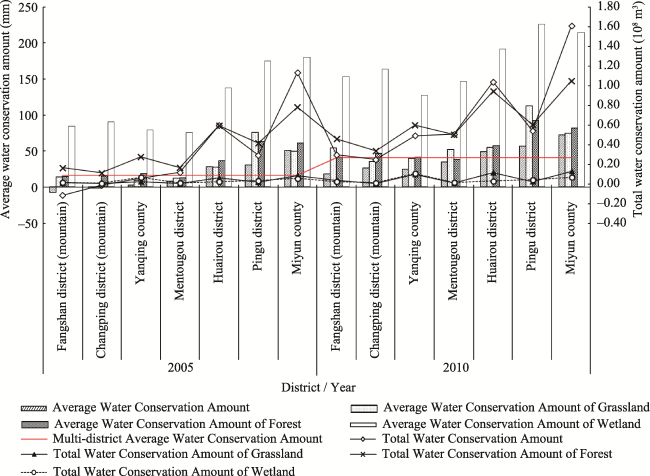
Fig. 10 The water conservation amount of different counties in Beijing’s Ecological Conservation Area
The contribution of each district and county to the total amount of water conservation was determined by the average water conservation amount and land cover composition, especially the average water conservation amount and area of the wetlands, grasslands and forests in each district and county. The average water conservation amount of the wetlands was the highest in each district and county in 2005 and 2010, whereas the magnitude varied with district and county, which generally decreased in the following order: Miyun District, Pinggu District, Huairou District, Changping District (mountainous area), Fangshan District (mountainous area), Mentougou District and Yanqing District (Fig. 10). The average water conservation amount for forests was lower than that of wetlands in each district and county and generally higher than grasslands. The magnitude of the average water conservation amount for forests in descending order was Pinggu District > Miyun District > Huairou District > Yanqing District, Changping District (mountainous area) > Fangshan District (mountainous area) > Mentougou District. The magnitude of the average water conservation amount for grasslands in descending order was Pinggu District > Miyun District > Huairou District > Fangshan District (mountainous area) > Mentougou District > Yanqing District > Changping District (mountainous area). Although the average water conservation amount for wetlands was the largest, its contribution to the total amount of water conservation in each district and county was not large due to its small area and generally comparable to that of grasslands. The contribution of forest from each district and county to the total amount of water conservation was the largest, and the changes in forests and the total amount of water conservation of each district and county were consistent with the highest correlation. This suggested that forests played a key role in regional water conservation. In summary, water conservation for forests in Miyun District, Huairou District and Pinggu District played an indispensable role in the water conservation function for the entire city of Beijing, and the forests in these three functional areas were the main forest body of Beijing that was important for WCS. Therefore, the resource construction and management of forests in these three areas should be enhanced. In addition, the enhancement of forest resource protection and water conservation capacity for the other functional areas should also be emphasized.

4.2 Study limitations and future work

The estimation using the water balance equation is intended for the entire study area, which is helpful in evaluating the overall condition of the regionally conserved water resources and is a suitable method for calculating the water conservation amount of Beijing. However, this method is difficult to use in evaluating the differences in the water conservation function within the assessed area and ignores the spatial heterogeneity. The method assumes a homogeneous distribution of precipitation, evapotranspiration and surface runoff in the assessed area. In fact, precipitation, evapotranspiration and runoff indicate considerable spatial heterogeneity for an individual land cover type. 1) In addition to atmospheric circulation, precipitation is also affected by local elevation, topography and vegetation. For example, the annual mean precipitation isoline for Beijing is generally consistent with the orientation of the mountains. The southeastern warm and humid airflow is forced upwards along the southeastern slopes of the mountains to generate precipitation during the summer, forming multiple rain centres in an arc direction along the southeastern slopes of the western and northern mountains (Huang, 2012). This characteristic of precipitation is difficult to evaluate in a large-scale precipitation calculation. 2) Evapotranspiration includes vegetation transpiration, canopy interception and soil evaporation. The actual evapotranspiration is subject to not only the growth status and physiological characteristics of vegetation but also the environmental factors, including meteorology, topography and soil, which show distinct temporal and spatial heterogeneity (Lu et al., 2015). 3) The surface runoff is impacted by many factors, including soil moisture, litter layer thickness and soil porosity, which also has considerable spatial heterogeneity. Therefore, the water conservation amount calculated by the water balance method ignores the spatial heterogeneity of topography, elevation, vegetation, litter and soil, resulting in uncertainty. The water conservation amount is subject to the combined effect of land surface conditions and meteorological parameters, which have complex driving mechanisms. It exhibits an important influence on regional water use. Currently, it is difficult to monitor the actual evapotranspiration at a regional scale, and the measurement of surface runoff requires designated baselines. The future research should focus on how to monitor the areas with little data to estimate water conservation amount more accurately, which is important to the rational allocation and management of regional water.

5 Conclusions

This study adopted the water balance equation to analyse the spatiotemporal pattern of Beijing’s WCS at multiple scales, including city, main functional areas and key districts and counties. The results indicated that the water conservation amount showed an obvious increasing trend from the central city to its vicinities and was high in the northern and western sections of the ECA. For land cover types in Beijing, the average water conservation capacity decreased in the following order: wetland, forest, grassland, cropland, bare land and artificial surface, among which the contribution of forest conserved water was the largest. For each main functional area in Beijing, the average water conservation amount varied considerably, among which only that of the ECA was positive. Therefore, the water conservation function of the ECA plays a critical role in the water resource conservation of the entire city of Beijing. For the key districts and counties in Beijing, only Miyun District, Pinggu District and Huairou District exceeded the average water conservation amount for the ECA. Investigating the reasons for the spatiotemporal difference in water conservation amount and identifying the high-value areas of the WCS in 2005 and 2010 can provide a scientific and objective reference for the water resource management and planning in Beijing. It is of practical significance to the enhancement of Beijing’s WCS, improvement of the ecological environmental quality and the sustainable development of society and the economy before the implementation of the Beijing Municipal Major Functional Zoning Plan.
[1]
Allen R G.1998. Crop evapotranspiration-guidelines for computing crop water requirements.FAO Irrigation and drainage paper, 300(9): 1-15.

[2]
Chang D, Ma Z.2012. Wastewater reclamation and reuse in Beijing: Influence factors and policy implications.Desalination, 297(26): 72-78.

[3]
Cheng H, Shang L L, Niu Y T, et al.2013. Analysis of Beijing water demand forecast based on grey system model.Guangdong Water Resources and Hydrology, (7): 55-58. (in Chinese)

[4]
Cui L L, Shi J.2012. Urbanization and its environmental effects in Shanghai, China.Urban Climate, 2: 1-15.

[5]
Farley K A, Jobbágy E G, Jackson R B.2005. Effects of afforestation on water yield: a global synthesis with implications for policy.Global Change Biology, 11(10): 1565-1576.

[6]
Gao Y, Feng Z, Li Y, et al.2014. Freshwater ecosystem service footprint model: A model to evaluate regional freshwater sustainable development-A case study in Beijing-Tianjin-Hebei, China.Ecological Indicators, 39(4): 1-9.

[7]
Green P A, Vörösmarty C J, Harrison I, et al.2015. Freshwater ecosystem services supporting humans: pivoting from water crisis to water solutions.Global Environmental Change, 34: 108-118.

[8]
Guo J T, Zhang Z Q, Wang S P, et al.2014. Appling SWAT model to explore the impact of changes in land use and climate on the streamflow in a Watershed of Northern China.Acta Ecologica Sinica, 34(6): 1559-1567. (in Chinese)

[9]
He C Y, Zhang D, Huang Q X, et al.2016. Assessing the potential impacts of urban expansion on regional carbon storage by linking the LUSD- urban and InVEST models.Environmental Modelling Software, 75: 44-58.

[10]
Huang Z Y.2012. Study of hydrological cycle and water balance of typical forests in Beijing mountainous area. Master diss., Beijing Forestry University. (in Chinese)

[11]
Li D L, Wu S Y, Liu L B, et al.2017. Evaluating regional water security through a freshwater ecosystem service flow model: A case study in Beijing-Tianjian-Hebei region, China.Ecological Indicators, 81: 159-170.

[12]
Li W H, He Y T, Yang L Y.2001. A summary and perspective of forest vegetation impacts on water yield.Journal of Natural Resources, 16(5): 398-406. (in Chinese)

[13]
Liao Q, Zhang S F, Chen J X.2013. Risk assessment and prediction of water shortages in Beijing.Resources Science, 35(1): 140-147. (in Chinese)

[14]
Liu Z Q, Yu X X, Jia G D, et al.2017. Contrasting water sources of evergreen and deciduous tree species in rocky mountain area of Beijing, China.Catena, 150: 108-115.

[15]
Lu Q Q, He H L, Zhu X J, et al.2015. Study on the variations of forest evapotranspiration and its components in Eastern China.Journal of Natural Resources, 30(9): 1436-1448. (in Chinese)

[16]
Lü X Z.2013. Study on the effects of forest vegetation on hydrological process on slope in Beijing mountain area. PhD diss., Beijing Forestry University. (in Chinese)

[17]
Lü Y H, Hu J, Sun F X, et al.2015. Water retention and hydrological regulation: harmony but not the same in terrestrial hydrological ecosystem services.Acta Ecologica Sinica, 35(15): 5191-5196. (in Chinese)

[18]
Mo F, Li X Y, He S X, et al.2011. Evaluation of soil and water conservation capacity of different forest types in Dongling Mountain.Acta Ecologica Sinica, 31(17): 5009-5016.

[19]
Song C, Yan J J, Sha J H, et al.2018. Dynamic modeling application for simulating optimal policies on water conservation in Zhangjiakou City, China.Journal of Cleaner Production, 201: 111-122.

[20]
Sun L D, Zhu J Z.1995. Comprehensive Benefit Study and Evaluation of soil and Water Conservation Forest System. Beijing: Science Press, 362-377.

[21]
Sun S.2019. Water footprints in Beijing, Tianjin and Hebei: A perspective from comparisons between urban and rural consumptions in different regions.Science of the Total Environment, 647: 507-515.

[22]
Sun S, Fang C L, Lv J Y.2017. Spatial inequality of water footprint in China: a detailed decomposition of inequality from water use types and drivers.Journal of Hydrology, 553: 398-407.

[23]
Sun X, Lu Z M, Li F, et al.2018. Analyzing spatio-temporal changes and trade-offs to support the supply of multiple ecosystem services in Beijing, China.Ecological Indicators, 94: 117-129.

[24]
Wang J H, Shang Y Z, Wang H, et al.2015. Beijing water resources: challenges and solutions.Journal of the American Water Resources Association, 51(3): 614-623.

[25]
Wang Q, Zhan X X, Wei M J, et al.2011. Research summary of planning and design standards for storm water system in Beijing city.Geomatics World, 37(10):34-39. (in Chinese)

[26]
Wang S Y.2011. Study on the Characteristics of Slope Runoff and Sediment Yield in Dongtaigou Watershed of Huairou. PhD diss., Beijing Forestry University. (in Chinese)

[27]
Wang S, Chen B.2016. Energy-water nexus of urban agglomeration based on multiregional input-output tables and ecological network analysis: A case study of the Beijing-Tianjin-Hebei region.Applied Energy, 178: 773-783.

[28]
Wang X L, Wang H L, Wang Q M.2014. On the hydrological response to the land use/cover change of Four-lake basin in Jianghan plain.Journal of Huazhong Normal University (Natural.Science), 48(1): 101-105. (in Chinese)

[29]
Wei D.2005. Beijing water resources and the south to north water diversion project.Canadian Journal of Civil Engineering, 32(1): 159-163.

[30]
Wei Y G, Wang Z C, Wang H W.2018. Promoting inclusive water governance and forecasting the structure of water consumption based on compositional data: A case study of Beijing.Science of the Total Environment, 634: 407-416.

[31]
Xu J, Xiao Y, Xie G D, et al.2016. Spatiotemporal analysis of water supply service in the Dongjiang Lake Basin.Acta Ecologica Sinica, 36(15): 4892-4906. (in Chinese)

[32]
Xu J, Xie G D, Xiao Y, et al.2018. Dynamic analysis of ecological environment quality combined with water conservation changes in national key ecological function areas in China.Sustainability, 10(4): 1202.

[33]
Xu Z C, Tang Y, Connor T, et al.2017. Climate variability and trends at a national scale.Scientific Reports, 7(3258): 1-10.

[34]
Yao L, Wei W, Yu Y, et al.2018. Rainfall-runoff risk characteristics of urban function zones in Beijing using the SCS-CN model.Journal of Geographical Sciences, 28(5): 656-668.

[35]
Ye B.2007. Studies on the water consumption characteristics and water balance of the standards of Populus simonni and Robinia psuedoacacie in Yanging, Beijing. PhD diss., Chinese Academy of Forestry. (in Chinese)

[36]
Yu X X, Zhou B, Lü X Z, et al.2012. Evaluation of water conservation function in mountain forest areas of Beijing based on InVEST model.Sientia Silvae Sinicae, 48(10): 1-5. (in Chinese)

[37]
Zhang B, Li W H, Xie G D, et al.2009. Water conservation function and its measurement methods of forest ecosystem. Chinese Journal of Ecology, 28(3): 529-534. (in Chinese)

[38]
Zhang B, Li W H, Xie G D, et al.2010. Water conservation of forest ecosystem in Beijing and its value.Ecological Economics, 69(7): 1416-1426.

[39]
Zhang B, Xie G D, Yan Y P, et al.2011b. Regional differences of water conservation in Beijing’s forest ecosystem.Journal of Forestry Research, 22(2): 295.

[40]
Zhang H B.2012. Estimation of regional water conservation based on SEBS and SCS model: a case study of mountainous area in northern Beijing. Chinese Research Academy of Environmental Sciences. (in Chinese)

[41]
Zhang X J, Chen C, Lin P F, et al.2011a. Emergency drinking water treatment during source water pollution accidents in china: origin analysis, framework and technologies.Environmental Science & Technology, 45: 161-167.

[42]
Zhang Z Y, Shi M J, Yang H.2012. Understanding Beijing’s water challenge: A decomposition analysis of changes in Beijing’s water footprint between 1997 and 2007.Environmental Science & Technology, 46:12373-12380.

[43]
Zhou L.2015. Urban Evapotranspiration in Beijing. Master diss., Tsinghua University. (in Chinese)

[44]
Zhu C H, Li R D.2005. Impact of land use change on runoff-yield of Dongting Lake Area.Resources and Environment in the Yangtze Basin, 14(5): 566-569. (in Chinese)

[45]
Zhu Y X.2007. Modeling of Rainfall and Runoff Relationship and Estimation of Influence of Land Surface Change on Runoff in Suzhou. Master diss., Hohai University. (in Chinese)

Outlines

/