
Journal of Resources and Ecology >
Interdependent Dynamics of LAI-ET across Roofing Landscapes: the Mongolian and Tibetan Plateaus
Received date: 2018-10-22
Accepted date: 2019-01-10
Online published: 2019-05-30
Supported by
National Key Research and Development Program of China (2017YFB0503005)
The Strategic Priority Research Program of the Chinese Academy of Sciences (XDA19050501, XDA19040305)
National Natural Science Foundation of China (41601100)
The International Postdoctoral Exchange Fellowship Program 2015 by the Office of China Postdoctoral Council (No. 38 Document of OCPC, 2015).
Copyright
The Mongolian and Tibetan Plateaus have experienced warming higher than the global average in recent decades, resulting in many significant changes to ecosystem structures and functions. Among items that show change are the leaf area index (LAI) and evapotranspiration (ET), both of which play a fundamental role in shaping many causes and consequences of land surface processes and climate. This study examines the spatiotemporal changes of the LAI and ET and their relationships on these two roofing landscapes. Based on the MODIS products from 2000 through 2014, we found that there existed a general positive relationship between LAI and ET on the Mongolia Plateau (MP), while synergy did not exist on the Tibetan Plateau (TP). Overall, 49.38% (50.62%) of land areas on the TP experienced significant increases (decreases) in LAI, while on the MP the percentages of increase and decrease were 94.92% (5.09%). For ET, the increased land area was 21.70% (124100 km2) on the TP and 88.01% (341600 km2) on the MP. More importantly, the relationships varied substantially across space and over time, with mismatches found in some parts of the landscapes. Additional observational investigations and/or experimental research are needed to explore the relationships, including the influences of vegetation characteristics and disturbances.
Key words: ET; LAI; alpine; Eurasian continent; altitude and latitude; land surface process
TIAN Li . Interdependent Dynamics of LAI-ET across Roofing Landscapes: the Mongolian and Tibetan Plateaus[J]. Journal of Resources and Ecology, 2019 , 10(3) : 296 -306 . DOI: 10.5814/j.issn.1674-764X.2019.03.008
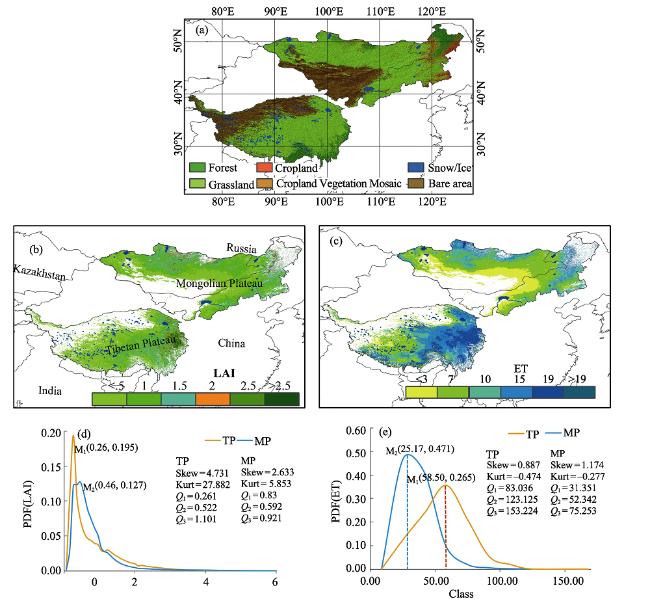
Fig. 1 (a) The spatial distributions of land cover types on the two plateaus; (b) The average annual LAI during 2000-2014; (c) The average annual ET during 2000-2014; (d-e) The probability density function (PDF) for LAI and ET. |
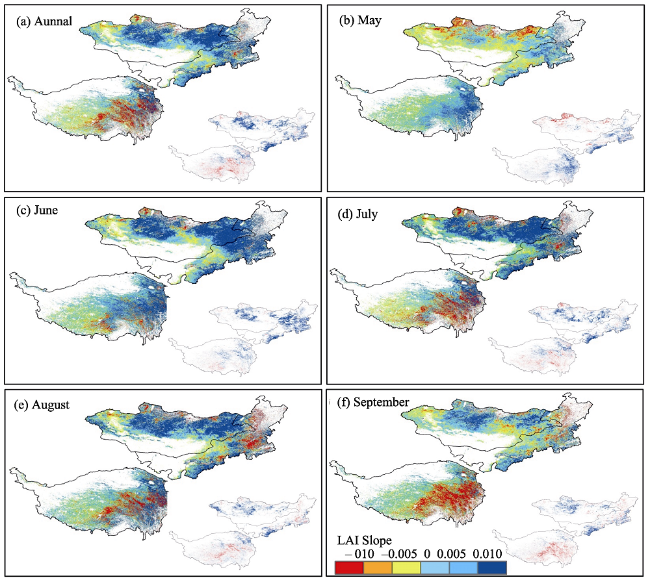
Fig. 2 Spatial distributions of the change trends for LAI in the growing season (May-September); the inset map shows significant increases (blue) and decreases (red) (P<0.05). |
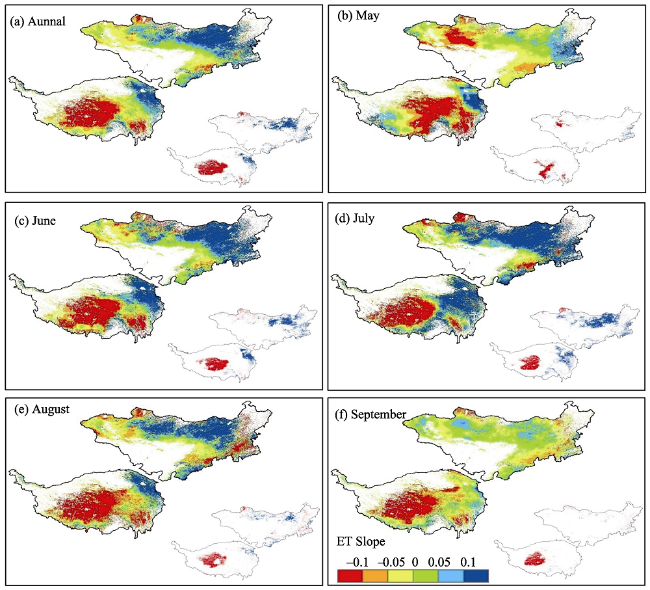
Fig. 3 Spatial distributions of the change trends for ET in the growing season (May-September); the inset map shows significant increases (blue) and decreases (red) (P<0.05). |
Table 1 The average annual and standard deviation (std) of LAI and ET during 2000-2014 by average annual LAI class on the Mongolian Plateau (MP) and the Tibetan Plateau (TP) |
| Var | Loc | Sig. Area | Annual | May | June | July | August | September |
|---|---|---|---|---|---|---|---|---|
| LAI | TP | Total (1000 km2) | 57.41 | 65.03 | 38.39 | 47.92 | 48.00 | 42.96 |
| Decreasing | 29.06 | 3.16 | 6.53 | 19.99 | 18.55 | 31.03 | ||
| (%) | (50.62) | (4.86) | (17.01) | (41.72) | (38.65) | (72.23) | ||
| Increasing | 28.35 | 61.86 | 31.86 | 27.93 | 29.45 | 11.93 | ||
| (%) | (49.38) | (95.13) | (82.99) | (58.28) | (61.35) | (27.77) | ||
| MP | Total (1000 km2) | 101.93 | 57.12 | 100.63 | 80.81 | 62.59 | 61.36 | |
| Decreasing | 5.19 | 17.25 | 2.24 | 4.99 | 6.21 | 7.63 | ||
| (%) | (5.09) | (30.20) | (2.23) | (6.17) | (9.92) | (12.43) | ||
| Increasing | 96.75 | 39.87 | 98.39 | 75.82 | 56.38 | 53.73 | ||
| (%) | (94.92) | (69.80) | (97.77) | (93.83) | (90.08) | (87.57) | ||
| ET | TP | Total (1000 km2) | 571.90 | 196.90 | 478.20 | 476.80 | 333.90 | 265.70 |
| Decreasing | 447.80 | 154.30 | 332.40 | 278.70 | 295.40 | 250.10 | ||
| (%) | (78.30) | (78.36) | (69.51) | (58.46) | (88.47) | (94.12) | ||
| Increasing | 124.10 | 42.60 | 145.80 | 198.00 | 38.50 | 15.60 | ||
| (%) | (21.70) | (21.64) | (30.49) | (41.54) | (11.53) | (5.88) | ||
| MP | Total (1000 km2) | 388.20 | 86.10 | 343.30 | 496.80 | 224.60 | 49.80 | |
| Decreasing | 46.50 | 53.80 | 48.40 | 29.40 | 78.10 | 30.30 | ||
| (%) | (11.99) | (62.42) | (14.11) | (5.92) | (34.79) | (60.82) | ||
| Increasing | 341.60 | 32.40 | 294.80 | 467.40 | 146.40 | 19.50 | ||
| (%) | (88.01) | (37.58) | (85.89) | (94.08) | (65.21) | (39.18) |
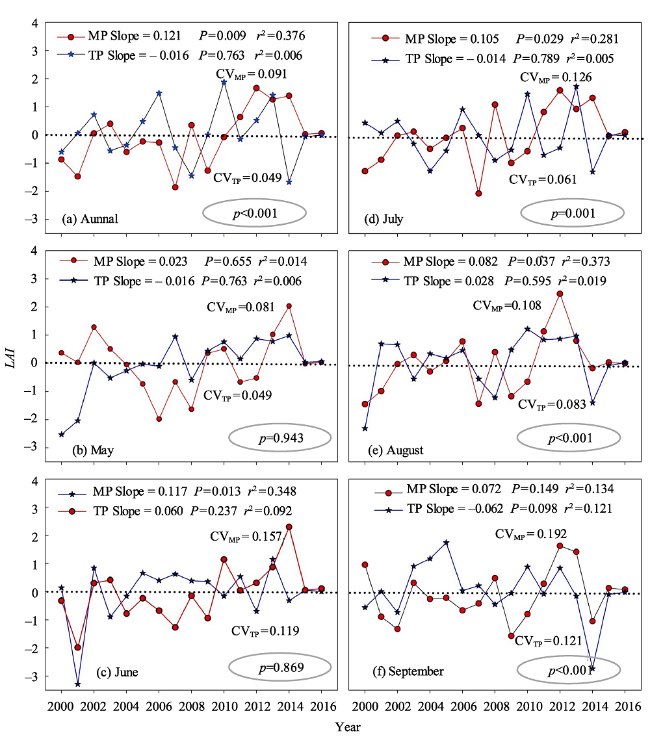
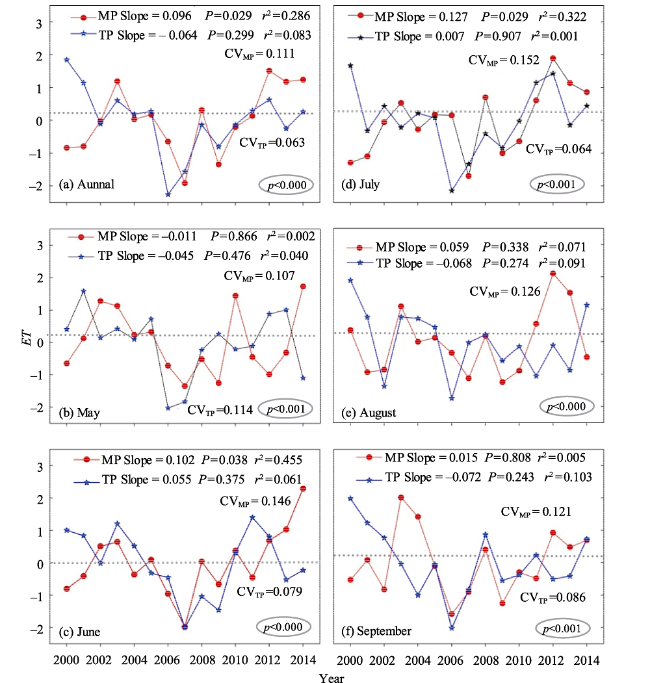
Fig. 4 The trends of the mean LAI on grasslands in the Mongolian and Tibetan plateaus |
Fig. 5 The trends of the ET on the grasslands in the Mongolian and Tibetan plateaus |
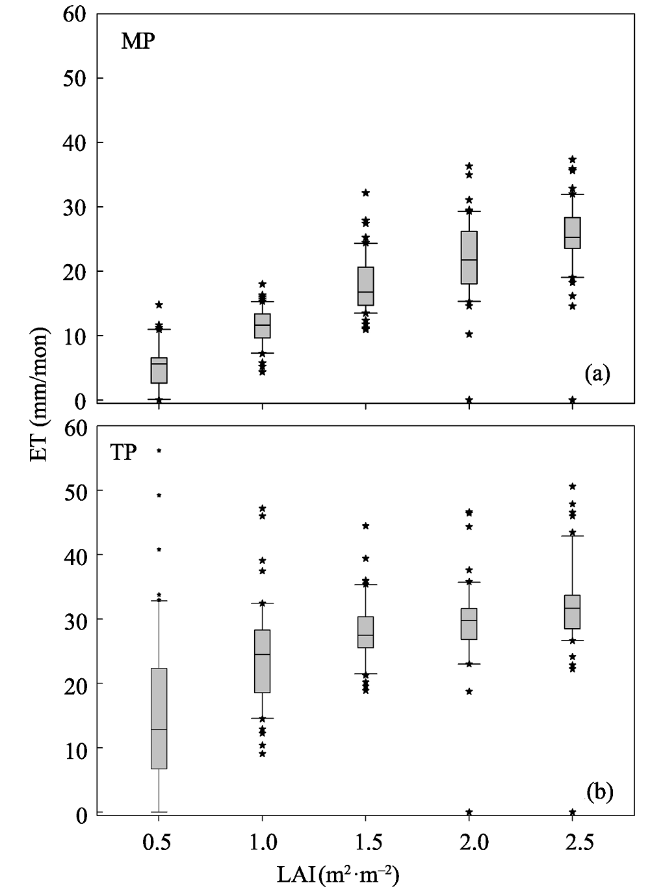
Fig. 6 Boxplots of MODIS ET retrieval as a function of MODIS-estimated leaf area index (LAI) classed (0.5 LAI steps); stratified average data for the two plateaus |
The authors have declared that no competing interests exist.
| [1] |
|
| [2] |
|
| [3] |
|
| [4] |
|
| [5] |
|
| [6] |
|
| [7] |
|
| [8] |
|
| [9] |
|
| [10] |
|
| [11] |
|
| [12] |
|
| [13] |
|
| [14] |
IPCC.2014. Climate Change 2014. Synthesis Report Summary Chapter for Policymakers.
|
| [15] |
|
| [16] |
|
| [17] |
|
| [18] |
|
| [19] |
|
| [20] |
|
| [21] |
|
| [22] |
|
| [23] |
|
| [24] |
|
| [25] |
|
| [26] |
|
| [27] |
|
| [28] |
|
| [29] |
|
| [30] |
|
| [31] |
|
| [32] |
|
| [33] |
|
| [34] |
|
| [35] |
|
| [36] |
|
| [37] |
|
| [38] |
|
| [39] |
|
| [40] |
|
| [41] |
|
| [42] |
|
| [43] |
|
| [44] |
|
| [45] |
|
| [46] |
|
| [47] |
|
| [48] |
|
/
| 〈 |
|
〉 |