Resource Econmy

Optimal Hybrid Power System Using Renewables for a Household in the UK

  • MIAO Chunqiong , 1, 2 ,
  • TENG Kailiang , 2, 3, * ,
  • GAO Ya 2 ,
  • JI Jie 2 ,
  • WANG Yaodong 2
Expand
  • 1. Electrical Engineering Department, Guangxi Electrical Polytechnic Institute, Nanning 530007, China
  • 2. Sir Joseph Swan Centre for Renewable Energy Research, School of Mechanical and System Engineering, Newcastle University, Newcastle upon Tyne NE1 7RU, UK
  • 3. College of Electrical Engineering, Guangxi University, Nanning 530004, China
*Corresponding author: TENG Kailiang, E-mail:

First author: MIAO Chunqiong, E-mail:

Received date: 2018-05-25

  Accepted date: 2018-08-30

  Online published: 2019-05-30

Supported by

The Project of Guangxi University Outstanding Post-graduate Student Abroad

The Project of Guangxi University for Youth (2018KY1120, 2018KY1121)

Copyright

All rights reserved

Abstract

The aim of this study is to find an optimal design for a distributed hybrid renewable energy system (HRES) for a residential house in the UK. The hybrid system, which consists of wind turbines, PV arrays, a biodiesel generator, batteries and converters, is designed to meet the known dynamic electrical load of the house and make use of renewable energy resources available locally. Hybrid Optimization Model for Electric Renewables (HOMER) software is used for this study. Different combinations of wind turbines, PV arrays, a biodiesel generator and batteries are evaluated and compared using the NPC (Net Present Cost) method to find the optimal solutions. The HRES is modeled, simulated and optimized using HOMER. The results showed that the wind-biodiesel engine-battery system was the best with the lowest NPC (USD 60254) and the lowest COE (Cost of Energy, USD 0.548/kWh) while the second best system added PV arrays. This study gives evidence of the key contribution wind turbines make to HRES due to abundant wind resources in the UK, especially in Wales.

Cite this article

MIAO Chunqiong , TENG Kailiang , GAO Ya , JI Jie , WANG Yaodong . Optimal Hybrid Power System Using Renewables for a Household in the UK[J]. Journal of Resources and Ecology, 2019 , 10(3) : 289 -295 . DOI: 10.5814/j.issn.1674-764X.2019.03.007

1 Introduction

Environmental pollution related to increased emissions of carbon dioxide and other gases is of great concern in the UK and has become a major global issue. Energy costs have escalated in real terms and are likely to continue to increase in the near future. The burning of fossil fuels is the main cause of unprecedented climate change. Increasing energy costs and climate change concerns have made the utilization of renewable energy, and energy storage and optimization crucial concerns in finding a new energy system. Hybrid renewable energy systems are an effective approach to reduce the consumption of fossil fuel energy resources.
Many researchers have presented their results in the field of autonomous hybrid renewable power systems. Celik (2002) presented an optimization and techno-economic analysis of an autonomous hybrid wind/PV power system. The study found that an optimum combination of hybrid PV and wind power systems showed higher system performance than either of the single systems for the same system cost. However, most of the optimizations were based on an assumption of constant electrical load during the 24 hours of each day. Load variations were not considered. Markvart (1996) provided a method to determine the sizes of the PV array and wind turbine in a hybrid PV/wind power system. However, in this study, the size of the battery was not considered. Diaf et al. (2007) conducted a techno-economic study on an autonomous hybrid PV/wind power system located on Corsica. Later, Diaf et al. (2008) conducted another study on the optimal sizing of an autonomous hybrid PV/wind power system for supplying power to a household. More accurate mathematical models for PV modules, batteries and wind generators were proposed, but a biodiesel generator was not taken into account in their system. Lau et al. (2010) used HOMER simulation software to analyze the feasibility of a hybrid diesel/PV/battery power system that could decrease the consumption of diesel fuel in Malaysia. Zamani and Riahy (2008) applied a new method to optimize a hybrid PV/wind/battery power system to cut down costs. Using HOMER simulation software, Ngan and Tan (2012) presented the technical and economic feasibility of autonomous hybrid PV/wind/diesel power systems in Johor Bahru, a city in southern Malaysia. The study found that both PV/wind/diesel power systems and optimized autonomous hybrid diesel/PV power systems were able to reduce the consumption of fossil fuels and CO2 emissions. Although various studies in several countries have used HOMER simulation software or other mathematical models to examine the feasibility, optimal sizing methodologies and techno- economic factors of hybrid PV/wind power systems, few researchers have studied the techno-economic feasibility of a hybrid wind/PV/biodiesel power system using battery storage and designed for a household. Such a hybrid system would provide a feasible solution for households based completely on renewable energy resources.
This study aims to analyze and evaluate the performance and costs of a hybrid renewable wind/PV/biodiesel power system scheme with battery storage for a select residential building in the UK, based on the building’s load demand and local weather conditions. Furthermore, consideration will be given to the effects of variations in the demand for electricity and ambient conditions on the performance of the hybrid system.

2 Renewable energy potential in Wales

Wales is a part of the United Kingdom located to the west of England. It is approximately 170 miles (256 km) long and 60 miles (96 km) wide. The mean temperature in winter months is around 6 °C and about 20 °C in summer months. Most parts of the UK have limited hours of sunshine per day. Using national radiation levels as a reference, the UK has an annual average of 1339.7 hours of sunshine, while the mean number of sunshine hours in southern England in July range from 6 to 8, while in the Scottish highlands, the daily mean in July is only 3 to 5 hours. During the winter, the daily mean sunshine hours in many parts of the UK ranges from 1 to 2 hours. High altitude areas and the west coast fronting the Atlantic Ocean receive maritime tropical air flow and have strong winds. In fact, the UK has abundant wind resources, particularly in Wales where geography and wind patterns play a vital role in delivering wind power to renewable energy targets. In Wales, wind speed ranges from 3.9 m/s in July to 5.8 m s-1 in January, meaning the average annual wind speed is 4.87 m/s. Wind speeds from October to March surpass the mean level, indicating that superior wind conditions are available for half of the year.

3 HOMER software

HOMER is a software tool that can use a number of different models to examine various renewable energy generation systems. It helps users carry out techno-economic feasibility evaluations for the design of hybrid renewable energy systems. It was developed by the United States National Renewable Energy Laboratory and has been widely used since 1993. It includes three main modes: the simulation mode, the optimization mode and the sensitivity analysis mode. With detailed calculations, the optimization results are automatically listed in sequence based on NPC and levelized COE. It can respond and evaluate any sensitive variation of component inputs to further analyze the reliability of a system.

4 Specification of data inputs

4.1 Load profile

Dwellings in the UK can be categorized into five types: detached, semi-detached, terraced houses, apartment blocks and flats, and bungalows. Among these, semi-detached and terraced houses account for the largest share, together accounting for one third of the total. A semi-detached house built in 1987 in Wales was chosen as a case study. The house has three bedrooms, and a total floor area of 74 m2. Its energy supply is electricity only. The metered energy consumption data was measured in thirty second intervals to keep the generated load profile accurate and consistent with real-time consumption. In order to model an accurate annual profile with information for all four seasons, the data was monitored for two days each in March, June, November and December.
Fig. 1a and Fig. 1b show the daily consumption in the low demand summer season and the peak winter season, respectively. The figure shows that between 00:00-06:00, there is no distinct demand for electricity from appliances during the hours when the occupants are likely sleeping. The load during this time period remains less than 500 W, which can be attributed mostly to the WiFi router and the refrigerator. From 06:00-10:00, as the occupants get up and become active, the load peaks for the first time in the day in the morning. In this time period, use of a kettle, toaster, oven and electric shower system increase the overall load. From 10:00-16:30, the occupants are not at home and the house remains empty so the load drops to a level similar to that found from 00:00-06:00. The second peak of the day occurs between 16:30-19:30, after occupants return home, cook dinner and begin their evening activates. Kitchen appliances, heaters, entertainment devices, a washing machine, and other household electronics may contribute to pulling up the load.
Fig. 1 Daily profile for peak season (a) and low season (b)
Fig. 1a and Fig. 1b show that peak demand during a 24 hour day varied from 1.7 kW h to 8.295 kW h over the course of a year. As a result, we can estimate annual consumption to be 8358 kW h. We can thus calculate that average daily demand reached to 22.9 kW h per day, giving rise to a projection of 24 kW h per day as the scaled annual average demand for the system to be designed.
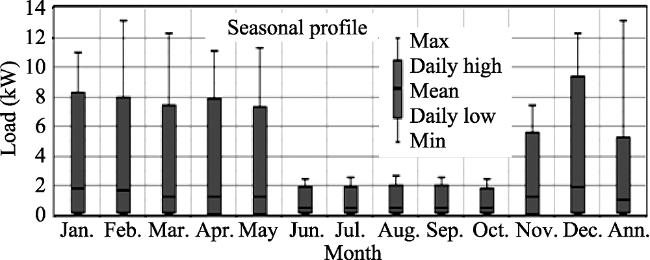
Fig. 2 Monthly average daily load profile for one year
Note: This shows the modeled distribution of the mean daily site load in each month of the year

4.2 Ambient temperature

Silicon is the main material used for PV and, given the physical properties of silicon, the operating temperatures of PV modules are directly influenced by ambient air temperatures, and this has a significant correlation to performance and thermal characteristics (Zhong et al., 2017). A field experiment in the UK revealed that once a residential PV module reached a temperature of 42 °C, its peak power declined by 1.1% for each additional degree of temperature increase (Green, 2002). It is therefore necessary to collect ambient temperature data for the site to program working conditions. Average yearly air temperature data was taken from the National Aeronautics and Space Administration (NASA) database on the RET screen webpage.

4.3 Wind speed

Wind speed data for Wales were also collected from the RET screen webpage. This study used average monthly wind speed data for a 10 year period, monitored at 10 miles above the surface of the earth, as shown in Fig. 4.
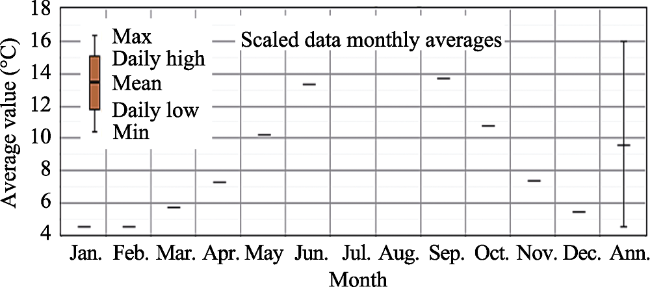
Fig. 3 Monthly air temperature variation in Wales
Note: This chart depicts tendencies within a year. Normal temperature in the summer is around 14 °C while the temperature in the winter is around 4.8 °C indicating that PV arrays installed on site would remain safe within normal operating parameters. The average annual ambient, minimum and maximum temperatures were recorded as 4.54 °C, 15.8 °C and 9.56 °C, respectively.
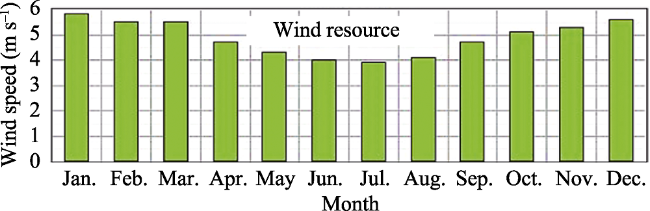
Fig. 4 Monthly wind speed variations in Wales

4.4 Solar irradiation

The solar radiation data for the site were acquired from the NASA database on the RET screen webpage. Daily solar radiation ranged from 0.47 to 4.73 kW·h·m-2 per day whilst the clearness index varied from 0.268 to 0.441, and the annual average of global horizontal radiation is estimated to have been 2.61 kW·h·m-2 each day. The graph shows that more energy is available from solar radiation from April to September while less solar radiation is to be expected in other months; this trend is approximately the reverse of the load profile.

5 System design and description

Fig. 6 presents the design and configuration of a hybrid generation system composed of wind turbines, PV arrays, a biodiesel engine generator and a battery bank that is used to store excessive energy to power the AC load. The generator uses sunflower oil as fuel to satisfy the high renewable penetration target. A system that is grid-connected and one that is off-grid may have certain differences in the choice and size of the specific components used. The charge controller, which regulates the respective power sources to keep the batteries properly fed, is essential only if the system is equipped with batteries. The solar charge controller also adjusts the DC output generated by the PV arrays to the DC bus level with a buck/boost converter which is identical to the battery. Based on the order of the demand, the DC bus level for this design was selected as 48V. The wind charge controller will not only convert the AC output it produces to DC voltage, but also prevent the wind turbine operating at excessive speeds (Prasad and Natarajan, 2006). However, in some cases, the solar charge controller and the wind charge controller can be combined in single hybrid wind/solar charge controller, and in other cases the configuration can be altered to DC coupled or AC coupled (Chauhan and Saini, 2014). The DC power flow at the DC bus will be converted to AC flow via the inverter which integrates the charger function for batteries in the off-grid system, whilst in the on-grid system a bidirectional inverter replaces the inverter. Bidirectional inverters literally allow the DC waveform and the AC waveform to be converted mutually. A bidirectional inverter has two modes: the grid-connection mode sells power from distributed generators to the grid and the rectification mode has a power factor correction with PFC to buy power from the grid. The earnings customers get from selling power to the utility grid offset the costs of installing and operating the system.
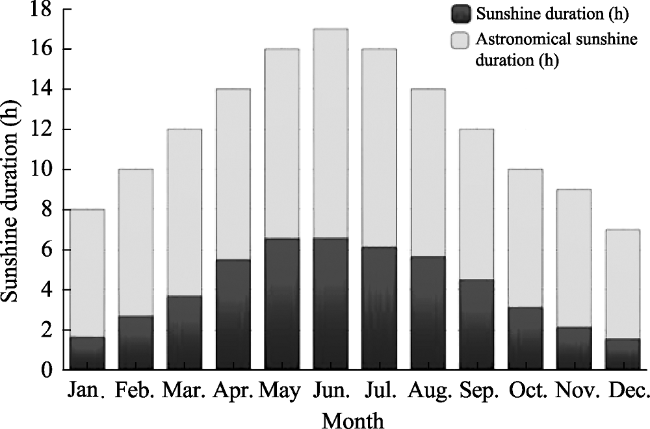
Fig. 5 Average daily sunshine by month in Wales
Note: This describes the average hours of sunshine per day on a monthly basis. During the winter there is less than 2 hours a day of sunshine per day on average, while during the summer average hours of sunshine per day reaches its highest level of up to 6 hours per day.
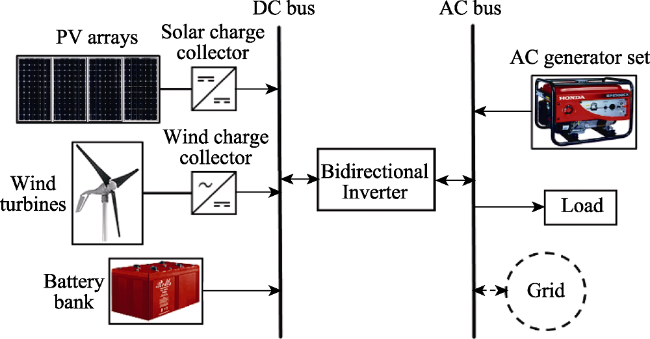
Fig. 6 One type of common hybrid energy generation system

6 Homer simulation results and discussion

The hybrid PV-wind-biodiesel-battery system was designed and simulated. Fig. 7 shows the simulation interface of the HRES system in HOMER.
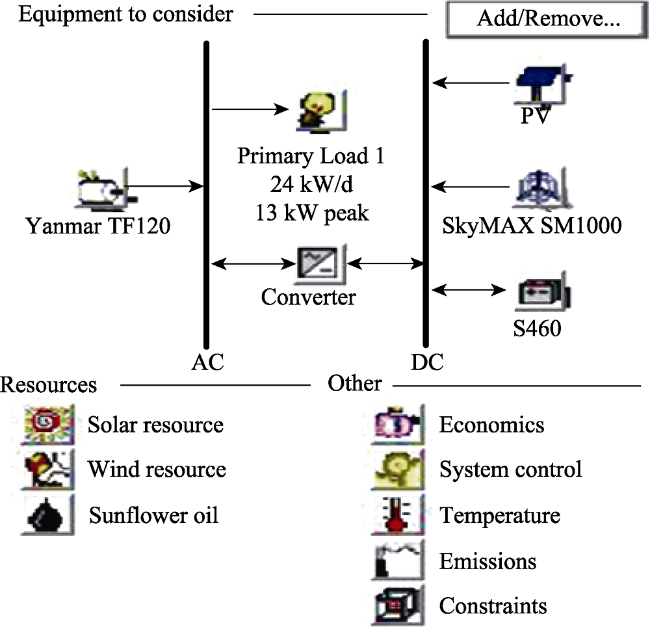
Fig. 7 Structure chart of functional model
The optimization results, economic analysis, electrical analysis, and related sensitivity analysis of the proposed hybrid system are presented in the following paragraphs.

6.1 Optimization results

The simulation results are sorted into categories according to different rates of the wind turbine with FE1000, SM1000, API-2kW, API-3kW, API-5kW. The optimization results are shown in Table 1. The results show that two common configurations are preferred, i.e. the wind/engine/battery system and the PV/wind/engine/battery system with converters that have a 9 kW capacity. Although their NPC and initial capital requirements are not the smallest, these two systems can satisfy the potential peak power demand. The optimum configuration uses an API-2kW Wind Turbine.
Table 1 Optional configurations of the system with API-2KW
API Initial Capital Cost($) Total
NPC($)
COE
($/(kW h))
Sunflower
(kg)
Operating
Cost($/kW)
3 14783 23602 0.364 690
2 28105 38260 0.582 794
6 31965 60254 0.548 421 2,213
5 45278 71749 0.652 319 2,070

6.2 Economic analysis

The cost data included data on initial capital, total NPC (Net Present Cost), and COE (Levelized Cost of Energy) for all targeted alternatives, as summarized in Table 2.
Table 2 Cost data for targeted alternatives
No. Initial Capital Cost($) Total NPC($) COE($/(kW h))
1 34386 79378 0.727
2 47309 89230 0.817
3 29949 74280 0.879
4 42899 82244 0.748
5 31965 60254 0.548
6 45287 71749 0.652
7 34672 74053 0.676
8 44157 84022 0.769
9 38673 68012 0.619
10 43185 78173 0.715
NPC is an equivalent value of the present value basis of the cash flow within the project’s lifetime including the initial capital cost. Replacement cost and O&M (operation & maintenance) costs tell us how much the system costs after installation. Although the initial capital requirement provides an index for decision making. Based on these factors, the optimum configuration is highlighted in red, while the second and third best configurations are highlighted in yellow, as shown in Table 4. The optimum configuration combines six 2 kW rated wind turbines, one biodiesel engine generator, thirty-two batteries and 2 inverters. Its initial cost is GBP 31965, an investment that would be acceptable to many middle-income families in the UK. Initial costs for the second and third best options are GBP 38673 and GBP 45287, respectively. The second option, which combines PV, generator, battery, inverter and a 2 kW rated wind turbine, suggests that the optimal power rate for a wind turbine is provided by API-2 kW wind turbines.
The NPC for these three selections are $60254, $71749 and $68012, respectively. The levelized COE that uses the total annualized cost of the system divided into the annual electricity delivered by the system has been used extensively and effectively to evaluate the HRES. The results show that the best configuration is No. 5, which is comprised of a 2 kW wind turbine, a biodiesel generator, a battery, and an inverter. The second best choice is the No. 9 configuration using a 2 kW wind turbine, even though this configuration has a COE that is 0.071 higher than that of the No. 5 configuration.

6.3 Electrical analysis

The AC load computed for the best choice is 8599 kW·h per year and the actual amount of power provided reaches 8475 kW·h per year, an amount that surpasses the annual load demand of the house (8358 kW h). The second configuration generates 8486 kW·h per year, which is also larger than the load demand of the house.
Fig. 8 shows the computed electricity generation profiles of the best and second best configurations. These two profiles show similar trends for the load profile and this demonstrates the feasibility of these two systems. The generation of electrical power from both systems is approximately 2.5-3.1 kW in January. It decreases to a minimum of approximately 0.9-1.1 kW in July and then increases to a peak level in December. Moreover, no distinct difference appears between the two figures, indicating a significantly low contribution of solar power due to low insolation.
Fig. 8 Computed electricity generation profiles without PV (a) and with PV (b)
From Fig. 8 (a) and Fig. 8 (b), it can also be seen that the biodiesel engine generator is used in most months. It is necessary to equip the system with a biodiesel engine generator as a back-up to provide reliable power supply for the house.
The average monthly production of electricity by the optimized hybrid renewable energy system demonstrates that the wind turbine operates more than the PV array, indicating that the wind turbine serves as the base load. In addition, the highest electric generation is during the months of December and January, because the demand for electricity reaches a peak at this time. The monthly average electricity generation profile matches the load demand profile.

6.4 Comparison and discussion

As stated in Section 6.2, the best configuration utilizes wind and biodiesel to power the household, and this is not entirely in accordance with the aim of this design. However, from both environmental and economic viewpoints, this configuration is considered to be the most appropriate one. As a substitute for power from the existing grid, the proposed system has a COE of $0.548/kW·h, which is more than two times of current tariff for electricity of the supplier of electric power.

7 Conclusions

A distributed HRES to meet the dynamic electrical power demand of a typical household is proposed and studied using HOMER software. The conclusions that can be drawn are:
(1) It is feasible to use a distributed HRES to meet the dynamic electrical power demand of a household;
(2) A wind-biodiesel engine-battery system is the best one, offering the lowest NPC (/$60,254) and the lowest COE (/$0.548/kWh);
(3) The second best system is the best for adding PV arrays, with NPC of /$68,012 and COE /$0.619;
(4) Based on the evidence provided in this study, it can be concluded that due to the abundant wind resources in the UK, especially in Wales, wind turbines can make a highly significant contribution to the HRES.

The authors have declared that no competing interests exist.

[1]
Ackermann T, Andersson G, Söder L.2001. Distributed generation: a definition. Electric Power Systems Research, 57(3): 195-204.

[2]
Celik A N.2002. Optimisation and techno-economic analysis of autonomous photovoltaic-wind hybrid energy systems in comparison to single photovoltaic and wind systems. Energy Conversion and Management, 43(18): 2453-2468.

[3]
Chauhan A, Saini R P.2014. A review on integrated renewable energy system based power generation for stand-alone applications: configurations, storage options, sizing methodologies and control. Renewable and Sustainable Energy Reviews, 38: 99-120.

[4]
Cossent R, Gómez T, Frías P.2009. Towards a future with large penetration of distributed generation: Is the current regulation of electricity distribution ready? Regulatory recommendations under a European perspective. Energy Policy, 37(3): 1145-1155.

[5]
Diaf S, Diaf D, Belhamel M, et al.2007. A methodology for optimal sizing of autonomous hybrid PV/wind system. Energy Policy, 35(11): 5708-5718.

[6]
Diaf S, Belhamel M, Haddadi M, et al.2008. Technical and economic assessment of hybrid photovoltaic/wind system with battery storage in Corsica island. Energy Policy, 36(2): 743-754.

[7]
Green M A.2002. Third generation photovoltaics: solar cells for 2020 and beyond. Physica E: Low-dimensional Systems and Nanostructures, 14(1): 65-70.

[8]
Lau K Y, Yousof M F M, Arshad S N M, et al.2010. Performance analysis of hybrid photovoltaic/diesel energy system under Malaysian conditions.Energy, 35(8): 3245-3255.

[9]
Liu Y, Jia X, Pei P, et al.2016. Simulation and experiment for oxygen-enriched combustion engine using liquid oxygen to solidify CO2. Chinese Journal of Mechanical Engineering, 29(1): 188-194.

[10]
Markvart T.1996. Sizing of hybrid photovoltaic-wind energy systems. Solar Energy, 57(4): 277-281.

[11]
Ngan M S, Tan C W.2012. Assessment of economic viability for PV/wind/diesel hybrid energy system in southern Peninsular Malaysia. Renewable and Sustainable Energy Reviews, 16(1): 634-647.

[12]
Prasad A R, Natarajan E.2006. Optimization of integrated photovoltaic-wind power generation systems with battery storage. Energy, 31(12): 1943-1954.

[13]
Yang D, Kong W, Li B, et al.2016. Intelligent vehicle electrical power supply system with central coordinated protection. Chinese Journal of Mechanical Engineering, 29(4): 781-791.

[14]
Zamani M H, Riahy G H.2008. Introducing a new method for optimal sizing of a hybrid (wind/PV/battery) system considering instantaneous wind speed variations.Energy for Sustainable Development, 12(2): 27-33.

[15]
Zhong Y, Zhou C, Chen S, et al.2017. Effects of temperature and pressure on stress corrosion cracking behavior of 310S stainless steel in chloride solution. Chinese Journal of Mechanical Engineering, 30(1): 200-206.

Outlines

/