
Journal of Resources and Ecology >
Temporal and Spatial Variations of Eco-asset Patterns and the Factors Driving Change in the Wanjiang Demonstration Area
Received date: 2018-01-22
Accepted date: 2018-11-20
Online published: 2019-05-30
Supported by
National Natural Science Foundation of China (41571124)
Copyright
With the rapid development of the society and the economy, people are paying more attention to the value of natural resources and the benefits of the ecological environment. Evaluating the value of eco-assets has become a focus of concern. Quantitative remote sensing measurements, land data and other auxiliary data were used to measure the eco-assets in 46 regions of the Wanjiang Demonstration Area from 1990 to 2013. This paper analyzes temporal and spatial variations of eco-assets’ distribution, composition, change patterns and the factors driving variations. The results show that the distribution of eco-assets in the regions is very uneven, the central region has higher ecological assets than other regions, and it declined first and then rose during the period 1990-2013. The total amount of eco-assets increased by 3.05%. The change in the amount of ecological assets was not large, but it is important that the amount of assets was basically stable, and increases in the proportion of degraded areas was small. Grassland and water body eco-assets decreased by 11.19% and 0.66%, respectively, and that of cultivated land decreased by 15.54%, but forest land increased by 6.42%. As for the change pattern of ecological assets, the per capita assets of Hefei had the largest reduction, and those of Xuancheng the second largest. The spatial and temporal changes of ecological assets in the Wanjiang Demonstration Area include natural factors and human factors. The government's macro-control and economic policies are the main driving factors for the spatial and temporal changes of the ecological assets pattern.
CAO Yuhong , CHEN Chen , LIU Chonggang , LI Lulu , LIU Meiyun . Temporal and Spatial Variations of Eco-asset Patterns and the Factors Driving Change in the Wanjiang Demonstration Area[J]. Journal of Resources and Ecology, 2019 , 10(3) : 282 -288 . DOI: 10.5814/j.issn.1674-764X.2019.03.006
Table 1 Value-equivalent factors per unit area of the eco-system in Wanjiang Demonstration Area (Yuan) |
| Category | Forest land | Grassland | Cultivated land | Water area |
|---|---|---|---|---|
| Gas conditioning | 3097.0 | 707.9 | 442.4 | 0 |
| Climate regulation | 2389.1 | 796.4 | 787.5 | 407.0 |
| Water conservation | 2831.5 | 707.9 | 530.9 | 18033.2 |
| Soil formation and protection | 3450.9 | 1725.5 | 1291.9 | 8.8 |
| Waste disposal | 1159.2 | 1159.2 | 1451.2 | 16086.6 |
| Biodiversity conservation | 2884.6 | 964.5 | 628.2 | 2203.3 |
| Food production | 88.5 | 265.5 | 884.9 | 88.5 |
| Raw material | 2300.6 | 44.2 | 88.5 | 8.8 |
| Entertainment culture | 1132.6 | 35.4 | 8.8 | 3840.2 |
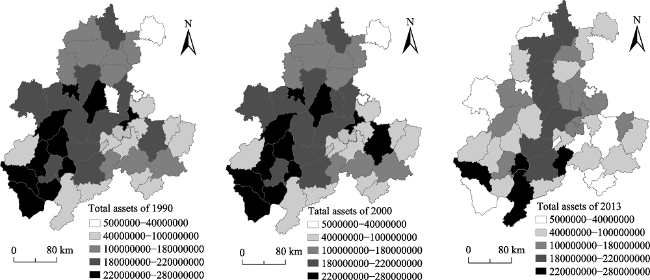
Fig. 1 The spatial distribution of eco-assets in the study area from 1990 to 2013 (Yuan) |
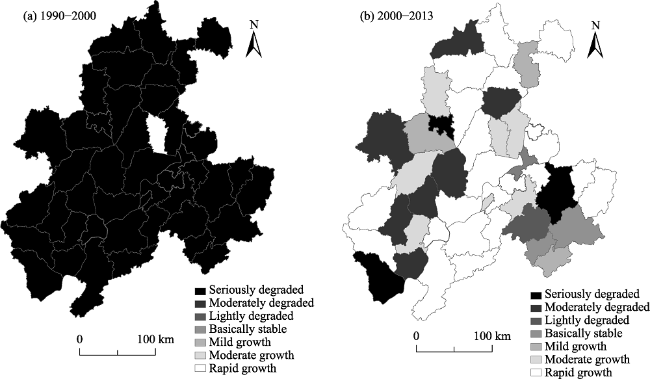
Fig. 2 Temporal and spatial variation of eco-assets in the study area from 1990 to 2013 |
Table 2 The eco-asset classifications of the study area (100 million yuan) |
| Time\Main landscape types | Forest land | Grassland | Cultivated land | Water area | Total |
|---|---|---|---|---|---|
| 1990 | 471.64 | 4.11 | 29.34 | 264.94 | 770.03 |
| 2000 | 432.88 | 3.86 | 30.03 | 238.78 | 705.55 |
| 2013 | 501.90 | 3.65 | 24.78 | 263.19 | 793.52 |
| Change rate (%) | 6.42 | -11.19 | -15.54 | -0.66 | 3.05 |
Table 3 Changes in the landscape pattern index from 1990 to 2013 |
| Land type | Year | Total class area | Percentage of landscape | Number of patches | Patch density | Edge Density |
|---|---|---|---|---|---|---|
| Cultivated land | 1990 | 4151868 | 53.3201 | 572 | 0.0073 | 4.0166 |
| 2000 | 4111100 | 52.7859 | 595 | 0.0076 | 4.1041 | |
| 2013 | 4070920 | 52.2437 | 602 | 0.0077 | 4.0104 | |
| Construction land | 1990 | 413168 | 5.3061 | 1247 | 0.0160 | 1.2841 |
| 2000 | 452760 | 5.8134 | 1309 | 0.0168 | 1.4016 | |
| 2013 | 493332 | 6.3311 | 1203 | 0.0154 | 1.3274 | |
| Forest land | 1990 | 2115036 | 27.1622 | 499 | 0.0064 | 2.5977 |
| 2000 | 2110724 | 27.1014 | 490 | 0.0063 | 2.6212 | |
| 2013 | 2587396 | 33.2051 | 378 | 0.0049 | 2.4083 | |
| Water area | 1990 | 537628 | 6.9045 | 531 | 0.0068 | 0.8846 |
| 2000 | 537824 | 6.9056 | 532 | 0.0068 | 0.8849 | |
| 2013 | 630728 | 8.0944 | 902 | 0.0116 | 1.2151 | |
| Grassland | 1990 | 568792 | 7.3047 | 711 | 0.0091 | 1.2722 |
| 2000 | 575652 | 7.3913 | 723 | 0.0093 | 1.2923 | |
| 2013 | 2744 | 0.0352 | 9 | 0.0001 | 0.0090 |
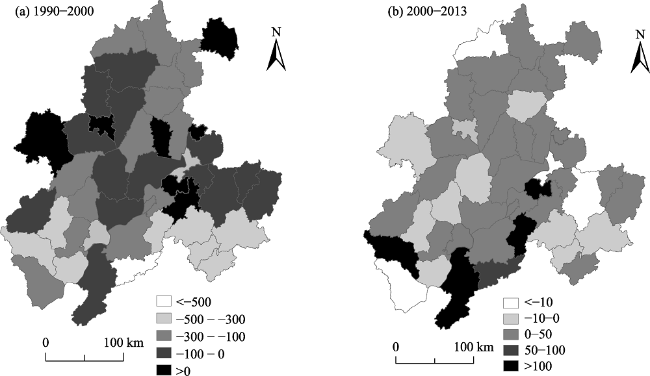
Fig. 3 Changes in per capita eco-assets in the study area from 1990 to 2013 |
The authors have declared that no competing interests exist.
| [1] |
|
| [2] |
|
| [3] |
|
| [4] |
|
| [5] |
|
| [6] |
|
| [7] |
|
| [8] |
|
| [9] |
|
| [10] |
|
| [11] |
|
| [12] |
|
| [13] |
|
| [14] |
|
| [15] |
|
| [16] |
|
| [17] |
|
| [18] |
|
| [19] |
|
| [20] |
|
| [21] |
|
| [22] |
|
| [23] |
|
/
| 〈 |
|
〉 |