
Journal of Resources and Ecology >
Temporal Variations and Driving Factors of Cultivated Land Use Intensity in Shandong Province from 1980 to 2015
*First author: LI Zijun, lizijun@sdnu.edu.cn
Received date: 2018-11-02
Accepted date: 2019-02-18
Online published: 2019-05-30
Supported by
Humanities and Social Sciences Research and Planning Fund of Ministry of Education of China (17YJAZH050)
National Natural Science Foundation of China (41101079).
Copyright
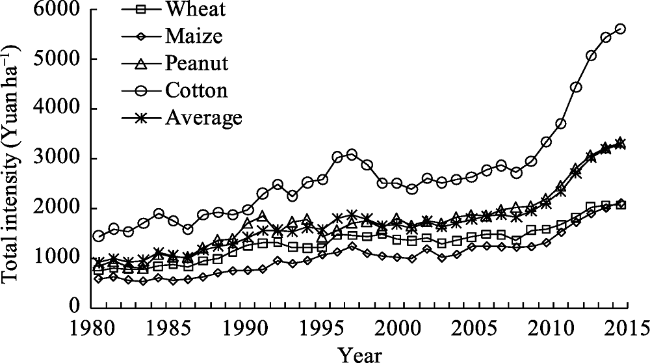
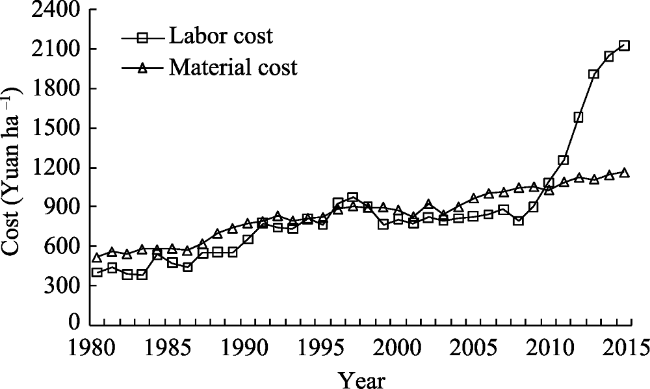
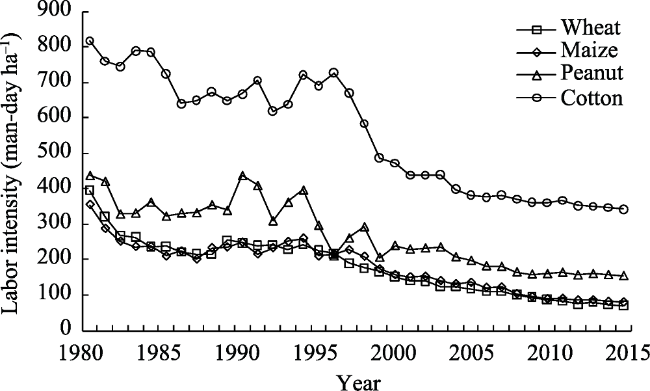
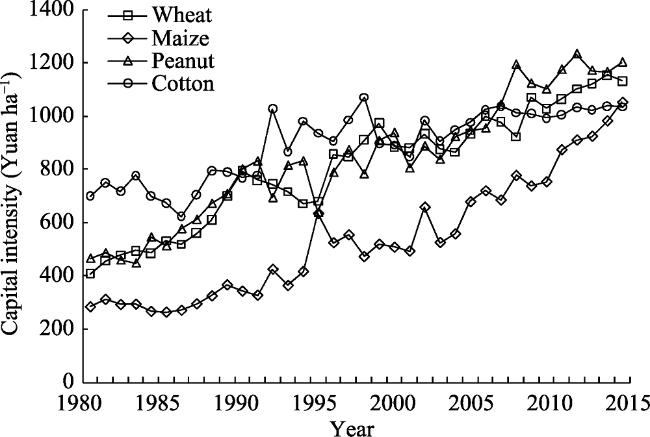
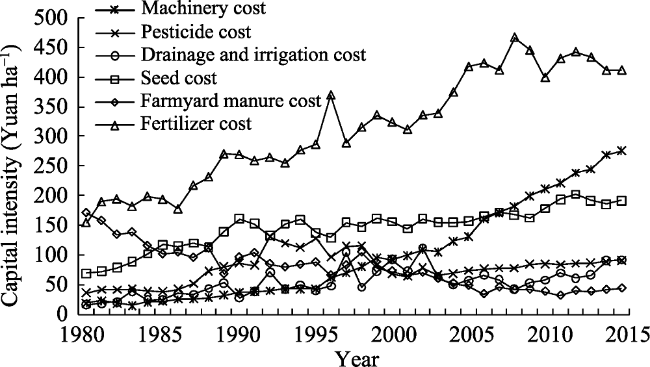
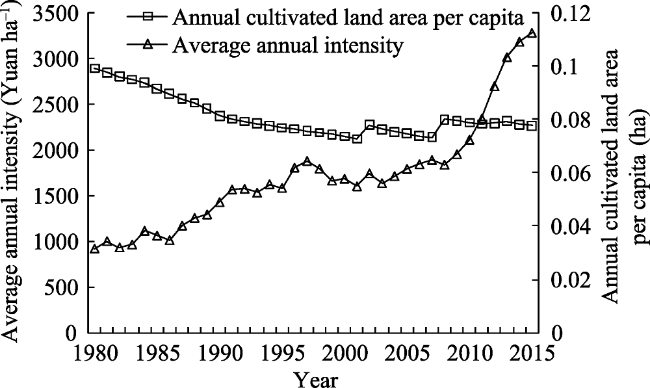
Based on the cost-income data of agricultural products and relevant statistical data, taking major grain crops and economic crops in the process of cultivated land use as study cases, we studied characteristics of the temporal variation of cultivated land use intensity and its composition in Shandong Province from 1980 to 2015, and then analyzed its main driving factors. The results showed that: (1) The total intensity of major crops in Shandong Province showed a rising trend from 919.73 Yuan ha-1 in 1980 to 3285.06 Yuan ha-1 in 2015, and the average annual intensity of economic crops was higher than that of grain crops. The labor cost and material cost of major crops both showed an increasing trend, but the material input was much higher than labor input for grain crops, while the labor input was much higher than material input for economic crops. (2) The labor intensity of major crops in Shandong Province showed a decreasing trend from 501.75 man-day ha-1 in 1980 to 161.93 man-day ha-1 in 2015. The labor intensity of grain crops was lower than that of economic crops and its decline rate was fast. On the contrary, the capital intensity showed an increasing trend from 518.33 Yuan ha-1 in 1980 to 1159.95 Yuan ha-1 in 2015. In the internal composition of capital intensity, the proportion of yield-increasing inputs such as seed, farmyard manure, fertilizer, pesticide and drainage and irrigation decreased gradually, while the proportion of labor-saving inputs such as agricultural machinery increased significantly. (3) The cultivated land use intensity in Shandong Province had significant negative correlations with the amount of agricultural labor and cultivated land area per capita. The primary direct driving factor was the net income per unit cost of major crops, but the time response lagged by 1-3 years. The main indirect driving factor was the reform of agricultural policy.
LI Zijun , YU Yuanhe , JIANG Aixia . Temporal Variations and Driving Factors of Cultivated Land Use Intensity in Shandong Province from 1980 to 2015[J]. Journal of Resources and Ecology, 2019 , 10(3) : 265 -274 . DOI: 10.5814/j.issn.1674-764X.2019.03.004
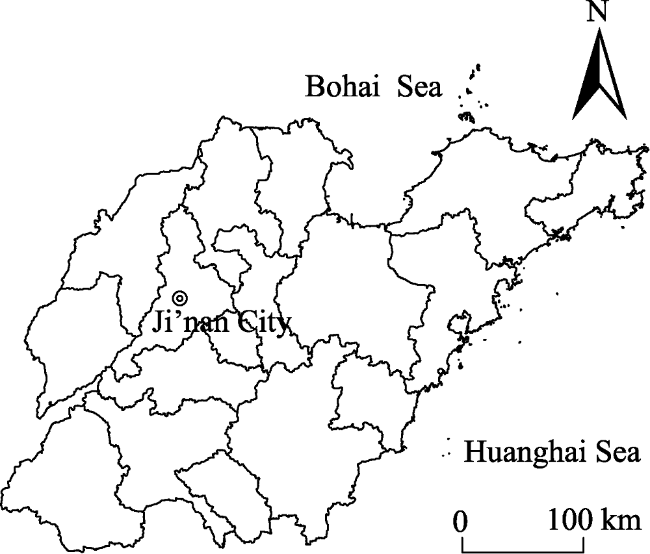
Fig. 1 The location of Shandong Province |
Fig. 2 Variations in total intensity for four major crops in Shandong Province from 1980 to 2015 |
Fig. 3 Cost variations averaged for the four major crops in Shandong Province from 1980 to 2015 |
Fig. 4 Labor intensity variations of the four major crops in Shandong Province from 1980 to 2015 |
Fig. 5 Capital intensity variations of the four major crops in Shandong Province from 1980 to 2015 |
Fig. 6 Capital intensity structure variations for major crops in Shandong Province from 1980 to 2015 |
Table 1 Annual change and average annual changing rates of capital inputs for the main crops in Shandong Province from 1980 to 2015 |
| Capital input type | Annual change during 1980-2015 (Yuan yr-1) | Annual change during 1980-1995 (Yuan yr-1) | Annual change during 1996-2015 (Yuan yr-1) | Average annual changing rate (%) |
|---|---|---|---|---|
| Seed cost | 3.41 | 4.29 | 3.11 | 2.97 |
| Farmyard manure cost | -3.53 | -5.20 | -1.10 | -3.83 |
| Fertilizer cost | 7.14 | 8.25 | 2.10 | 2.84 |
| Pesticide cost | 1.54 | 5.76 | -0.25 | 2.70 |
| Machinery cost | 7.14 | 1.51 | 10.71 | 8.03 |
| Drainage and irrigation cost | 2.10 | 1.53 | 2.22 | 5.09 |
Table 2 Correlation coefficients between the average net incomes from tax reduction per unit cost and the average annual intensities of four major crops in Shandong Province from 1980 to 2015 |
| Period | Correlation coefficients (Rg) between the net income per unit cost of grain crops (Pg) and the average annual intensity (Ig) | Correlation coefficients (Re) between the net income per unit cost of economic crops (Pe) and the average annual intensity (Ie) | ||||||
|---|---|---|---|---|---|---|---|---|
| Ig and Pg at the same time | Ig lag Pg for one year | Ig lag Pg for two years | Ig lag Pg for three years | Ie and Pe at the same time | Ie lag Pe for one year | Ie lag Pe for two years | Ie lag Pe for three years | |
| 1980-1988 | 0.63 | 0.75 | 0.81 | 0.78 | -0.04 | 0.21 | -0.09 | -0.08 |
| 1989-1997 | 0.45 | 0.58 | 0.74 | 0.52 | 0.32 | 0.54 | 0.71 | 0.37 |
| 1998-2006 | 0.65 | 0.88 | 0.79 | 0.74 | 0.57 | 0.73 | 0.96 | 0.78 |
| 2007-2015 | -0.31 | -0.14 | -0.25 | -0.04 | -0.49 | -0.26 | -0.11 | 0.15 |
Fig. 7 Variations of annual cultivated land area per capita and average annual intensity for the four major crops in Shandong Province from 1980 to 2015 |
The authors have declared that no competing interests exist.
| [1] |
|
| [2] |
|
| [3] |
|
| [4] |
|
| [5] |
|
| [6] |
|
| [7] |
|
| [8] |
|
| [9] |
|
| [10] |
|
| [11] |
|
| [12] |
|
| [13] |
|
| [14] |
|
| [15] |
|
| [16] |
|
| [17] |
|
| [18] |
|
| [19] |
|
| [20] |
|
| [21] |
|
| [22] |
|
| [23] |
|
| [24] |
|
| [25] |
|
| [26] |
|
| [27] |
|
| [28] |
|
| [29] |
|
| [30] |
|
| [31] |
|
| [32] |
|
| [33] |
|
| [34] |
|
| [35] |
|
/
| 〈 |
|
〉 |