Ecosystem Monitoring and Service

Review of Methods to Quantify Trade-offs among Ecosystem Services and Future Model Developments

  • WU Baiqiu 1, 2 ,
  • WANG Junbang , 2, 3, * ,
  • QI Shuhua 1 ,
  • WANG Shaoqiang 2, 4 ,
  • LI Yingnian 3
Expand
  • 1. School of Geography and Environment, Jiangxi Normal University, Nanchang 330022, China
  • 2. Key Laboratory of Ecosystem Network Observation and Modeling, Institute of Geographic Sciences and Natural Resources, Chinese Academy of Science, Beijing 100101, China
  • 3. Northwest Institute of Plateau Biology, Chinese Academy of Sciences, Xining 810001, China
  • 4. School of Geography and Information Engineering, China University of Geosciences, Wuhan 430074, China
*Corresponding author: WANG Junbang, E-mail:

Received date: 2018-11-05

  Accepted date: 2019-01-15

  Online published: 2019-03-30

Supported by

National Key Research and Development Program of China (2017YFC0503803)

National Natural Science Foundation of China (41867012)

Qinghai Province Science and Technology Basic Condition Platform Construction Special Project (2018-ZJ-T09).

Copyright

All rights reserved

Abstract

Ecosystem services are spatially heterogeneous and temporal variability, which results in trade-offs, synergies and neutrality. The trade-off is a key problem in ecosystem management and requires optimized decision-making research. This paper reviews methods for identifying trade-offs and suggest future model developments. We conclude that (1) ecosystem service assessment depends on quantitative indicators and its modeling; (2) scenario analysis, multi-objective analysis and production possibility boundary are an effective means of ecosystem service trade-off decision-making; (3) future research needs to strengthen ecosystem service supply and demand flow and assist decision-making ecosystem mapping. Finally, integrated models should be developed to simulate and diagnose different scenarios and to optimize measures in land and ecosystem management for sustainability.

Cite this article

WU Baiqiu , WANG Junbang , QI Shuhua , WANG Shaoqiang , LI Yingnian . Review of Methods to Quantify Trade-offs among Ecosystem Services and Future Model Developments[J]. Journal of Resources and Ecology, 2019 , 10(2) : 225 -233 . DOI: 10.5814/j.issn.1674-764X.2019.02.013

1 Introduction

Ecosystem services are the benefits that humans derive directly or indirectly from ecosystems and they have an important impact on human survival, development and well- being (Daily et al., 2009; Millennium Ecosystem Assesment, 2005). Ecosystem services are diverse and include clean water supply, erosion control, food provision, climate regulation, recreation and scenic beauty (Daily et al., 1997). The different needs of human beings and the complexity and diversity of ecosystem services form the interaction between ecosystem service functions, that is, the relation of trade-off, simultaneous growth and irrelevance (Bohensky et al., 2006; Rodriguez et al., 2006). As a key problem in natural resource management, trade-offs were first considered in optimized decision-making literature in the 1990s (Grasso, 1998; Schaberg et al., 1999) and is becoming one of the most pressing areas for sustainability research (Cazalis et al., 2018; Renard et al., 2015; Zhou et al., 2018).
Trade-off among ecosystem services is an essential and fundamental character of ecosystems and occur on spatial and temporal scale (Bennett and Balvanera, 2007; Farber et al., 2002; Groot et al., 2010; Maes et al., 2012; Millennium Ecosystem Assesment, 2005; Nelson et al., 2009; Rodriguez, et al., 2006; Van Jaarsveld et al., 2005). Understanding synergies and trade-offs among ESs is essential for the better management of multi-functional ecosystems and diminishing costly trade-offs.
The various methods considering trade-offs and synergies have been developed over the past decade to support decision-making by modeling, mapping and quantifying ecosystem services. Statistical and computational methods, statistical clustering methods and the ecosystem service process-based model have been widely applied and the choice of methods used to identify ecosystem service relationships may influence observed directions (Cord et al., 2017). Various methods were developed and applied to explore the mechanism underlying the ecosystem service at different spatial and temporal scales in order to quantify and understand trade-offs and synergies among ESs over the past decade (Li and Lü, 2018). To integrate ecosystem service assessment into decision-making processes, systematically comparing and examining different methods focused on trade-offs and synergies are especially essential and important. This paper, therefore, was organized to review: 1) methods to measure ecosystem services; 2) methods to identify trade-offs; and 3) methods of policy-making. We aimed to promote the application of ecosystem service trade-offs and synergy concepts and to make ecosystem management policy more comprehensive, objective and scientific.

2 Methods to measure ecosystem service assessment

Measuring ecosystem services is a prerequisite and foundation to identify trade-off or synergy among ecosystem services and to make policy (Fu and Forsius, 2015; Fu and Yu, 2016; Groot et al., 2010). The steps to measure ecosystem services generally include defining the index system to describe the targeted ecosystem services, energy conversion, and biophysical modeling.

2.1 Index system for ecosystem services assessment

The first step is to establish an index system based on convertibility and operationally that comprehensively describes and assesses ecosystem services from the ecosystem structure, fundamental functions and habitat status for key species (Fu et al., 2017; Liu et al., 2009). Some criteria to choose an index are: 1) the concept framework integrated ecosystem service, social sustainability and human-wellbeing, such as Millennium Ecosystem Assessment (Millennium Ecosystem Assesment, 2005) or ecosystem service valuing (Costanza et al., 1997); 2) Materiality principle in ecosystem services, which, however, is generally dependent on the stakeholder; and 3) sustainability and fairness (the most important criteria).

2.2 Data acquisition for index system

Data acquisition for the index system is observed on the ground for small spatial scales and generally through satellite remote sensing at larger spatial scales (Liu, et al., 2009). The on-ground data provides direct data for ecosystem service assessment, parameterization and parameters optimization of ecosystem process models, and as validation data dependent on long-term observations from enough sites spatially distributed and represented for a given heterogeneous landscape (Yu et al., 2018). Remote sensing is increasingly applied in ecosystem service monitoring for repeatedly visiting biweekly, with pixel sizes from ~1 m to 1000 m, and various spectral bands from passive multispectral, hyperspectral and thermal technology, to SAR and LiDAR (Wang et al., 2016; Yang et al., 2015).
However, in application, the two problems to consider are scale match and quality control. For example, the above-ground biomass of grassland is always sampled from a field plot with a size of 0.5m × 0.5m, while the pixel size of Landsat is 30 m. Therefore, the scale match problem between plot-based biomass and Landsat-based NDVI should be considered and the cycle sample method would be a good choice for this problem (Wang et al., 2009). Data quality is a fundamental problem in remote sensing because of significant missing data due to unfavorable atmospheric conditions such as clouds and heavy aerosols. There are many methods for quality control and the adaptive Savitzky-Golay method in TIMESAT software (Jonsson and Eklundh, 2004) is useful for time series data (Wang et al., 2017).

2.3 Ecosystem service modeling tools

Ecosystem service modeling has been increasing in number, diversity and application over the past decade (Li and Lü, 2018). Although each model would output and map the same quantitative serveries and could be applied in different contexts and scales from local to national, they are generally built through different approaches according to different assumptions (Sharps et al., 2017). Those models can be classified as static or dynamic. Static models include SolVES (Brown and Brabyn, 2012), EcoAIM, Matrix, InFOREST and EPM; dynamic models are MIMES (Boumans et al., 2015), ARIES, SAORES (Hu et al., 2015) and InVEST (Fig. 1). Many publications review and compare those models (Sharps et al., 2017) and here we have focused on the InVEST model.
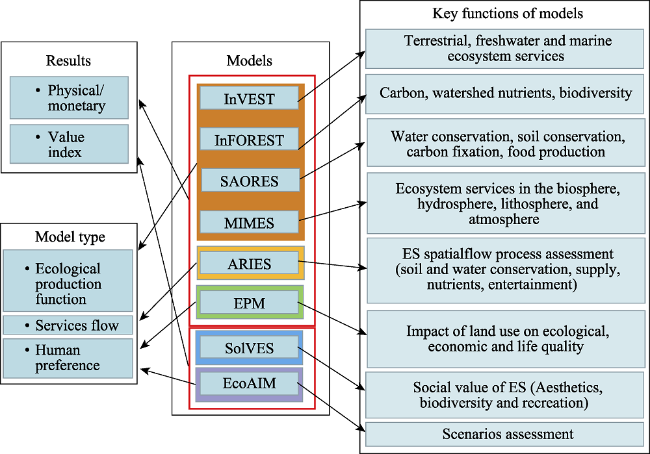
Fig. 1 The models used for ecosystem services assessment
Because of an excellent ability to evaluate process-based ecosystem services combined with service cluster analysis and impact analysis, the InVEST model is more widely used than others (Bottalico et al., 2016; He et al., 2017; Li et al., 2013; Yang et al., 2018a). The InVEST model integrates multiple ecological process models and forms a variety of evaluation grinding. It has matured and has been widely used in related research in 20 countries and regions across America, Africa and Asia; other models are mostly at earlier stages with limitations and deficiencies. Most models lack the evaluation modules for supporting and regulating services, simulation modules of ecosystem services and the assessment modules of uncertainty. It is necessary to further enhance models to simulate and predict ecosystem service changes through a multi-scale and multi-regional integrated ecosystem service assessment model. The choice of tool, however, depends on the study question for each has unique features and strengths though the modeling tools provide broadly comparable quantitative outputs.

3 Methods to identify trade-off

The methods for analyzing trade-offs and synergies include threshold analysis (Viglizzo and Frank, 2006), extreme value analysis, multi-objective analysis, model analysis (Haines-Young et al., 2012), and the newly developed root mean square deviation, trade-off coordination model (Fig. 2). The methods to identify trade-off were classified to three catalogs (Yang et al., 2018): service cluster analysis based on statistical clustering theory, impact analysis of iterations based on relational matrices, and process-based ecosystem service models that integrate changes in ecosystem processes with an assessment of ecosystem services and management.
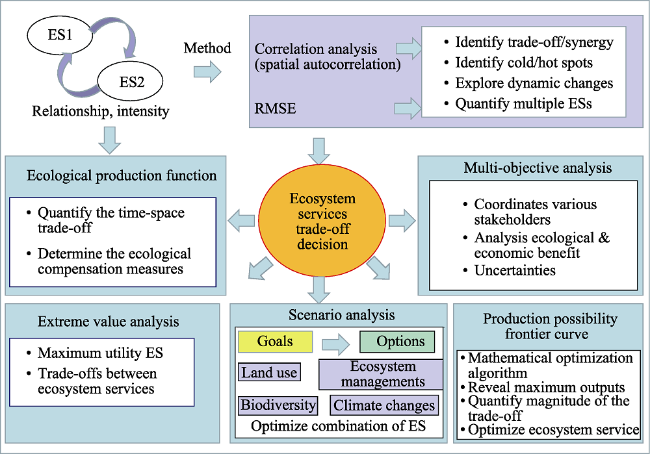
Fig. 2 Methods used for trade-off and synergy analysis

3.1 Correlation analysis

Correlation analysis is used to determine the relationship between services by the correlation coefficient between the physical measures of ecosystem services. A positive correlation is defined as a synergistic relationship and a negative correlation as a trade-off relationship. Recently, correlation analysis was combined with spatial mapping by applying geographic information system (GIS) tools (Maes et al., 2012; Maskell et al., 2013) and spatial autocorrelation analysis was used to identify cold or hot spots of ecosystem services and to map ecosystem services (Han et al., 2016). A linear or nonlinear fitting for the correlation coefficient was applied to explore dynamic changes in trade-offs or synergies (Hao et al., 2017).
Ecosystem service clusters analysis is a hot topic now and considers a group of services, termed services clusters or service build, with similar properties or trade-off or synergy (Haines-Young et al., 2012). Cluster analysis using spatial mapping was applied to diagnose and identify trade-offs or synergies of ecosystem service clusters aimed to propose a reasonable ecological zone and effective management (Haines-Young et al., 2012; Raudsepp-Hearne et al., 2010)

3.2 Root mean square deviation methods

Though the correlation coefficient method directly reflects the relationship of trade-off or synergy among ecosystem services, it cannot reflect the internal mechanism and mutual influence of ecological services and cannot completely express the synergy of each ecological service. The root mean square deviation or error method is considered a simple and effective method to quantify the trade-off relationship between multiple ecosystem services (Feng et al., 2017). That is, extending the meaning of trade-offs, the standard deviation method not only characterizes negative correlations, but also includes imbalances between different ecosystem services on the same change direction (Fu et al., 2014) and represents the distance from the “1:1 line” representing equal benefits. This is a simple but effective representation of the trade-off between any two or more ecosystem services, and no longer concerns how ecosystem services are related. But, it requires large amounts of measured value data, is unsuitable for analyzing data produced by evaluation models, and the “1:1 line” that represents equal benefits may not represent the optimal trade-off (Feng et al., 2017).
Xue (2013) defined a trade-off strength coefficient (TI) that equals the ratio of the rate of change of a service to the rate of change of a target service. This approach can be used to evaluate the sensitivity of the change in a service value with respect to changes in the target service. Unfortunately, the same TI value may correspond to different combinations of ecosystem services, which may make it an ineffective indicator of trade-offs when the goal is to find the optimal combination.

3.3 Multi-objective analysis

The complexity of ecosystems leads to complex interactions between ecosystem services, coupled with the continuous expansion of human needs, which determines the need for multi-objective trade-offs in ecosystem management and the pursuit of overall optimization of ecosystem services (Lin et al., 2012). Multi-objective analysis is a tool that takes into account ecological and socio-economic indicators, mainly applying ecological economic analysis (Falloon and Betts, 2010; Huang et al., 2011). In recent years it has been widely used to solve problems in ecosystem service management to explore the trade-off between ecological protection and socio-economic goals (Cheung and Sumaila, 2008; Nelson et al., 2009).
Combined with GIS and multi-criteria analysis, Nguyen et al. (2015) proposed a spatial multi-criteria analysis to analyze targets affected by spatial distribution factors. In general, multi-objective analysis is a planning design that coordinates various stakeholders and determines maximum benefit (Nguyen et al., 2015). This method requires multi- participation and needs to further improve fairness in the decision-making process (Sanon et al., 2012). Multi-objective analysis, however, has uncertainties in decision-making due to target setting and weight distribution, greatly impacting optimization results (Schwenk et al., 2012).

3.4 Analysis based on production theory

The Cobb and Douglas production function hypothesized output (production) as a function of inputs (labor and capital) and is the most widely used to describe production theory (Chisasa and Makina, 2013). The ecological production function is an important method to study the marginal influence of ecosystem characteristics on the final service of an ecosystem (de Groot et al., 2010). The eco-production function can determine the mathematical relationship between ecosystem explanatory variables (structure, process, function) and response variables (ecosystem final service) through biophysical and statistical methods, and then quantify the time-space trade-off relationship of the ecosystem's final service and its marginal response characteristics of changes in ecological characteristics. In ecosystem services, not all ecosystem services can be delivered to people in the greatest extent. In the decision-making around ecosystem services, the final service of the ecosystem is determined. For example, this method was applied to determine ecological compensation measures in the restoration of vegetation on the Loess Plateau (Feng et al., 2017). This study analyzed the marginal benefits of the natural and environmental factors to control soil erosion and increase carbon sequestration by balancing trade-off among ecosystem services.
To solve multi-input and multi-output production functions, Pato’s efficiency curve has become a popular method. Pato's efficiency curve, that is possibility boundary of production, is an effective approach to explore biophysical constraints and limitations in multiple ecosystem services (Yang et al., 2018). The optimal management decision- making method was applied to determine the maximum net benefit of ecosystem service management by combining the results of different ecosystem scenarios in ecosystem service management decision-making (Nelson et al., 2009; Polasky et al., 2008).

3.5 Extreme value analysis

Extreme value analysis is based on the trade-off between ecosystem services and the process of maximizing the utility between ecological services (Lin et al., 2012), looking for rational coordination and utilization, and finding the most optimized and coordinated plan. At present, this method is widely used in water resource management. In the application of trade-offs between ecosystem services, such as research on changes in utilization of different biomass, seeking the maximum value between livestock supply and windbreak and sand-fixation (Rao et al., 2015). Under the premise of improving soil erosion, land improvement seeks the extreme value of grassland ecosystem value and farmland grain production value to maximize the sum of the two values (Lu et al., 2007). In addition, there is a threshold analysis method, through the functional relationship between ecosystem service functions, the conditions for the balanced development of the two are obtained. Viglizzo et al. (2006) introduced the concept of critical thresholds to analyze the trade-offs between service values between different ecosystem types in the Delta River Basin in southern Africa (Viglizzo and Frank, 2006). Li et al. (2006) used threshold analysis to analyze the trade-off relationship between the service value of wetland and cultivated land ecosystems in Sanjiang Plain, and sought the optimal combination to provide a theoretical basis for guiding wetland protection.

3.6 Scenario analysis

Scenario analysis reveals changes in ecosystem services under different development goals and provides a theoretical basis for policy decisions and regional ecosystem management (Lautenbach et al., 2013; Seppelt et al., 2013; Yang et al., 2018a). The key to this method is to define rational scenarios to analyze dynamic changes between various ecosystem services so as to seek the optimal combination of ecosystem services (Pang et al., 2017). The scenarios on land use, ecosystem management, biodiversity and climate change were defined and simulated to optimize land use patterns, strategies for achieving the sustainability of ecosystems (He et al., 2017; Sherrouse et al., 2017). But attention should paid to the rationality of the simulation scenario to improve the effectiveness of management decisions.

3.7 Production possibility frontier curve

As a basic economic concept, production possibility frontier curve (PPF) is an algorithm widely used to perform mathematical optimization to analyze multi-objective decisions (Kaim et al., 2018). PPF can reveal the maximum outputs of combinations of two resources that simultaneously use the same set of inputs, thereby quantitatively describing the magnitude of the trade-off between the two outputs (Smith et al., 2012). Spatial optimization was used to analyze alternative restoration scenarios and examine trade-offs based on PPFs for the relationships between selected restoration objectives (Ager et al., 2017). The PPF has been used in ecosystem service research to test trade-offs between ecosystem services to optimize trade-offs by using the slope between points on the curve to optimize ecosystem service function (Chen et al., 2018a; Chen et al., 2016; Law et al., 2017).
A correct understanding of the relationships between ecosystem services is a prerequisite for sustainable management of multiple ecosystem services and is conducive to the improvement of human well-being. More and more scholars have begun to study the trade-offs and synergies between ecosystem services based on the assessment method of continuous improvement of these services. Ecosystem service trade-off studies usually include spatial mapping and statistical analysis, where statistical analysis uses correlation analysis and local analysis (spatial autocorrelation), as well as new statistical models such as root mean square deviation. These methods are all studies on the trade-off relationship and degree of ecosystem services, and are also used to evaluate the increase and decline of the static supply capacity of ecosystem services. Multi-objective analysis, extreme analysis, scenario analysis and production possibility boundary are based on the degree of ecosystem dependence, and seek the optimal combination of ecosystem services. This provides a basis for integrated management and optimization of ecosystem services. Multi-objective analysis considers optimization among multiple stakeholders, extreme analysis, and production possibility boundary as equalization of seeking ecosystem services. Scenario analysis determines future ecosystem optimization and forecasts future ecosystem service changes under current development models.

4 Model developments in future

Each method solves one aspect of the problem and while integrated methods answer most problems they require further development (Uhde et al., 2015). Ecosystem services are tightly linked with human well-being, which occurs as trade-offs or synergies on the spatial scale from watershed to region and nation, and the longer time scale from day to annual to generation (Lee and Lautenbach, 2016). There are lots of methods and models focusing on trade-offs and synergies (Gret-Regamey et al., 2017; Kaim et al., 2018; Li and Lü, 2018; Turner et al., 2016; Uhde et al., 2015), as reviewed above, the development of ecosystem service models should consider the following: the flow of ecosystem services themselves; spatial heterogeneity; and projection prediction based on historic dynamic changes (Fig. 3).
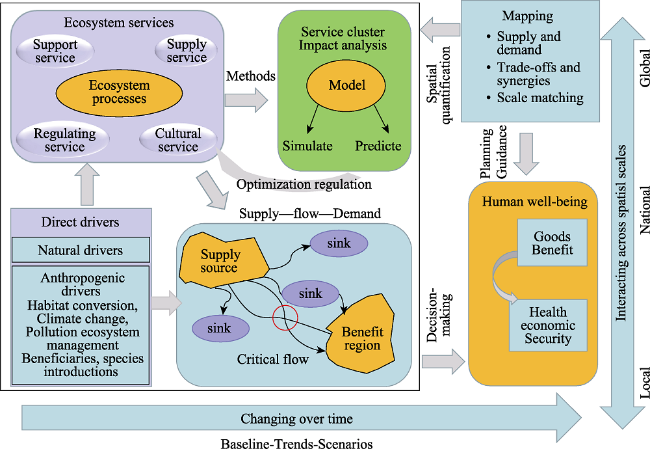
Fig. 3 Future ecosystem service research

4.1 Ecosystem service flows

The analysis of ecosystem service flow was conceptualized to analyze the spatial connections between ecosystem service provisioning and benefits (Serna-Chavez et al., 2014; Syrbe and Walz, 2012). The conceptualization and quantitative framework were developed to recognize hot supply, flow and demand spots of ecosystem services and maximize ecosystem service benefits in service formation, transportation and consumption (Liu et al., 2016; Serna-Chavez et al., 2014; Syrbe and Walz, 2012). More research, however, is needed to develop ecosystem service flow networks, improve service flow quantification and examine underlying mechanisms in complex socio-ecological systems (Goldenberg et al., 2017; Li et al., 2016; Pagella and Sinclair, 2014; Schirpke et al., 2018; Serna-Chavez, et al., 2014; Syrbe and Walz, 2012; Vrebos et al., 2015; Wei et al., 2017; Wolff et al., 2015).

4.2 Ecosystem service mapping

Ecosystem service mapping is one spatial explicitly way to improve decision-making and ecosystem management to better integrate environmental issues (Le Clec'h et al., 2018a). Though some ES indicators are directly mapped by remote sensing, most need to be interpolated and extrapolated and to consider the spatial scale of representation (Le Clec'h, et al., 2018a; Le Clec’h et al., 2018b; Scholte et al., 2018). Beyond visualizing methods, an important approach for decision-making is mapping the spatial distribution of ecosystem services and social benefits (Pueffel et al., 2018; Raum, 2018; Reilly et al., 2018; Wei et al., 2017). Analysis methods by ecosystem service mapping includes clarifying hot and cold spots (Li et al., 2017), livelihood benefit maps (Malmborg et al., 2018), environmental land use conflicts and land management scenario mapping (Kim and Arnhold, 2018). However, it faces a great challenge to integrate ecosystem service mapping in ecosystem service modeling for the complexities in ESs.

4.3 Dynamic changes and future projections

Land uses and ecosystem management have immediate impacts on ecosystem service and climate change has a lag-effect on ecosystem service (Kim et al., 2018). Therefore, current and future projections on land use and ecosystem management are essential elements for assessing ecosystem change (Bonan and Doney, 2018; Mina et al., 2017; Schuerch et al., 2018). Presently, scenarios of land use have been researched based on past land use changes to detect effects from ecosystem restoration (Butler et al., 2013; He et al., 2017; Thellmann et al., 2017; Wu et al., 2018). Projections of climate change is another hot field of research while considering land use change (Bagdon et al., 2017; Chen et al., 2018b; Fan et al., 2018; Mulwa et al., 2016). A critical issue is to develop models that enable projections of the development of different ecosystem services at a landscape level as a function of forest management (Pang et al., 2017), however, this must be based on the underlying mechanism analysis of ecosystem services and controls from climate change and human activities.

4.4 Ecosystem services and human well-being

Concern and consideration of ecosystem service are for human well-being ultimately. The latter is related to sociology and economics, therefore, ecosystem services are a problem in both ecology and economics. Ecosystem service studies in ecology seek the physical mechanisms of ecosystem processes and responses to environmental factors. When considering the influence of human activities, land cover and land use changes are quantified, but the influence of ecosystem utility and management less so. This omission makes analyses less accurate and prevents us from determining an optimized solution. A modular integrated model system should be developed by including multiple ecosystem services as a first step and coupling the natural process of ecosystems with the process of social-economics to diagnose and predict future ecosystems under global climate change.

The authors have declared that no competing interests exist.

[1]
Ager A A, Vogler K C, Day M A, et al.2017. Economic opportunities and trade-offs in collaborative forest landscape restoration.Ecological Economics, 136: 226-239.

[2]
Bagdon B A, Huang C-H, Dewhurst S, et al.2017. Climate change constrains the efficiency frontier when managing forests to reduce fire severity and maximize carbon storage.Ecological Economics, 140: 201-214.

[3]
Bennett E M, Balvanera P.2007. The future of production systems in a globalized world.Frontiers in Ecology and the Environment, 5(4): 191-198.

[4]
Bohensky E L, Reyers B, Van Jaarsveld A S.2006. Conservation in practice: future ecosystem services in a southern African river basin: a scenario planning approach to uncertainty.Conservation Biology, 20(4): 1051-1061.

[5]
Bonan G B, Doney S C.2018. Climate, ecosystems, and planetary futures: The challenge to predict life in Earth system models.Science, 359(6375): 533.

[6]
Bottalico F, Pesola L, Vizzarri M, et al.2016. Modeling the influence of alternative forest management scenarios on wood production and carbon storage: A case study in the Mediterranean region.Environmental Research, 144: 72-87.

[7]
Boumans R, Roman J, Altman I, et al.2015. The Multiscale Integrated Model of Ecosystem Services (MIMES): Simulating the interactions of coupled human and natural systems.Ecosystem services, 12: 30-41.

[8]
Brown G, Brabyn L.2012. The extrapolation of social landscape values to a national level in New Zealand using landscape character classification.Applied Geography, 35(1): 84-94.

[9]
Butler J R A, Wong G Y, Metcalfe D J, et al.2013. An analysis of trade-offs between multiple ecosystem services and stakeholders linked to land use and water quality management in the Great Barrier Reef, Australia.Agriculture Ecosystems & Environment, 180: 176-191.

[10]
Cazalis V, Loreau M, Henderson K.2018. Do we have to choose between feeding the human population and conserving nature? Modelling the global dependence of people on ecosystem services.Science of the Total Environment, 634: 1463-1474.

[11]
Chen D, Li J, Yang X, et al.2018a. Trade-offs and optimization among ecosystem services in the Weihe River basin.Acta Ecologica Sinica, 38(9): 3260-3271. (in Chinese)

[12]
Chen D S, Li J, Zhou Z X, et al.2018b. Simulating and mapping the spatial and seasonal effects of future climate and land -use changes on ecosystem services in the Yanhe watershed, China.Environmental Science and Pollution Research, 25(2): 1115-1131.

[13]
Chen S, Shahi C, Chen H Y H.2016. Economic and ecological trade-off analysis of forest ecosystems: options for boreal forests.Environmental Reviews, 24(3): 348-361.

[14]
Cheung W W, Sumaila U R.2008. Trade-offs between conservation and socio-economic objectives in managing a tropical marine ecosystem.Ecological economics, 66(1): 193-210.

[15]
Chisasa J, Makina D.2013. Bank credit and agricultural output in South Africa: A Cobb-Douglas empirical analysis.

[16]
Cord A F, Bartkowski B, Beckmann M, et al.2017. Towards systematic analyses of ecosystem service trade-offs and synergies: Main concepts, methods and the road ahead.Ecosystem Services, 28: 264-272.

[17]
Costanza R, d'Arge R, de Groot R, et al.1997. The value of the ecosystem services and natural capital.Nature, 387: 253-260.

[18]
Daily G C, Polasky S, Goldstein J, et al.2009. Ecosystem services in decision making: time to deliver.Frontiers in Ecology & the Environment, 7(1): 21-28.

[19]
de Groot R, Christie M, Aronson J.2010. Integrating the ecological and economic dimensions in biodiversity and ecosystem service valuation, doi:10.4324/9781849775489.

[20]
Falloon P, Betts R.2010. Climate impacts on European agriculture and water management in the context of adaptation and mitigation—the importance of an integrated approach.Science of the Total Environment, 408(23): 5667-5687.

[21]
Fan M, Shibata H, Chen L.2018. Assessing high impacts of climate change: spatial characteristics and relationships of hydrological ecosystem services in northern Japan (Teshio River watershed).Mitigation and Adaptation Strategies for Global Change, 23(4): 525-552.

[22]
Farber S C, Costanza R, Wilson M A.2002. Economic and ecological concepts for valuing ecosystem services.Ecological Economics, 41(3): 375-392.

[23]
Feng Q, Zhao W, Fu B, et al.2017. Ecosystem service trade-offs and their influencing factors: A case study in the Loess Plateau of China.Science of the Total Environment, 607: 1250-1263.

[24]
Fu B, Forsius M.2015. Ecosystem services modeling in contrasting landscapes.Landscape Ecology, 30(3): 375-379.

[25]
Fu B, Yu D.2016. Trade-off analyses and synthetic integrated method of multiple ecosystem services.Resources Science, 38(1): 1-9. (in Chinese)

[26]
Fu M, Tian J, Zhu Y, et al.2017. Identification of functional zones and methods of target management in Sanjiangyuan National Park.Biodiversity Science, 25(1): 71-79.

[27]
Goldenberg R, Kalantari Z, Cvetkovic V, et al.2017. Distinction, quantification and mapping of potential and realized supply-demand of flow- dependent ecosystem services. Sci Total Environ, 593-594: 599-609.

[28]
Grasso M.1998. Ecological-economic model for optimal mangrove trade off between forestry and fishery production: comparing a dynamic optimization and a simulation model.Ecological Modelling, 112(2-3): 131-150.

[29]
Gret-Regamey A, Siren E, Brunner S H, et al.2017. Review of decision support tools to operationalize the ecosystem services concept.Ecosystem Services, 26: 306-315.

[30]
Groot R S d, Fisher B, Christie M, et al. 2010.Integrating the ecological and economic dimensions in biodiversity and ecosystem service valuation. In: Kumar P. The Economics of Ecosystems and Biodiversity (TEEB): Ecological and Economic Foundations. London: Earthscan Press.

[31]
Haines-Young R, Potschin M, Kienast F.2012. Indicators of ecosystem service potential at European scales: mapping marginal changes and trade-offs.Ecological Indicators, 21: 39-53.

[32]
Han W.2016. Xi'an metropolitan area agricultural ecosystem service trade- off and synergy relationship and its driving force. Shaanxi Normal University. (in Chinese)

[33]
Hao M Y, Ren Z Y, Sun Y J, et al. 2017.Dynamic analysis of trade-offs and synergies between ecosystem services in Guanzhong Basin.Geography Research, 36(3): 592-602. (in Chinese)

[34]
He J, Huang J, Li C.2017. The evaluation for the impact of land use change on habitat quality: A joint contribution of cellular automata scenario simulation and habitat quality assessment model.Ecological Modelling, 366: 58-67.

[35]
Hu H T, Fu B J, Lü Y H, et al.2015. SAORES: A spatially explicit assessment and optimization tool for regional ecosystem services. Landscape Ecology, 30(3): 547-560.

[36]
Huang I B, Keisler J, Linkov I.2011. Multi-criteria decision analysis in environmental sciences: Ten years of applications and trends.Science of the Total Environment, 409(19): 3578-3594.

[37]
Jonsson P, Eklundh L.2004. TIMESAT-a program for analyzing time- series of satellite sensor data.Computers & Geosciences, 30(8): 833-845.

[38]
Kaim A, Cord A F, Volk M.2018. A review of multi-criteria optimization techniques for agricultural land use allocation.Environmental Modelling & Software, 105: 79-93.

[39]
Kim H, Rosa I M D, Alkemade R, et al.2018. A protocol for an intercomparison of biodiversity and ecosystem services models using harmonized land-use and climate scenarios. bioRxiv, 10.1101/300632.

[40]
Kim I, Arnhold S.2018. Mapping environmental land use conflict potentials and ecosystem services in agricultural watersheds.Science of the Total Environment, 630: 827-838.

[41]
Lautenbach S, Volk M, Strauch M, et al.2013. Optimization-based trade- off analysis of biodiesel crop production for managing an agricultural catchment.Environmental Modelling & Software, 48: 98-112.

[42]
Law E A, Bryan B A, Meijaard E, et al.2017. Mixed policies give more options in multifunctional tropical forest landscapes.Journal of Applied Ecology, 54(1): 51-60.

[43]
Le Clec'h S, Jegou N, Decaens T, et al.2018a. From field data to ecosystem services maps: using regressions for the case of deforested areas within the Amazon.Ecosystems, 21(2): 216-236.

[44]
Le Clec'h S, Sloan S, Gond V, et al.2018b. Mapping ecosystem services at the regional scale: the validity of an upscaling approach.International Journal of Geographical Information Science, 32(8): 1593-1610.

[45]
Lee H, Lautenbach S.2016. A quantitative review of relationships between ecosystem services.Ecological Indicators, 66: 340-351.

[46]
Li J, Jiang H, Bai Y, et al.2016. Indicators for spatial-temporal comparisons of ecosystem service status between regions: A case study of the Taihu River Basin, China.Ecological Indicators, 60: 1008-1016.

[47]
Li T, Y.2018. A review on the progress of modeling techniques in ecosystem services.Acta Ecologica Sinica, 38(15): 5287-5296. (in Chinese)

[48]
Li Y C, Liu C M,Yu J J.2006. The balance of wetland protection and cultivated land reclamation in sanjiang plain.Journal of Beijing Forestry University, 28(1): 39-42. (in Chinese)

[49]
Li Y, Luo Y, Liu G, et al.2013. Effects of land use change on ecosystem services: a case study in Miyun reservoir watershed.Acta Ecologica Sinica, 33(3): 726-736. (in Chinese)

[50]
Li Y, Zhang L, Yan J, et al.2017. Mapping the hotspots and coldspots of ecosystem services in conservation priority setting.Journal of Geographical Sciences, 27(6): 681-696. (in Chinese)

[51]
Lin Q.2012. Research on the method of grassland ecosystem service trade-off. Beijing Forestry University. (in Chinese)

[52]
Liu H, Fan Y, Shengyan D.2016. Research progress of ecosystem service flow.Chinese Journal of Applied Ecology, 27(7): 2161-2171. (in Chinese)

[53]
Liu J, Shao Q, Fan J.2009. The integrated assessment indicator system of grassland ecosystem in the Three-River Headwaters region.Geographical Research, 28(2): 273-283. (in Chinese)

[54]
Lu C H; Cheng L.2007. Conflicts between land use change and ecological service functions.Arid Zone Research, 24(3): 302-306. (in Chinese)

[55]
Maes J, Paracchini M, Zulian G, et al.2012. Synergies and trade-offs between ecosystem service supply, biodiversity, and habitat conservation status in Europe.Biological Conservation, 155: 1-12.

[56]
Malmborg K, Sinare H, Kautsky E E, et al.2018. Mapping regional livelihood benefits from local ecosystem services assessments in rural Sahel. Plos One, 13(2).

[57]
Maskell L C, Crowe A, Dunbar M J, et al.2013. Exploring the ecological constraints to multiple ecosystem service delivery and biodiversity.Journal of Applied Ecology, 50(3): 561-571.

[58]
Millennium Ecosystem Assesment.2005. Ecosystems and Human Well-Being: Synthesis.Washington D C:Island Press.

[59]
Mina M, Bugmann H, Cordonnier T, et al.2017. Future ecosystem services from European mountain forests under climate change.Journal of Applied Ecology, 54(2): 389-401.

[60]
Mulwa R, Rao K P C, Gummadi S, et al.2016. Impacts of climate change on agricultural household welfare in Kenya.Climate Research, 67(2): 87-97.

[61]
Nelson E, Mendoza G, Regetz J, et al.2009. Modeling multiple ecosystem services, biodiversity conservation, commodity production, and tradeoffs at landscape scales.Frontiers in Ecology and the Environment, 7(1): 4-11.

[62]
Nguyen T T, Verdoodt A, Van Y T, et al.2015. Design of a GIS and multi-criteria based land evaluation procedure for sustainable land-use planning at the regional level.Agriculture, Ecosystems & Environment, 200: 1-11.

[63]
Pagella T F, Sinclair F L.2014. Development and use of a typology of mapping tools to assess their fitness for supporting management of ecosystem service provision.Landscape Ecology, 29(3): 383-399.

[64]
Pang X, Nordström E-M, Böttcher H, et al.2017. Trade-offs and synergies among ecosystem services under different forest management scenarios-The LEcA tool.Ecosystem Services, 28: 67-79.

[65]
Polasky S, Nelson E, Camm J, et al.2008. Where to put things? Spatial land management to sustain biodiversity and economic returns.Biological Conservation, 141(6): 1505-1524.

[66]
Pueffel C, Haase D, Priess J A.2018. Mapping ecosystem services on brownfields in Leipzig, Germany.Ecosystem Services, 30: 73-85.

[67]
Rao S, Lin Q, Wang X H, et al.2015. Zhenglan Banner grassland ecosystem servicetrade-off research. Journal of Arid Land Resources and Environment, 29(3): 81-86. (in Chinese)

[68]
Raudsepp-Hearne C, Peterson G D, Bennett E.2010. Ecosystem service bundles for analyzing tradeoffs in diverse landscapes.Proceedings of the National Academy of Sciences, 107(11): 5242-5247.

[69]
Raum S.2018. A framework for integrating systematic stakeholder analysis in ecosystem services research: Stakeholder mapping for forest ecosystem services in the UK.Ecosystem Services, 29: 170-184.

[70]
Reilly K, Adamowski J, John K.2018. Participatory mapping of ecosystem services to understand stakeholders' perceptions of the future of the Mactaquac Dam, Canada.Ecosystem Services, 30: 107-123.

[71]
Renard D, Rhemtulla J M, Bennett E M.2015. Historical dynamics in ecosystem service bundles.Proceedings of the National Academy of Sciences of the United States of America, 112(43): 13411-13416.

[72]
Rodriguez J P, Beard T D, Jr., Bennett E M, et al.2006. Trade-offs across space, time, and ecosystem services. Ecology and Society, 11(1).

[73]
Sanon S, Hein T, Douven W, et al.2012. Quantifying ecosystem service trade-offs: The case of an urban floodplain in Vienna, Austria.Journal of Environmental Management, 111: 159-172.

[74]
Schaberg R H, Holmes T P, Lee K J, et al.1999. Ascribing value to ecological processes: an economic view of environmental change.Forest Ecology and Management, 114(2-3): 329-338.

[75]
Schirpke U, Candiago S, Egarter Vigl L, et al.2018. Integrating supply, flow and demand to enhance the understanding of interactions among multiple ecosystem services.The Science of the Total Environment, 651(Pt 1): 928-941.

[76]
Scholte S S K, Daams M, Farjon H, et al.2018. Mapping recreation as an ecosystem service: Considering scale, interregional differences and the influence of physical attributes.Landscape and Urban Planning, 175: 149-160.

[77]
Schuerch M, Spencer T, Temmerman S, et al.2018. Future response of global coastal wetlands to sea-level rise.Nature, 561: 231-234.

[78]
Schwenk W S, Donovan T M, Keeton W S, et al.2012. Carbon storage, timber production, and biodiversity: Comparing ecosystem services with multi-criteria decision analysis.Ecological Applications, 22(5): 1612-1627.

[79]
Seppelt R, Lautenbach S, Volk M.2013. Identifying trade-offs between ecosystem services, land use, and biodiversity: A plea for combining scenario analysis and optimization on different spatial scales.Current Opinion in Environmental Sustainability, 5(5): 458-463.

[80]
Serna-Chavez H M, Schulp C J E, van Bodegom P M, et al.2014. A quantitative framework for assessing spatial flows of ecosystem services.Ecological Indicators, 39: 24-33.

[81]
Sharps K, Masante D, Thomas A, et al.2017. Comparing strengths and weaknesses of three ecosystem services modelling tools in a diverse UK river catchment. Science of the Total Environment, 584-585: 118-130.

[82]
Sherrouse B C, Semmens D J, Ancona Z H, et al.2017. Analyzing land-use change scenarios for trade-offs among cultural ecosystem services in the Southern Rocky Mountains.Ecosystem Services, 26: 431-444.

[83]
Smith F P, Gorddard R, House A P N, et al.2012. Biodiversity and agriculture: Production frontiers as a framework for exploring trade-offs and evaluating policy.Environmental Science & Policy, 23: 85-94.

[84]
Syrbe R-U, Walz U.2012. Spatial indicators for the assessment of ecosystem services: Providing, benefiting and connecting areas and landscape metrics.Ecological Indicators, 21: 80-88.

[85]
Thellmann K, Blagodatsky S, Haeuser I, et al.2017. Assessing ecosystem services in rubber dominated landscapes in South-East Asia-a challenge for biophysical modeling and transdisciplinary valuation.Forests, 8(12): 505.

[86]
Turner K G, Anderson S, Gonzales-Chang M, et al.2016. A review of methods, data, and models to assess changes in the value of ecosystem services from land degradation and restoration.Ecological Modelling, 319: 190-207.

[87]
Uhde B, Hahn W A, Griess V C, et al.2015. Hybrid MCDA Methods to integrate multiple ecosystem services in forest management planning: A Critical Review.Environmental Management, 56(2): 373-388.

[88]
Van Jaarsveld A, Biggs R, Scholes R, et al.2005. Measuring conditions and trends in ecosystem services at multiple scales: the Southern African Millennium Ecosystem Assessment (SAfMA) experience.Philosophical Transactions of the Royal Society of London B: Biological Sciences, 360(1454): 425-441.

[89]
Viglizzo E F, Frank F C.2006. Land-use options for Del Plata Basin in South America: Tradeoffs analysis based on ecosystem service provision.Ecological economics, 57(1): 140-151.

[90]
Vrebos D, Staes J, Vandenbroucke T, et al.2015. Mapping ecosystem service flows with land cover scoring maps for data-scarce regions.Ecosystem Services, 13: 28-40.

[91]
Wang J B, Liu J, Shao Q, et al.2009. Spatial-temporal patterns of net primary productivity for 1988-2004 based on GLOPEM-CEVSA model in the “Three-River Headwaters” region of Qinghai province, China.Chinese Journal of Plant Ecology, 33(2): 254-269. (in Chinese)

[92]
Wang J, Dong J, Yi Y, et al.2017. Decreasing net primary production due to drought and slight decreases in solar radiation in China from 2000 to 2012.Journal of Geophysical Research: Biogeosciences, 122(1): 261-278.

[93]
Wang Y, Li G, Ding J, et al.2016. A combined GLAS and MODIS estimation of the global distribution of mean forest canopy height.Remote Sensing of Environment, 174: 24-43.

[94]
Wei H, Fan W, Wang X, et al.2017. Integrating supply and social demand in ecosystem services assessment: A review.Ecosystem Services, 25: 15-27.

[95]
Wolff S, Schulp C J E, Verburg P H.2015. Mapping ecosystem services demand: A review of current research and future perspectives.Ecological Indicators, 55: 159-171.

[96]
Wu X, Wang S, Fu B, et al.2018. Land use optimization based on ecosystem service assessment: A case study in the Yanhe watershed.Land Use Policy, 72: 303-312.

[97]
Xue H.2013. Studies on services from artificial ecosystems. Hangzhou, Zhejiang University. (in Chinese )

[98]
Yang S, Zhao W, Liu Y, et al.2018a. Influence of land use change on the ecosystem service trade-offs in the ecological restoration area: Dynamics and scenarios in the Yanhe watershed, China.The Science of the total environment, 644: 556-566.

[99]
Yang T, Wang C, Li G, et al.2015. Forest canopy height mapping over China using GLAS and MODIS data.Science China Earth Sciences, 58(1): 96-105.

[100]
Yang W, Jin Y, Sun T, et al.2018b. Trade-offs among ecosystem services in coastal wetlands under the effects of reclamation activities.Ecological Indicators, 92: 354-366.

[101]
Yu G, He H, Zhou Y.2018. Ecosystem observation and research under background of big data.Bulletin of Chinese Academy of Sciences, 33(8): 832-837. (in Chinese)

[102]
Zhou X, Zhu H, Wen Y, et al.2018. Effects of understory management on trade-offs and synergies between biomass carbon stock, plant diversity and timber production in eucalyptus plantations.Forest Ecology and Management, 410: 164-173.

Outlines

/