Ecosystem Monitoring and Service

Temporal and Spatial Distribution of Evapotranspiration and Its Influencing Factors on Qinghai-Tibet Plateau from 1982 to 2014

  • CUI Mingyue 1, 2 ,
  • WANG Junbang , 2, 3, * ,
  • WANG Shaoqiang 2, 4 ,
  • YAN Hao 5 ,
  • LI Yingnian 3
Expand
  • 1. School of the Earth Sciences and Resources, China University of Geosciences (Beijing), Beijing 100083, China
  • 2. Key Laboratory of Ecosystem Network Observation and Modeling, Institute of Geographic Sciences and Natural Resources Research, Chinese Academy of Sciences, Beijing 100101, China
  • 3. Northwest Institute of Plateau Biology, Chinese Academy of Sciences, Xining 810001, China
  • 4. School of Geography and Information Engineering, China University of Geosciences (Beijing), Wuhan 430074, China
  • 5. National Meteorological Center, China Meteorological Administration, Beijing 100081, China;
*Corresponding author: WANG Junbang, E-mail:

Received date: 2018-12-20

  Accepted date: 2019-01-22

  Online published: 2019-03-30

Supported by

Foundation: National Key Basic Research and Development Program (2017YFC0503803)

National Natural Science Foundation of China (31861143015)

Qinghai Province S&T Program (2018-ZJ-T09).

Copyright

All rights reserved

Abstract

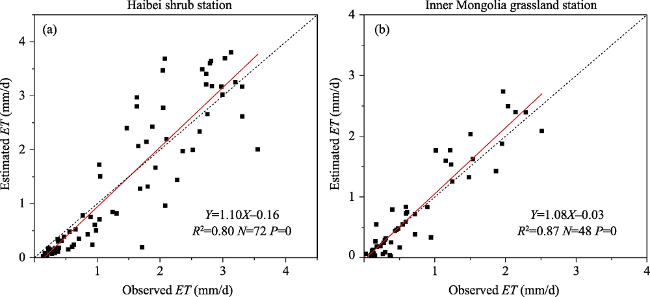
Evapotranspiration is the key driving factor of the earth’s water cycle, and an important component of surface water and energy balances. Therefore, it also reflects the geothermal regulation function of ecohydrological process. The Qinghai-Tibet Plateau is the birthplace of important rivers such as the Yangtze River and the Yellow River. The regional water balance is of great significance to regional ecological security. In this study, ARTS, a dual- source remote sensing evapotranspiration model developed on a global scale, is used to evaluate the actual evapotranspiration (ET) in the Qinghai-Tibet Plateau from 1982 to 2014, using meteorological data interpolated from observations, as well as FPAR and LAI data obtained by satellite remote sensing. The characteristics of seasonal. interannual and dynamic changes of evapotranspiration were analyzed. The rates at which meteorological factors contribute to evapotranspiration are calculated by sensitivity analysis and multiple linear regression analysis, and the dominant factors affecting the change of evapotranspiration in the Qinghai-Tibet Plateau are discussed. The results show that: (1) The estimated values can explain more than 80% of the seasonal variation of the observed values (R2 = 0.80, P < 0.001), which indicates that the model has a high accuracy. (2) The evapotranspiration in the whole year, spring, summer and autumn show significant increasing trends in the past 30 years, but have significant regional differences. Whether in the whole year or in summer, the southern Tibetan Valley shows a significant decreasing trend (more than 20 mm per 10 years), while the Ali, Lhasa Valley and Haibei areas show increasing trends (more than 10 mm per 10 years). (3) Sensitivity analysis and multiple linear regression analysis show that the main factor driving the interannual change trend is climate warming, followed by the non-significant increase of precipitation. However, vegetation change also has a considerable impact, and together with climate factors, it can explain 56% of the interannual variation of evapotranspiration (multiple linear regression equation R2 = 0.56, P < 0.001). The mean annual evapotranspiration of low-cover grassland was 26.9% of high-cover grassland and 21.1% of medium-cover grassland, respectively. Considering significant warming and insignificant wetting in the Qinghai-Tibet Plateau, the increase of surface evapotranspiration will threaten the regional ecological security at the cost of glacial melting water. Effectively protecting the ecological security and maintaining the sustainable development of regional society are difficult and huge challenges.

Cite this article

CUI Mingyue , WANG Junbang , WANG Shaoqiang , YAN Hao , LI Yingnian . Temporal and Spatial Distribution of Evapotranspiration and Its Influencing Factors on Qinghai-Tibet Plateau from 1982 to 2014[J]. Journal of Resources and Ecology, 2019 , 10(2) : 213 -224 . DOI: 10.5814/j.issn.1674-764X.2019.02.012

1 Introduction

The IPCC report shows that the global average surface temperature has risen by 0.74℃ in the past 100 years, and it has risen by 0.65℃ in the past 50 years. The warming rate of the latter is almost twice that of the former (IPCC, 2007). In China the temperature has risen by 0.5-0.8℃, and the variation of precipitation fluctuation is insignificant over the past 100 years (Zhang et al., 2017). Global climate change affects atmospheric water vapor content and atmospheric circulation, leading to significant changes in water circulation systems such as precipitation and evapotranspiration (Yin et al., 2012). Evapotranspiration (ET) is the total water vapor flux from a terrestrial ecosystem to the atmosphere, including vegetation transpiration and soil evaporation. It involves plant physiological and aerodynamic processes, and is the link for coupling hydro-ecological processes (Zhao et al., 2018). Studies have shown that evapotranspiration accounts for 60% to 65% of global precipitation (Brutsaert, 2005) and plays a key role in the water cycles and energy balances of the hydrosphere, atmosphere and biosphere (Li et al., 2014). Estimating the long-term trends and spatial differences of evapotranspiration and diagnosing the mechanisms of the impacts of climate and vegetation changes are essential for better understanding the interaction between future climate change and vegetation change caused by human activities (Yuan et al., 2010), and for coping with and adapting to future climate change and ecosystem management (Fisher et al., 2011; Zeng et al., 2012).
The main methods for measuring evapotranspiration include model estimation based on water balance method, Bowen specific energy balance method and aerodynamic method, and direct measurement based on transpiration meter method and eddy covariance (EC) method (Wu et al., 2015). Evapotranspiration models based on satellite remote sensing can be divided into empirical models using statistical regression analysis and process models based on physiology and ecology (Yan et al., 2012). Empirical models need calibration to adapt to the local climate and ecosystem, and often require re-calibration as climate conditions change. Physical models can be further classified into two types: Energy balance models and Surface conductance-based models. The stomatal conductance-based Penman-Monteith equation approach was considered to provide a biophysical framework with great potential for estimating ET at variable spatial and temporal scales, with the advantage of applicability to all sky conditions (Deng and Shao, 2018; Liu et al., 2013; Yang et al., 2017). The air-relative-humidity-based two- source (ARTS) ET model was developed to explicitly consider both plant transpiration and soil evaporation, and it has been confirmed that it can effectively simulate the spatial ET pattern and climate response across regional and global scales (Yan et al., 2012; Yan et al., 2016). However, its performance on the Qinghai-Tibet Plateau remains unknown.
As the “Asian water tower”, the Qinghai-Tibet Plateau is the source region of many rivers, including the Yangtze and Yellow Rivers (Zhan, 2017). The Qinghai-Tibet Plateau is not only the starting area for climate change in China (Feng and Tang, 1998), but also the driving force and magnifying glass for global climate change (Pan et al., 1995). Climate change in this region not only directly drives climate change in eastern and southwestern China, but also has a huge impact on the northern hemisphere, and even on global climate change, and it also has obvious sensitivity and regulation. This region’s unique cold climate and fragile grassland ecosystem make it the ecological security barrier of our country, which is directly related to the national ecological security. Evapotranspiration in the Qinghai-Tibet Plateau may lead to the degradation of grassland vegetation not only by affecting the ability of grassland vegetation to utilize water effectively (Shen and Fu, 2016; Tang et al., 2016), but also by affecting latent heat transport which affects precipitation (Shao et al., 2017). Studies also show that evapotranspiration and its influencing factors in the plateau are interdecadal and regionally different due to differences in global climate change. There were two turning points in humidity changes in the northern part of the plateau between 1961 and 2015, respectively, in 1985 and 2000 showing a cycle of “humidification-drying-humidification”. The factors affecting evapotranspiration also involve a combination of precipitation, temperature and effective energy to change into precipitation, temperature and relative humidity (Liu et al., 2015). These studies indicate that evapotranspiration trends and their influencing factors are highly uncertain depending on regional and temporal variations, and as the latitude and elevation increase, ecosystems may respond more sensitively and rapidly to temperature increases, thereby affecting and feeding back to regional hydrological cycles (Bonan, 2008; Bonan, 2014; IPCC, 2007). Climate change and human activities such as ecological construction and protection projects have made the ecosystem in the region generally better, as well as reducing its regional sustainability (Zhang et al., 2015). As an important part of the hydrological cycle, evapotranspiration plays an important role in regulating surface energy balance and local climate, especially in alpine regions. Against the background of global climate change, quantitative analysis of the change of evapotranspiration in the Qinghai-Tibet Plateau and the mechanisms of its impact, as well as exploring the possible impact of human activities, has become the current research hotspot and frontier, and has important practical and scientific significance.
Based on ARTS (Yan et al., 2012; Yan et al., 2014), a dual-source remote sensing evapotranspiration model developed on a global scale, using spatial interpolation meteorological data, and satellite remote sensing FPAR and LAI data as model-driven data, this study estimates the evapotranspiration over the Qinghai-Tibet Plateau from 1982 to 2014. Sensitivity analysis is used to quantitatively reveal the dominant climatic factors that drive the regional evapotranspiration change under the warm and humid background, and quantitatively reveal the trends of grassland evapotranspiration change with high, medium and low coverage and the differences in response to climate change. The results can provide data support for studying the hydrological and climatic regulation functions of ecosystems, and to provide effective suggestions and measures for adjusting human activities to further play the local climate regulation functions of ecosystems, so as to promote the sustainable development of the regional climate, ecology and socio- economy.

2 Data and methods

2.1 Overview of research area

The Qinghai-Tibet Plateau is located in the northwest part of China, spanning 26°00°12''-39°46°50''N latitude and 73°18°52''-104°46°59''E longitude, with an average elevation of more than 2000 meters. The main vegetation types on the Qinghai-Tibet Plateau are grassland and forest. The grassland is mainly divided into alpine meadow, alpine grassland and alpine desert (Chen et al., 2012).

2.2 Data

The observational data of the meteorological stations were obtained from the Daily Global Historical Climatology Network-Daily (GHCN-D) by National Oceanic and Atmospheric Administration and the “Daily Data Set of Ground Climate Data in China” by the National Meteorological Information Center of China Meteorological Administration. Daily observation data of precipitation, minimum temperature, maximum temperature, average relative humidity, average wind speed and sunshine hours in the study area and surrounding countries were obtained. After preprocessing, 8 km spatial grid data were generated by interpolation with ANUSPLINE software. The Digital Elevation Model (DEM) data as a covariate is the data of SRTM (Zhang et al., 2018; Zhu et al., 2013) with spatial resolution of 90 meters. The raster data for meteorological variables with spatial resolution of 8 km per half month from 1982 to 2014 were generated. Temperature and precipitation data interpolated by ANUSPLINE have high accuracy. The data interpolated by 1 km spatial resolution can explain 94% and 67% of the seasonal variation of the flux stations (Wang et al., 2017).
This study used the remotely sensed FPAR3g and LAI3g data for 1982 to 2014 as inputs. The dataset was derived from the new improved third generation Global Inventory Modeling and Mapping Studies (GIMMS) Normalized Difference Vegetation Index (NDVI3g) and the best-quality Terra Moderate Resolution Imaging Spectroradiometer (MODIS) LAI and FPAR products for the overlapping period of 2000-2009, and had a temporal frequency of 15-days, spatial resolution of 1/12 degree and temporal span of July 1981 to December 2015 (Wang et al., 2014).
Considering that there are few flux towers in the Qinghai-Tibet Plateau and grassland is the main vegetation type, the surface evapotranspiration observed by the flux towers of Haibei alpine meadow in Qinghai Province and the typical grassland flux towers in the Hohhot Region of Inner Mongolia Autonomous Region are selected to validate the model results. ChinaFLUX provided the daily GPP and meteorological data from 2003 to 2005 at grassland sites (HB and XLG). Continuous CO2 and H2O fluxes were measured using an infrared gas analyzer, and wind speed was measured using a 3-D sonic anemometer at a sampling frequency of 10 or 20 Hz at the flux sites (Yu et al., 2014). The data were filtered and corrected with coordinate rotation, the Webb-Pearman-Leuning correction (Webb et al., 1980), storage flux calculation, outlier filtering, nighttime CO2 flux correction (Reichstein et al., 2005), and gap filling (Falge et al., 2001). Site-specific thresholds of friction velocity were used to filter nighttime CO2 eddy covariance flux under low atmospheric turbulence conditions by individual researchers from each site (Yu et al., 2014). Data processing and quality control of the EC data were conducted through the ChinaFLUX flux data processing system (Li et al., 2008; Liu et al., 2012). Other processing details can be found in Yu et al. (2006), Guan et al. (2006), Wen et al. (2006), Fu et al. (2006), and Zhang et al. (2006).

2.3 Methods

2.3.1 ARTS ET module
The ARTS dual-source model is a global-scale remote sensing dual-source model of evapotranspiration, which is based on a vegetation P-M model and considers vegetation transpiration and soil evaporation (Yan et al., 2012). In this study, meteorological data and satellite remote sensing data are used as model inputs to simulate and estimate ET under the condition of sufficient soil water. The actual evapotranspiration, vegetation transpiration and soil evaporation were obtained by calculating a snow melting function model based on temperature and calculating the soil water coefficient by a soil correction module.
As a canopy conductance-based two-source E0 model with an assumption of adequate soil water availability, the ARTS model calculates plant transpiration (Ec) and soil evaporation (Es).
E0=Ec+Es (1)
The canopy transpiration (Ec) model is calculated from a modified Penman-Monteith model with input of the canopy-absorbed net radiation (AC) and canopy conductance (Gc),
${{E}_{C}}=\frac{\Delta {{A}_{C}}+\rho {{C}_{P}}D{{G}_{a}}}{\Delta +\gamma (1+{{G}_{a}}/{{G}_{c}})}$ (2)
${{G}_{C}}={{g}_{s\max }}\times {{R}_{h}}\times {{L}_{ai}}$ (3)
The soil evaporation (Es) equation is modified from an air-relative-humidity-based evapotranspiration model.
${{E}_{S}}=1.35{{R}_{h}}\times \frac{\Delta {{A}_{s}}}{\Delta +\gamma }$ (4)
where Ac is the net radiation absorbed by the canopy; As is the net radiation absorbed by the soil; Δ is the gradient of the saturated vapor pressure to air temperature; γ is the psychrometric constant; ρ is the density of air; Cp is the specific heat of air at constant pressure; Ga is the aerodynamic conductance accounting for wind speed impact; Gc is the canopy conductance accounting for transpiration from the vegetation; D is the vapor pressure deficit of the air; Rh is the relative humidity, and gsmax is the maximum stomatal conductance assumed to have a value of 12.2 mm·s-1. Lai is the leaf area index used for scaling stomatal conductance to canopy conductance for a large-scale application of the Penman-Monteith equation.
The snow melting function based on temperature and the soil water model are used to correct the above actual evapotranspiration, and the actual surface evapotranspiration is obtained. The calculation formula is as follows:
$P={{P}_{r}}+{{S}_{\text{now}}}\times {{S}_{f}}$ (5)
${{S}_{f}}=\left\{ \begin{align} & 0\ \ \ \ \ \begin{matrix} {} & {} \\\end{matrix}\ \ {{T}_{\text{a}}}\le 0{}^\circ \text{C} \\ & 0.2{{T}_{a}}\ \begin{matrix} {} & {} \\\end{matrix}\ 0{}^\circ \text{C}{{T}_{\text{a}}}\le 5{}^\circ \text{C} \\ & 1\ \ \ \ \ \ \ \begin{matrix} {} & {} \\\end{matrix}\ {{T}_{a}}>5{}^\circ \text{C} \\ \end{align} \right.$ (6)
$ET=\left\{ \begin{align} & {{E}_{0}}\begin{matrix} {} & \begin{matrix} \begin{matrix} \begin{matrix} {} & {} \\ \end{matrix} & {} \\ \end{matrix} & \text{ } \\ \end{matrix} \\ \end{matrix}P\ge {{E}_{0}} \\ & P+\beta ({{E}_{0}}-P)\begin{matrix} {} & {} \\ \end{matrix}P<{{E}_{0}} \\ \end{align} \right.$ (7)
$\beta =\frac{W-{{W}_{P}}}{{{W}_{C}}-{{W}_{P}}}$ (8)
Where W is the soil water content used for simulation data of GLOPEM-CEVAS model (mm), dW/dt is the change of W over a time t, P is the water input (mm) including precipitation and snowmelt, ET is evapotranspiration (mm), Pr is rainfall (mm), Snow is snowmelt (mm), Sf is the snowmelt factor, Ta is the air temperature (oC), E0 is the total evapotranspiration (mm) for a well-watered surface, defined earlier in Eq. (1), β is the soil water retention function, defined as the ratio of available soil water content (W-WP) to maximum soil water content (i.e., WC-WP), Wp is the soil water content at the wilting point (mm), and Wc is the field capacity (mm).
2.3.2 Analysis method and coefficient of variation
In this study, the pixel-by-pixel trend change method of mean, anomaly percentage, standard deviation and least square method is used to reflect the fluctuation level, dispersion degree and variation rate of evapotranspiration of grid units in the study area from 1982 to 2014. The calculation formulas are as follows.
$y=a+bx$ (9)
$\bar{a}=\bar{y}+b\bar{x}$ (10)
$b=\frac{n\sum\limits_{i=1}^{n}{xy-\sum\limits_{i=1}^{n}{y\sum\limits_{i=1}^{n}{x}}}}{n\sum\limits_{i=1}^{n}{{{x}^{2}}-{{\left( \sum\limits_{i=1}^{n}{x} \right)}^{2}}}}$ (11)
Where, b is the interannual trend based on least square method y with x factor, with a as the intercept, x as the year, and y as the evapotranspiration.
${{M}_{ij}}=\frac{E{{T}_{ij}}-\overline{E{{T}_{ij}}}}{E{{T}_{ij}}}\times 100%$ (12)
Where ETij is the ET value of the pixels in row i and column j; $\overline{E{{T}_{\text{ij}}}}$is the annual average of the pixels in row i and column j; and Mij is the percentage of ET anomaly of row i and column j pixels.
Coefficient of variation (CV) is an effective method for evaluating the trend change of overall sample stability. CV can reflect the degree of variation of evapotranspiration in each year in the study area (Jia, 2000).
$CV=\frac{S{{D}_{ij}}}{E{{T}_{ij}}}$ (13)
Where ETij is the annual average of the pixels in row i and column j; and SDij is the standard deviation of row i and column j.
In order to reveal the change of the ET space intuitively, CV values are divided into four grades: very stable (CV ≤ 0.1), stable (0.1 < CV ≤ 0.2), unstable (0.2 < CV <≤0.3), and very unstable (CV > 0.3) (Wang et al., 2018; Zhang et al., 2016).
2.3.3 Computation of Relative Change and Sensitivity Coefficient
The change trend of climate factors (C) is expressed by a linear trend. Relative change (RC) is expressed as a percentage of the variation during the study period (1982-2014) and the mean absolute value (av) of the climatic factor (Yin et al., 2010).
$RC=\frac{33\times C}{|av|}\times 100%$ (14)
In order to quantitatively study ET changes caused by changes in climatic factors, the sensitivity coefficients of ET to various climatic factors (mean temperature, precipitation, wind speed, relative humidity, radiation) and LAI of vegetation were calculated (Yin et al., 2010).
$S=\frac{\partial ET/ET}{\partial X/\left| X \right|}=\frac{\partial ET}{\partial X}\times \frac{\left| X \right|}{ET}$ (15)
Where, S is the dimensionless sensitivity coefficient of ET to each influencing factor X, ∂X is the change of the climate factor, and ∂ET as the change of ET caused by factor X. If S > 0, then ET increases with the increasing climatic factors, while if S < 0 this indicates negative effects from the climatic factors on ET changes. The larger the S, the greater the impact of the given climate factor on ET.
$CS=S\times RC$ (16)
The product of the relative change in a climatic factor (RC) and its sensitivity (S) can represent the contribution of this climatic factor change to ET changes (CS). The larger the CS, the greater the impact of the given climatic factor on ET changes.

3 Results and analysis

3.1 Model verification and accuracy evaluation

According to the data from the meteorological stations at Haibei Station from 2003 to 2005 and Inner Mongolia Station from 2004 to 2005, the validation results of ET simulation using meteorological station data show that the correlation coefficient of the fitting line between ET simulated by the ARTS model and meteorological station data is higher, showing a very significant linear correlation, and the model simulation accuracy is higher (Fig. 1). It can explain more than 80% of the seasonal variation of ET observed on the flux towers, among them, Haibei shrub station (R2 = 0.80, P < 0.001, n = 72), and Inner Mongolia grassland station (R2 = 0.87, P < 0.001, n = 48).
Fig. 1 The estimated ET was assessed through the observed ET on eddy covariance towers at Haibei, Qinghai and Hohhot, Inner Mongolia.

3.2 Variation of climate, vegetation and evapotranspiration

From 1982 to 2014, the annual average temperature of the Qinghai-Tibet Plateau was -0.35°C (±0.68), and the
interannual variation showed a significantly increasing trend (trend slope b = 0.058°C yr-1, R2 = 0.68, P < 0.001). The areas with the fastest and most obvious warming are located in the north-central part of Tibet and the whole Qinghai Province. On the contrary, the areas with the slowest warming are the southern part of Tibet and the eastern part of Sichuan Province. The variation trend of temperature in the study period has been less pronounced since around 2000.
From 1982 to 2014, the precipitation in Qinghai-Tibet Plateau increased gradually from northwest to southeast, with an average annual precipitation of 521.64 mm·yr-1 (±28.19) and the annual variation ranged from 466 to 585 mm yr-1, showing an insignificant upward trend (b = 0.77 mm yr-1, R2 = 0.07, P = 0.9). There was an insignificant difference in the trend of precipitation since around 2000. The results show that the climate of the plateau is significantly warming and insignificantly humidifying, and the warming trend has slowed down slightly after 2000.
Leaf area index (LAI) in Qinghai-Tibet Plateau increased slowly before 2000 (b = 0.0013, R2 = 0.078, P = 0.01), but decreased after 2000 (b = -0.0034, R2 = 0.187, P < 0.01). This shows that the leaf area index on the plateau has been increasing in general, but declining after 2000.
As shown in Fig. 2, the annual mean surface evapotranspiration of the Qinghai-Tibet Plateau from 1982 to 2014 was 317.58 mm, ranging from 217 mm to 338 mm. The annual variation showed an upward trend with a rate of change of 0.59 mm yr-1. In this study, the degree of deviation of evapotranspiration from the multi-year average for 1982- 2014 is analyzed by using the percentage deviation rate. The deviation value of ET first appears with a trend of increasing-decreasing-increasing. In 1984, 1986 and 2013, the percentages of deviations were higher, indicating that the deviations from the average level were serious. From 1982 to 2001, except for 1988 to 1990 and 1998 to 1999, the ET values were lower than the average level. In 1984 and 1986, the ET values were the lowest at 301.74 mm and 302.56 mm, respectively, which were lower than the average level by 5.88% and 5.62%. Beginning in 2004, the ET values were higher than the average level. In 2013, the ET value was the highest, reaching 338.67 mm, which was 5.63% higher than the average level. In other years, the ET values fluctuated within the range of 5% above and below the average level.
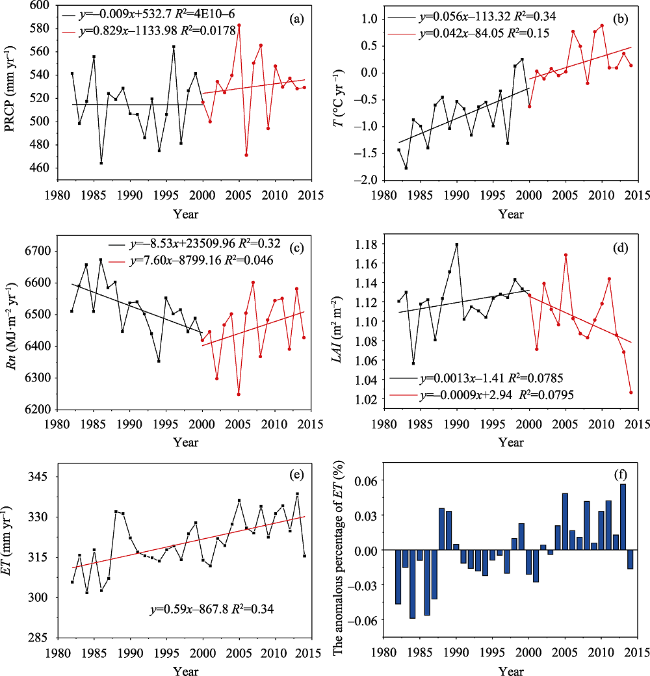
Fig. 2 Interannual variations of precipitation (a), temperature (b), radiation (c), LAI (d), and ET (e), and percentage of interannual anomaly (f) over the Qinghai-Tibet Plateau from 1982 to 2014.
According to the spatial distribution of ET in the Qinghai-Tibet Plateau (Fig. 3), the annual ET shows a strong spatial difference, which is very similar to the precipitation gradient distribution on the whole, showing a pattern of high in the southeast and low in the northwest. The annual average evapotranspiration varies from 20 mm to 850 mm. Generally, the wet area of rainforest and evergreen deciduous coniferous forest has the highest evapotranspiration, where the annual evapotranspiration is more than 700 mm. It is mainly distributed in the valleys of Yarlung Zangbo River and its tributaries in the mountains of southern Tibet and the high mountains and deep valleys of Hengduan Mountains in eastern Sichuan and Tibet. Alpine meadow, with evapotranspiration ranging from 200 mm to 400 mm, is widely distributed, mainly in the northern Tibetan plateau and north of the Bayan Kela Mountains. The evapotranspiration in Alpine desert area is the lowest, less than 100 mm, and is mainly distributed in the Kunlun Mountains of Xinjiang, Qaidam Basin of Qinghai and Ali region of Tibet. In general, the change trend of evapotranspiration over the past 33 years shows an increasing trend in most areas of the Qinghai-Tibet Plateau. The rate of increase ranges from 0 to 20 mm 10yr-1. There is a downward trend in Ali area, southern Tibet mountain area and Jinsha River tributary area of the Hengduan mountain area, with a downward rate of less than 20 mm 10yr-1. Haidong, Qinghai Province, shows an increasing trend with a rate of increase of 20-50 mm 10yr-1.
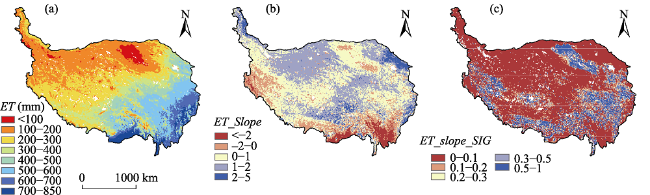
Fig. 3 Spatial distribution of ET multi-year mean and ET change rate in Qinghai-Tibet Plateau from 1982 to 2014
The spatial variation of seasonal evapotranspiration over the Qinghai-Tibet Plateau in recent 33 years (Fig. 4) shows a significantly increasing trend in the valleys of the tributaries of the Yarlung Zangbo River in southern Tibet and the valleys of the Dadu River in Western Sichuan in spring. The evapotranspiration in the intermountain area east of Hengduan Mountains showed a significant decreasing trend.
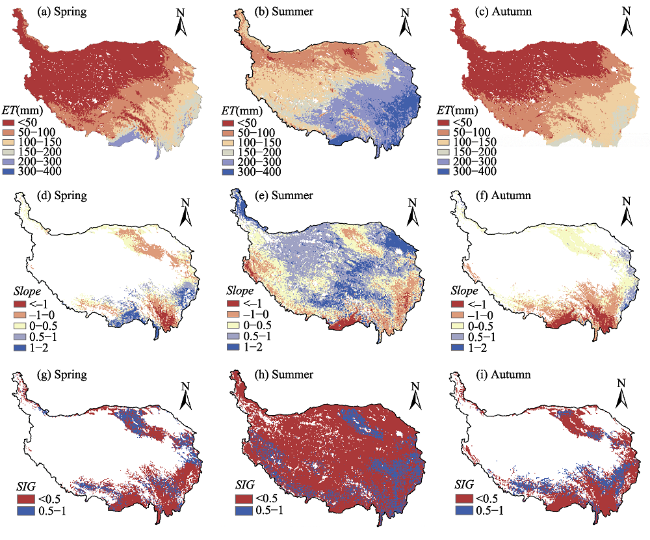
Fig. 4 Average seasonal evapotranspiration and its trend in the Qinghai-Tibet Plateau from 1982 to 2014
In summer, the tributaries of the Yarlung Zangbo River in southern Tibet, the valleys of the Dadu River in Western Sichuan, the Kekexili area in Western Tibet and the Qaidam Basin in Qinghai showed significant decreasing trends. The Haidong District of Qinghai Province and the area north of Yarlung Zangbo River showed a significant increasing trend. The southern Tibet of the Yanhimala Mountains showed only a slightly increasing trend.
In autumn, the evapotranspiration of the Qinghai-Tibet Plateau showed a downward trend on the whole, with the Yarlung Zangbo River Valley in southern Tibet and the In termountain area east of Hengduan Mountains showing a significant downward trend. In winter, the evapotranspiration of the Qinghai-Tibet Plateau showed an insignificant downward trend, mainly in the Yarlung Zangbo River Valley in southern Tibet.

3.3 Impact analysis of climatic factors

The main factors leading to ET changes were identified by comparing the contributions of meteorological factors and vegetation leaf area index (Fig. 5). Temperature and precipitation are the main factors causing ET changes in the whole Qinghai-Tibet Plateau, consistent with the findings of Yin et al. (Yin et al., 2010). The dominant factor is temperature, which contributes 6.21% of evapotranspiration change in most areas of the Qinghai-Tibet Plateau, followed by precipitation which contributes 3.89%. The decrease of precipitation results in the decrease of ET.
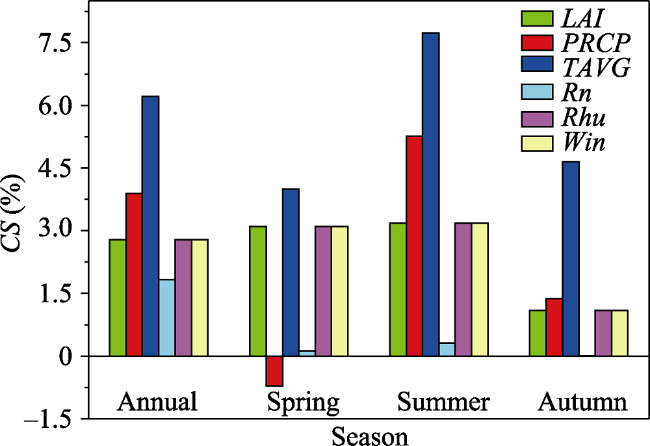
Fig. 5 Contributions of the dominant factors to interannual and seasonal evapotranspiration in the study area
Precipitation and temperature are the main factors affecting the seasonal variation of ET in the Qinghai-Tibet Plateau (Fig. 5). The contributions of precipitation in winter and spring are negative, which indicates that the contribution of precipitation to ET decreases significantly with the seasonally limited precipitation, while those of precipitation in summer and autumn are positive, which indicates that the contribution of precipitation to ET increases significantly with the increase of precipitation. The main climatic factors causing ET change in spring are temperature and vegetation leaf area index. The change of temperature is the most significant, followed by the change of vegetation coverage. With the increase of vegetation coverage, ET increases significantly. The main factors causing ET change in summer are temperature, precipitation and leaf area index of vegetation. With the seasonal increase in precipitation, it becomes the main climate factor causing ET change. The main factors causing ET changes in autumn and winter are precipitation and temperature.
From the perspective of spatial differentiation, the dominant factors of ET change in the Qinghai-Tibet Plateau from 1982 to 2014 are shown in Fig. 6 and Fig. 7. Precipitation and temperature increases are the dominant factors of ET increase in the north of the Tibetan Plateau. In the valley area below the Yarlung Zangbo River in southern Tibet, ET changes increased, which were most strongly affected by vegetation leaf area index, relative humidity and precipitation factors. The change of ET between Hengduan Mountains in southern Tibet shows decreases with the decrease of precipitation. The change of ET in Qaidam Basin of Qinghai Province is most strongly affected by precipitation and temperature. The change of ET in Western Sichuan is greatly affected by vegetation, relative humidity and wind speed. The increase of ET in southeastern Qaidam Basin is attributed to the increases in maximum temperature and precipitation. The increase in maximum temperature in the north and east of Gansu leads to the increase of ET, while the decrease of wind speed in the West leads to the decrease of ET.
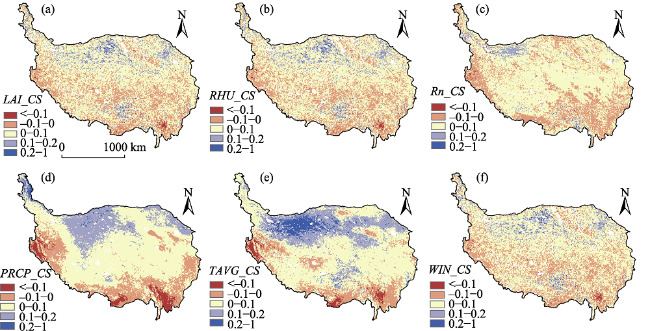
Fig. 6 Spatial map of contribution rate of various influencing factors to ET change in Qinghai-Tibet Plateau from 1982 to 2014
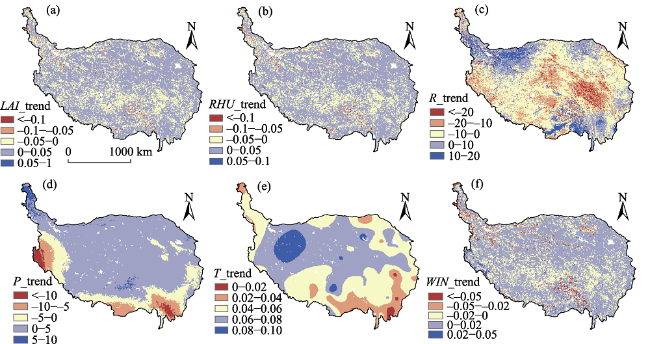
Fig. 7 Spatial trend of meteorological factors and leaf area index over the Qinghai-Tibet Plateau from 1982 to 2014

3.4 Differences in actual evapotranspiration between grasslands with different coverage

In order to further analyze the evapotranspiration characteristics of alpine meadows on the Qinghai-Tibet Plateau with different coverage, the interannual and monthly mean evapotranspiration of alpine meadows with different degrees of coverage were extracted. Due to the influence of topography, elevation and regional precipitation differences, the interannual average ET of grasslands with different degrees of vegetation coverage showed significant differences (Fig. 8). The annual average evapotranspiration of grassland with high coverage was 366.95 mm, which was much higher than that of grassland with either low or medium coverage. The multi-year evapotranspiration of low-cover grassland is 26.9% of high-coverage grassland and 21.1% medium- coverage grassland. High coverage vegetation has abundant water supply, which provides favorable conditions for evapotranspiration, and its value is relatively high.
Fig. 8 Interannual and seasonal variations of actual evapotranspiration of grasslands with different coverage in the Qinghai-Tibet Plateau from 1982 to 2014
The interannual variability of evapotranspiration for grasslands with different degrees of coverage from 1982 to 2014 showed a fluctuating upward trend on the whole, but before and after 2000, the trends were different (Fig. 8). Specifically, the actual evapotranspiration rate of grassland with medium coverage increased by 41% after 2000, and the corresponding value of grassland with low coverage increased by 18%, but the increase rate of grassland with high coverage was 0.3% lower than that of the previous period. The change in the temperature rate is insignificant around 2000, but the precipitation decreases before 2000 and increases after 2000. This observation further shows that pre cipitation rate is the main factor affecting the actual evapotranspiration rate of grassland with medium coverage after 2000. The temperature rate of grassland with low coverage after 2000 was 21.7% lower than that before 2000, but the precipitation decreased before 2000 and increased after 2000, indicating that the change in the actual evapotranspiration rate of grassland with low coverage was mainly caused by the change in the precipitation rate. This finding further shows that precipitation is the main climatic factor affecting the actual evapotranspiration of areas with different degrees of grassland coverage. The actual evapotranspiration rate of high coverage grassland did not change significantly after 2000 compared with those of medium and low coverage grasslands which increased significantly after 2000. The main reason for these differences is that the change in the LAI rate of high-coverage grassland is opposite before and after 2000, and it shows an increasing trend before 2000. Compared with the middle and low-coverage grasslands, it shows a serious degradation trend after 2000 which further underscores the fact that grassland degradation caused by human activities is another main cause of actual evapotranspiration change.

4 Discussion

4.1 Uncertainty of the results

According to the estimation of the remote sensing evapotranspiration dual source model ARTS, the average actual ET in Qinghai-Tibet Plateau from 1982 to 2014 was 377 mm yr-1, which is slightly lower than the MOD16 of the MODIS ET remote sensing product (389.69 mm yr-1) (Zhan, 2017), but higher than the ET 250±73.27 mm∙yr-1 in Qinghai-Tibet Plateau from 1981 to 2000 based on a literature review (Yin et al., 2012). The verification of the model estimation results based on the ET converted from the latent heat observation on the flux tower shows that the ARTS model can explain more than 80% of the seasonal variation of the observations. This indicates that the model can describe its seasonal variation characteristics accurately. The actual ET shows the most obvious reduction in the areas of the south of the Yarlung Zangbo River and the Himalayas Mountains. By contrast, the most obvious increase occurs in the Haidong area of Qinghai Province. These results are consistent with the findings of relevant scholars (Yin et al., 2012; Zhang, 2010). Since this study is mainly constrained based on the model of the soil-water from precipitation, whether the precipitation plays a decisive role in the spatial change of actual ET needs further exploration.

4.2 Climate impact

The results show that the main climatic factors affecting the actual ET in the Qinghai-Tibet Plateau are temperature and precipitation, and that the wind speed has little effect on the interannual and seasonal variations of the actual ET. The above two conclusions are consistent with previous studies (Wu, 2018; Li et al., 2018; Qiang et al., 2018). From the annual and spatial changes, this study has developed and quantitatively analyzed the contributions of climatic factors to the actual ET changes on the Qinghai-Tibet Plateau from 1982 to 2014. While this analysis concludes that the main factors that affect the actual ET change in time and space are temperature and precipitation, some errors in the interpolation of meteorological data still exist. Determining how to obtain the accurate meteorological data and quantitatively analyze the contribution values of the actual ET will be the next step.

4.3 Focusing further attention on the relationship between glacial melt-water and surface ET

The Qinghai-Tibet Plateau is considered as the water tower of Asia and the birthplace of many rivers. The glaciers play an important role in the replenishment of the water supply and climate regulation in the surrounding areas. However, against the background of global climate change, the process of glacier retreat is intensified, which leads to the trend of warm and humid development of the Qinghai-Tibet (Wu, 2018). This change in hydrothermal conditions has a profound impact on the structure and function of the Qinghai-Tibet Plateau ecosystem (Yu and Feng, 2012). According to the analysis of actual ET changes of different vegetation coverages, the transpiration effect of vegetation has decreased with the decrease of leaf area index from 2000 to 2014. However, the actual ET and soil-water evaporation has increased slowly. This also indicates that the snow melting water of the Qinghai-Tibet Plateau glacier will be used as the reserve water source for soil evaporation in the condition of the global climate change. Especially as the temperature continues to increase, the continuous melting of glaciers will bring ecological disaster to the water cycle change of the Qinghai-Tibet Plateau.

4.4 Influence of vegetation change on surface ET

According to land types and evapotranspiration data of Qinghai-Tibet Plateau, the annual ET under different grassland coverage extents can be calculated. The results show that the ET of high-coverage grassland is 7.31% and 26.9% higher than the middle- and low-coverage grassland. Since the actual ET in the area of exuberant vegetation is higher than in the area of sparse vegetation, it indicates that the change of vegetation cover has responded to the actual ET change (Wang et al., 2018) and shows that human activities have an indirect effect on the actual ET. Against the background of global warming, the degree of warming and humidification on the Tibetan Plateau will be enhanced (Zeng, 2014), and the area of alpine meadow and alpine grassland will decrease significantly in the future (Zhao et al., 2011). These projections have sounded the alarm to the local government, and local residents should properly graze in order to protect the ecological environment of the alpine grasslands.

5 Conclusions

Based on the ARTS remote sensing evapotranspiration model, this study estimates the actual ET of the Qinghai- Tibet Plateau from 1982 to 2014. According to the analysis on the space-time variation of the actual ET, the main factors which drive ET changes are quantitatively analyzed in the dimensions of time and space. The actual ET distribution in the Qinghai-Tibet Plateau is similar to the precipitation, which obeys a regular pattern of gradually decreasing from southeast to northwest. The annual average ET varies from 20 mm to 850 mm. From 1982 to 2014, the annual variation of the actual ET in the Qinghai-Tibet Plateau shows an increasing trend. The rate of increase ranges from 0 to 20 mm·10yr-1, and the average value is 5.5 mm·10yr-1, indicating that the trend is significant, especially in the tropical rain forest below the Yarlung Zangbo River, the eastern part of Qinghai Lake and the Himalayas. The quantitative analysis concludes that the precipitation (3.89%) and temperature (6.21%) are the main factors leading to significant inter-annual changes of ET in the Qinghai-Tibet Plateau, and that the main factors of seasonal variation also include the leaf area index. It shows the response of vegetation transpiration to the re-greening period. The actual ET of the Qinghai-Tibet Plateau has a strong spatial differentiation, which shows a close relationship with vegetation changes. The study further analyzed the difference of actual ET of different extents of grassland coverage. It shows the actual ET in high-coverage grassland area is higher than medium-coverage and low-coverage areas, which indicates that the change of vegetation coverage had a profound impact on the actual ET. Against the background of climate change with significant warming but insignificant humidification in the Qinghai-Tibet Plateau, the increase of surface ET will continue to increase the cost of glacial melting water and threaten the regional ecological environmental security. The scientific allocation and rational utilization of water resources directly affect the sustainable development of the ecological environment. The accurate estimation of actual ET can provide a scientific foundation for the analysis of warming and humidification, grassland degradation, water resources management and utilization in the Qinghai-Tibet Plateau. In addition, it possesses great significance for strengthening surface ET monitoring, determining the vegetation transpiration, soil evaporation, water resources utilization, monitoring of drought and flood disasters, and restoring degraded grassland and glacial snow melting.

The authors have declared that no competing interests exist.

[1]
Bonan G B.2008. Forests and climate change: forcings, feedbacks, and the climate benefits of forests.Science, 320(5882): 1444-1449.

[2]
Bonan G B.2014. Connecting mathematical ecosystems, real-world ecosystems, and climate science.New Phytologist, 202(3): 731-733.

[3]
Brutsaert W.2005. Hydrology: An Introduction. New York: Cambridge University Press.

[4]
Chen Z Q, Shao Q Q, Liu J Y, et al.2012. Analysis of net primary productivity of terrestrial vegetation on the Qinghai-Tibet Plateau,based on MODIS remote sensing data.Science China Earth Sciences, 55(8): 1306-1312.

[5]
Deng H, Shao J A.2018. Evapotranspiration and humidity variations in response to land cover conversions in the Three Gorges Reservoir Region.Journal of Mountain Science, 15(3): 590-605.

[6]
Feng S, Tang M C, Wang D M.1998. The Qinghai-Tibet Plateau is New Evidence for the Starting Zone of Climate Change in China. Chinese Science Bulletin, 43(6): 633. (in Chinese)

[7]
Fisher J B, Whittaker R J, Malhi Y.2011. ET come home: potential evapotranspiration in geographical ecology.Global Ecology & Biogeography, 20(1): 1-18.

[8]
Hu Z, Yu G, Zhou Y, et al.2009. Partitioning of evapotranspiration and its controls in four grassland ecosystems: Application of a two-source model. Agricultural and Forest Meteorology, 149(9): 1410-1420.

[9]
IPCC. 2007. Summary for Policymakers of Climate Change 2007: The Physical Science Basis.Contribution of Working Group I to the Fourth Assessment Report of the Intergovernmental Panel on Climate Change. Cam-bridge,UK: Cambridge University Press, 18(2): 95-123.

[10]
Jia P J.2000. Statistics. Beijing: Chinese People’s University Press.

[11]
Li Q, Jing Y S, Ma M J, et al.2018. The characteristics of actual evapotranspiration and influencing factors of paddy field inlow hilly red soil region.Chinese Journal of Ecology, 37(1): 219-226. (in Chinese)

[12]
Li X, Liang S, Yuan W, et al.2014. Estimation of evapotranspiration over the terrestrial ecosystems in China. Ecohydrology, 7(1): 139-149.

[13]
Liu S, Qiang H, Dengfeng L, et al.2015. Analysis of characteristics of s patio-temporal evolution of climate factors in Datong river basin of Tibet Plateau. Journal of Water Resources and Water Engineering, 26(3): 24-29. (in Chinese)

[14]
Liu Y, Zhou Y, Chen J, et al.2013. Evapotranspiration and water yield over China's landmass from 2000 to 2010.Hydrology and Earth System Sciences, 17(12): 4957-4980.

[15]
Pan B T, Li J J, Chen F H.1995. Qinghai-Tibetan Plateau: a driver and amplifier of global climatic changes-Ⅰ Basic characteristics of climatic changes in Cenozoic Era.Journal of Lanzhou University (Natural Science Edition), 31(3): 120-128. (in Chinese)

[16]
Qiang H, Jin X, Liu C, et al.2018. Variations of actual evapotranspiration in the Yangtze River headwater region based on coupled water-energy balance.Journal of Arid Land Resources and Environment, 32(3): 106-111. (in Chinese)

[17]
Shang L Y, Zhang Y, Lv S H, et al.2015. Energy exchange of an alpine grassland on the eastern Qinghai-Tibetan Plateau.Science Bulletin, 60(4): 435-446.

[18]
Shao T B, Liu Y Z, Jia R,et al.2017.Changes of energy budget in the Qinghai-Tibet Plateau under the background of global warming. The 34th Annual Meeting of the Chinese Meteorological Society.

[19]
Shen Z X, Fu G.2016. Relationships between water use efficiency and environmental temperature and humidity in an alpine meadow in the Northern Tibet.Ecology and Environmental Sciences, 25(8): 1259-1263. (in Chinese)

[20]
Tang M, Zhang B, et al.2016. Characteristics of temporal and spatial variations of surface aridity index and climatic factors on the impact in headwaters of the three rivers in recent 55 years. Ecology and Environmental Sciences, 25(2): 248-259. (in Chinese)

[21]
Wang F, Wang Z, Zhang Y, et al.2018. Spatio-temporal variations of evapotranspiration in Anhui Province using MOD16 products.Resources and Environment in the Yangtze Basin, 27(3): 523-534. (in Chinese)

[22]
Wang J, Dong J, Liu J, et al.2014. Comparison of gross primary productivity derived from GIMMS NDVI3g, GIMMS, and MODIS in Southeast Asia.Remote Sensing, 6(3): 2108-2133.

[23]
Wang J, Wang J, Ye H, et al.2017. An interpolated temperature and precipitation dataset at 1-km grid resolution in China (2000-2012).Chinese Scientific Data, 2(1): 72-80.

[24]
Wang Y, Liu Y, Jin J X, et al.2018. Contrast effects of vegetation cover change on evapotranspiration during a revegetation period in the Poyang Lake Basin, China. Forests, 9(4): 1999-4907.

[25]
Wu J K, Zhang S Q, Wu H, et al.2015. Actual evapotranspiration in Suli Alpine Meadow in northeastern edge of Qinghai-Tibet Plateau, China. Advances in Meteorology, (12): 1687-9317.

[26]
Wu Y.2018. Study on the trend and countermeasures of glaciers on the Tibetan Plateau.The Theoretical Platform of Tibetan Development, 1: 73-75. (in Chinese)

[27]
Yan H, Wang S Q, Lu H Q, et al.2014. Development of a remotely sensing seasonal vegetation‐based Palmer Drought Severity Index and its application of global drought monitoring over 1982-2011.Journal of Geophysical Research Atmospheres, 119(15): 9419-9440.

[28]
Yan H, Wang S Q, Oechel W, et al.2012. Global estimation of evapotranspiration using a leaf area index-based surface energy and water balance model.Remote Sensing of Environment, 124: 581-595.

[29]
Yan H, Wang S Q, Wang J B, et al.2016. Assessing spatiotemporal variation of drought in China and its impact on agriculture during 1982-2011 by using PDSI indices and agriculture drought survey data.Journal of Geophysical Research-Atmospheres, 121(5): 2283-2298.

[30]
Yang Q, Ma Z G, Zheng Z Y, et al.2017. Sensitivity of potential evapotranspiration estimation to the thornthwaite and Penman-Monteith methods in the study of global drylands.Advances in Atmospheric Sciences, 34(12): 1381-1394.

[31]
Yin Y H, WU S H, DAI E F.2010. Determining factors in potential evapotranspiration changes over China in the period 1971-2008.Chinese Science Bulletin, 55(29): 3329-3337.

[32]
Yin Y H, Wu S H, Zhao D, et al.2012. Impact of climate change on actual evapotranspiration on the Tibetan Plateau during 1981-2010.Acta Geographica Sinica, 67(11): 1471-1481. (in Chinese)

[33]
Yu L, Feng C Y.2012. Recent progress in climate change over Tibetan Plateau.Plateau and Mountain Meteorology Research, 32(3): 84-88. (in Chinese)

[34]
Yuan W, Liu S, Yu G, et al.2010. Global estimates of evapotranspiration and gross primary production based on MODIS and global meteorology data.Remote Sensing of Environment, 114(7): 1416-1431.

[35]
Zeng F M.2014. Global warming aggravates the “warming and humidifying”of the Qinghai-Tibet Plateau.New Tibet, (8): 63-63. (in Chinese)

[36]
Zeng Z, Piao S, Xin L, et al.2012. Global evapotranspiration over the past three decades: estimation based on the water balance equation combined with empirical models.Environment Research Letters, 7(1): 1748-9326.

[37]
Zhan Q Q.2017. Spatial and temporal variations of evapotranspiration in the Qinghai-Tibet Plateau from 2001 to 2014.Science & Technology Information, 15(35): 218-219. (in Chinese)

[38]
Zhang Q F, Liu G X, Yu H B, et al.2016. Temporal and spatial dynamic of ET based on MOD16A2 in recent fourteen years in Xilingol Steppe.Acta Agrestia Sinica, 24(2): 286-293. (in Chinese)

[39]
Zhang Q, Yang Q, Cheng J, et al.2018. Characteristics of 3'' SRTM Errors in China. Geomatics & Information Science of Wuhan University, 43(5): 684-690. (in Chinese)

[40]
Zhang T, Gebremichael M, Meng X, et al.2017. Climate‐related trends of actual evapotranspiration over the Tibetan Plateau (1961-2010).International Journal of Climatology, 38(1): 48-56.

[41]
Zhang X, Yang Y, Piao S, et al.2015. Ecological change on the Tibetan Plateau.Chinese Science Bulletin, 60(32): 3048-3056. (in Chinese)

[42]
Zhao D S, Wu S H, Yin Y H, et al.2011. Vegetation distribution on Tibetan Plateau under climate change scenario.Regional Environmental Change, 11(4): 905-915.

[43]
Zhao G S, Dong J W, Cui Y P, et al.2018. Evapotranspiration-dominated biogeophysical warming effect of urbanization in the Beijing-Tianjin- Hebei region, China.Climate Dynamics, 327(51): 1-15.

[44]
Zhu Z, Bi J, Pan Y, et al.2013. Global data sets of vegetation leaf area index (LAI) 3g and fraction of photosynthetically active radiation (FPAR) 3g derived from global inventory modeling and mapping studies (GIMMS) normalized difference vegetation index (NDVI3g) for the period 1981 to 2011. Remote Sensing, 5(2): 927-948.

Outlines

/