Ecosystem Monitoring and Service

Temperature Affects New Carbon Input Utilization by Soil Microbes: Evidence based on a Rapid δ13C Measurement Technology

  • CAO Yingqiu 1 ,
  • ZHANG Zhen , 1, * ,
  • XU Li 2 ,
  • CHEN Zhi 2 ,
  • HE Nianpeng , 2, 3, 4, *
Expand
  • 1. Resources and Environment College, Anhui Agricultural University, Hefei 230036, China
  • 2. Key Laboratory of Ecosystem Network Observation and Modeling, Institute of Geographic Sciences and Natural Resources Research, Chinese Academy of Sciences, Beijing 100101, China
  • 3. College of Resources and Environment, University of Chinese Academy of Sciences, Beijing 100049, China
  • 4. Institute of Grassland Science, Northeast Normal University, and Key Laboratory of Vegetation Ecology, Ministry of Education, Changchun 130024, China
*Corresponding author: ZHANG Zhen, E-mail: ; HE Nianpeng, E-mail:

Received date: 2018-12-10

  Accepted date: 2019-01-30

  Online published: 2019-03-30

Supported by

National Key Research and Development Program of China (2016YFA0600104, 2016YFC0500102)

Natural Science Foundation of China (31770655, 41671045)

and Program of Youth Innovation Research Team Project (LENOM2016Q0005).

Copyright

All rights reserved

Abstract

Strong and rapid responses of soil microbial respiration to pulses, such as those from available soil organic matter (SOM) or water input from precipitation (especially in arid areas), are common. However, how soil microbes utilize new SOM inputs and the effects that temperature may have on their activities are unclear owing to the limitation in the application of traditional isotopic techniques at minute scales. In the present study, we developed a system of measuring 12CO2 and δ13C minutely and synchronously under controlled incubation temperatures, i.e., for 48 h at 7, 10, 15, 20, and 25 °C, to explore the carbon utilization strategies of soil microbes. We measured the respiration rates of soil microbes in response to different carbon sources, i.e., added glucose (Rg) and initial SOM (Rs), as well as the total respiration rate (Rt). All responses were rapid and characterized by unimodal curves. Furthermore, the characteristic values of these curves, such as the maximum of rate (R-max), the time required to achieve R-max, and the ratio of the duration of R-max to that of 1/2 R-max, were all dependent on incubation temperature. Interestingly, temperature greatly influenced the strategy that microorganisms employed to utilize different carbon sources. The effects of temperature on the intensity of the microbial respiratory response and the ratio of Rg/Rs are important for evaluating the effect of land-use changes or variations in seasonal temperature on SOM turnover and should be considered in ecological models in future studies.

Cite this article

CAO Yingqiu , ZHANG Zhen , XU Li , CHEN Zhi , HE Nianpeng . Temperature Affects New Carbon Input Utilization by Soil Microbes: Evidence based on a Rapid δ13C Measurement Technology[J]. Journal of Resources and Ecology, 2019 , 10(2) : 202 -212 . DOI: 10.5814/j.issn.1674-764X.2019.02.011

1 Introduction

Different pulse phenomena commonly and greatly affect soil microbial respiration when specific environmental factors, such as temperature and precipitation, are significantly altered (Schwinning and Sala, 2004; Cable et al., 2008). Changes in environmental factors may increase the availability of soil organic matter (SOM) (Nelson et al., 1996) or active soil organic carbon (SOC) for rapid use by soil microbes. Pulse phenomena refer to the ability of soil microbes to use these pulse resources (Schaeffer and Evans, 2005), which is especially rapid in arid or semi-arid regions. During the pulse processes, initial SOM can be decomposed by microbes because carbon dioxide (CO2) and numerous available mineral nutrients promote soil nutrient transformation and cycling. In addition, it is an important approach for emitting CO2 into the atmosphere and determining soil C sources/sinks in some terrestrial ecosystems (Reid et al., 2012).
Respiratory substrates for soil microbes are supplied mainly by biological residues of aboveground and underground parts of plants and root exudates, respectively (Bhattacharya et al., 2016). The aboveground part is composed of various types of litter consisting of branches and leaves, and the input of SOM is commonly accompanied by moisture and temperature changes. For example, rainfall increases the content of dissolved organic matter in soils (Yu et al., 2018). The response of microbes to varying external environmental conditions is rapid (Unger et al., 2010). For instance, rainfall can lead to a rapid increase in soil respiration rate which can reach a maximum in less than 30 min (Wang et al., 2016); similarly, the addition of exogenous organic matter can increase soil respiration within 10 min (Cui and Caldwell, 1997). However, these previous studies were not able to elucidate the process underlying the efficient utilization of new SOM input by microbes. C isotope markers have been used to test changes in soil microbial biomass C (MBC) in response to different C sources (Kendall et al., 2001) and changes in the soil microbial community (Zhang et al., 2013). Two kink technologies have been developed to determine C isotope ratios, stable isotope mass spectrometry (IRMS) (Chamberlain et al., 2006) and stable isotopic infrared spectroscopy (IRIS) (Wang et al., 2013). Despite IRMS having a high precision in measuring SOM turnover, its capacity for continuous observation is limited due to it being restricted by the frequency that samples were collected and its measurement accuracy is affected by the efficiency of the sample collection and the accuracy of the instrument. It is time-consuming and difficult to achieve high precision measurements under continuous observations (Brand, 2010). However, IRIS can conduct continuous in-situ measurements with high precision, which affords the opportunity to explore rapid processes of SOM decomposition under pulse effects, using the parameters: 12CO2 and δ13C. To date, bridging the IRIS analyzer and incubation system in the laboratory has been very challenging, particularly for rapid, automatic, continuous, and separate measurement of 12CO2 and δ13C under controlled temperature conditions, because no commercial equipment is available for the laboratory that meets the requirements of such in-situ measurements.
Soil respiration is not only affected by substrate supply, but also by temperature (Lloyd and Taylor, 1994; Davidson and Janssens, 2006). When available SOM is adequate and the humidity is suitable, alterations in temperature lead to changes in soil microbial enzyme activities (Daniel et al., 2001), which in turn affect soil microbial respiration. When the temperature is low, the microbial activity of extracellular enzymes decreases, resulting in a decrease in soil respiration rate (Daniel and Danson, 2010). An increase in temperature promotes a gradual increase in the activity of extracellular enzymes, and hence, an increase in the rate of SOM decomposition. Temperature is an important factor that influences soil respiration rate, therefore, we presumed that the utilization of new SOM input by soil microbes after pulse SOM or water input would also be affected by temperature changes. As previously mentioned, the determination of microbial respiration rates involve the rapid measurement of 12CO2 and 13CO2 under isotopic calibration; therefore, to increase the accuracy of isotope measurement in the study of SOM turnover, the techniques and technology involved should be improved.
In this study, we first developed a system of measuring 12CO2 and δ13C fluxes of incubation samples minutely and synchronously under controlled incubation temperatures. Using this novel system, we conducted 48-h incubation experiments at 3 min intervals to explore the strategies of soil microbes for utilizing glucose added under a gradient of 7, 10, 15, 20, and 25°C. These novel experiments have a high measurement frequency that can measure the rapid response processes of microbes to new C inputs. The main objectives of this study were to explore the utilization strategies of soil microbes under different C sources (i.e., glucose addition versus initial SOM) and to quantify the effect of temperature on C utilization strategies of soil microbes. The findings of the present study improve the understanding of C utilization strategies of soil microbes and SOM turnover in response to pulse phenomena, land-use changes, and seasonal temperature changes.

2 Materials and methods

2.1 Study site description

Soil samples were collected from a warm-temperate mixed forest in arid and semi-arid regions in northern China (39°55ʹN, 115°20ʹE) at an average elevation of 1457.7 m. The study area is characterized a warm temperate continental climate, with an annual average temperature of approximately 6.5°C, and an annual average precipitation of 600 mm. Quercus liaotungensis was the dominant species in the study area, and this forest type is important in the warm temperate zone of China.
Soils in the study area had a pH value of 6.9 ± 0.1; an oxidation-reduction potential of 177.6 ± 0.6 MV; an electrical conductivity of 134.8 ± 4.9 m s-1; soil particle size distribution of 95.6 ± 1.0% clay, 4.1 ± 0.9% silt, and 3.1 ± 0.2% sand; and were classified as Lixisols, according to the classification of world reference base for soil resources (Phillips and Marion, 2007). The contents of SOC, soil organic nitrogen, dissolved organic C (DOC), and dissolved organic nitrogen (DON) were 3.9 ± 0.1%, 0.3 ± 0.01%, 314.1 ± 17.1 mg kg-1, and 58.4 ± 5.6 mg kg-1, respectively.

2.2 Field sampling

Soil samples were collected in July 2017. At the sampling point, three random replicates were set at a spacing of 10 m × 10 m. Soil mixture samples from 0-10 cm depth were collected from each sampling plot using a soil drill. The “S” shape sampling method was used to pool 10 drilled out collections in each sample, and the total soil weight of each pooled sample was approximately 10 kg. Roots and visible organic debris were manually removed, and the samples were homogenized and sieved (< 2 mm diameter). Some samples were dried in unrefrigerated, shaded conditions and used to measure soil physical and chemical properties, and the remaining samples were stored at 4°C until further use in the analyses of respiration rates and soil MBC.

2.3 Laboratory analysis of soil properties

2.3.1 Physical and chemical properties
To determine the basic soil properties, we measured soil pH, conductivity, and oxidation-reduction potential using a soil:water mixture (1:1.25) and an Ultrameter II pH meter (Myron L. Company, CA, USA). Soil texture was classified as sand (250-2000 μm), silt (50-250 μm), or clay (< 50 μm) using a Mastersizer-2000 laser particle instrument (Malvern Company, Worcestershire, England).
The SOC content was measured using the H2SO4- K2Cr2O7 oxidation method (Nelson et al., 1996). After the measurement of soil respiration, DOC was extracted from incubated soil using distilled water (at a ratio of 1:5 for soil:water), and analyzed using a total organic C (TOC) analyzer (Elementar, Liqui-TOC II, Germany) (Gregorich et al., 2003). The content of nitrogen was measured using a modified Kjeldahl method (Gallaher et al., 1976). The DON was measured using a continuous flow analyzer (Futura, France).
2.3.2 Measurement of soil microbes
MBC was determined using the fumigation-incubation method and a TOC analyzer, and was calculated as the difference in the measured organic C between fumigated and non-fumigated soils using a conversion coefficient (KEC = 0.45) (Baumann et al., 1996).
2.3.3 Measurement of soil respiration rate and δ13C
As previously mentioned, there are two traditional methods to determine δ13C content—stable IRMS (Leis et al., 1988) and stable IRIS (Lee and Majkowski, 1986), however, there are difficulties associated to both methods. To resolve these difficulties, we developed a new system.
In previous studies, we invented the PRI-8800 Automatic Temperature Control Soil Flux System (PRI-8800, PRE- ECO, Beijing, China), as a modification of the method of He et al. (2013). This system enabled us to vary the incubation temperature continuously and measure microbial respiration rate at a high frequency (Wang et al., 2016; Liu et al., 2017; Liu et al., 2018). Moreover, we developed a new system by combining PRI-8800 with a PICARRO isotope analyzer, which can measure 12CO2 and δ13C rapidly and automatically at variable incubation temperatures In this system, the main instruments used are: a PICARRO isotope analyzer, cryogenic circulator, constant temperature water bath, data collector, and solenoid valve. It is possible to measure a culture bottle every 3 min in this system, and the initial CO2 concentration, test duration, and automatic switching between different test samples can be adjusted according to the requirements of the experiment. The rapid, continuous, and simultaneous determination of microbial respiration rate and isotopes was realized.
Here, fresh soil samples (equivalent to 30 g dry soil weight) were placed in 150 mL plastic culture bottles, and distilled water was added to reach 55% of the soil water holding capacity (WHC). Samples were incubated for 3 days at 25°C, during which the WHC was maintained at 55%.
According to the range of average annual temperatures (6.5-25°C) at the study site, the experimental temperatures: 7, 10, 15, 20, and 25°C were selected as the constant temperatures for continuous soil microbial respiratory rate assessments for 48 h. Prior to glucose addition, the soil microbial respiration rate was measured for each gradient (three replicates per gradient). Thereafter, the glucose solution and water were added to make to reach a soil moisture content of 65% of WHC, because 55%-65% WHC was considered suitable for microbial growth (Williams and Rice, 2007). All the bottles were sealed with plastic wrap to reduce moisture loss during the measurement. To achieve high frequency measurement and prevent cross contamination between different treatments, only one temperature gradient sample was measured each time.

2.4 Statistical analysis

2.4.1 Calculation of the ratio of normal glucose to labeled glucose
The ratio of R-value of the sample (Rsmpl) to R-value of the standard substance (Rst) was expressed in terms of the isotopes composition of the sample, i.e., expressed as δ units (‰, per mil):
${{\delta }^{13}}{{\text{C}}_{\text{smpl}}}=\left( \frac{_{{}}^{13}R}{0.0112372}-1 \right)\times 1000$ (1)
where, 13R = 13C/12C; Rs = 0.0112372.
$AT{{=}^{13}}R\times \frac{100}{1{{+}^{13}}R}$ (2)
where, AT represents the isotopic abundance (%).
The upper limit of isotope abundance of the PICARRO isotope analyzer was 4000‰. According to Eq. (1) and Eq. (2), added glucose was a mixture (1:19) of 99% atom 13C-labeled glucose (American CIL) and unlabeled glucose (Liu et al., 2015).
2.4.2 Calculation of the concentration of glucose solution
The 13C-labeled glucose solution (200 μg g-1 C) was added to the soil. Soil with 100% MBC, without glucose addition, was used as the control (Shahbaz et al., 2018). The initial concentration of glucose solution was 75 mg mL-1, i.e., 2 mL glucose solution was added to each culture bottle, however, we found that this concentration does not adequately meet the requirement of the microorganisms in these fresh soils in our pilot study. Therefore, the final concentration of glucose solution used was 400 μg g-1 C (corresponding to glucose solution concentration of 150 mg mL-1, obtained by adding 2 mL of the stock solution to each culture bottle).
2.4.3 Calculation of the proportion of glucose respiration
The 13C atom percentage (%) of the sample was calculated using following formula:
fglucose = (δmix – δsoil)/(δglucose – δsoil) (3)
Where, fglucose is 13C fraction of CO2 in the gas sample, the δsoil = 25‰, and δglucose = 3864‰, which were measured by IRIS (Troyer et al., 2011), and δmix was measured using the new apparatus.
2.4.4 Measurement of soil microbial respiration rate
Total soil microbial respiration rate (Rt) is the amount of CO2 released by soil microbes per unit time. According to the principle of development instrument in this study, the following formula is used to calculate.
Rt =$\frac{C\times V\times \alpha \times \beta ~}{m}$ (4)
where Rt is measured as μg C g-1 soil h-1, C is the slope of the change in CO2 concentration, V is the volume of the incubation bottle and gas tube; m is the soil weight (g), α is the conversion coefficient for CO2 mass (12/44, from CO2 to C), and β is a conversion coefficient of time from seconds to hours (3600) (He et al., 2013; Li et al., 2017; Liu et al., 2017).
Here, Rt = Rs + Rg where, Rg and Rs are the respiration rates from glucose addition and SOM decomposition, respectively. Rg and Rs were calculated using Eq. 5 and Eq. 6 (Blaud et al., 2012):
Rg = fglucose × Rt (5)
Rs = Rt-Rg (6)
2.4.5 Characterization of the pulse effects of glucose addition
To more accurately depict the dynamic curves of Rt, Rg, and Rs, five parameters: R-max, TR-max, ½ R-max, T1/2R-max, and duration, were selected to assess the response of soil microbes to external glucose addition at different temperatures (Wang et al., 2016). R-max was defined as the maximum value of Rg, Rt, and Rs (mg C g-1 d-1); TR-max was the time required to reach Rg-max (min); 1/2R-max was the half-maximum of Rg, Rt, and Rs (mg C g-1 d-1); and 1/2TR-max was half the time required to reach 1/2Rg-max, 1/2Rt-max, and 1/2Rs-max (mg C g-1 d-1). Duration was defined as the time required reaching R-max from 1/2R-max, which is the duration of the pulse effect (h).
2.4.6 Calculation of C accumulation of CO2 release
The C accumulation of CO2 released was defined as the amount of C released by soil microbes during the test experiment (μg C g-1 soil). The accumulative emission during the 48 h incubation was calculated according to Eq. (7):
Ct-48 =$~\frac{\mathop{\sum }_{48}\frac{{{R}_{ti}}+{{R}_{ti+1}}}{2}~\times ({{t}_{i+1}}-{{t}_{i}})}{m}$ (7)
Where, Ct-48 is the cumulative C emission during the 48-h incubation, Rti and Rti + 1 are the respiration rates at different measurement times: ti and ti + 1, and m is the weight of dry soil.
2.4.7 Calculation of absolute changes in Rt, Rg/Rs, Rg/Rt, and ΔRs/Rt
To analyze the effect of temperature on the ability of microbes to use C sources at the substrate sufficient stage, we calculated the absolute changes in RtRt), Rg/RsRg/Rs), Rg/RtRg/Rt), and Rs/RtRs/Rt) on the first nine points of Rt, Rg/Rs, ΔRg/Rt, and ΔRs/Rt at each temperature.
One-way analysis of variance (ANOVA) with the least significant difference test (t-test) was used to compare the difference in the C accumulation of Rt, Rg, and Rs at different temperatures, and the differences in R-max, T R-max, 1/2R-max, T1/2R-max, and duration were conducted using SPSS software (P < 0.05) (IBM Inc., Chicago, IL, USA).

3 Results

3.1 Changes in Rt, Rg, and Rs at different temperatures

Rt, Rg, and Rs showed unimodal curves (Fig. 1); i.e., increased rapidly for 60-70 minutes, reached the peak, and declined rapidly thereafter. Rt-max, Rg-max, and Rs-max increased with increasing the temperature. Rt, Rg, and Rs had not stabilized (which means the variation rate of respiration rate approaching zero) within 48 h at 7°C. Rt stabilized within the shortest time at 25°C in all five temperatures. Rt, Rg, and Rs of the other experimental temperatures were lower than those of at 25°C (Fig. 2).
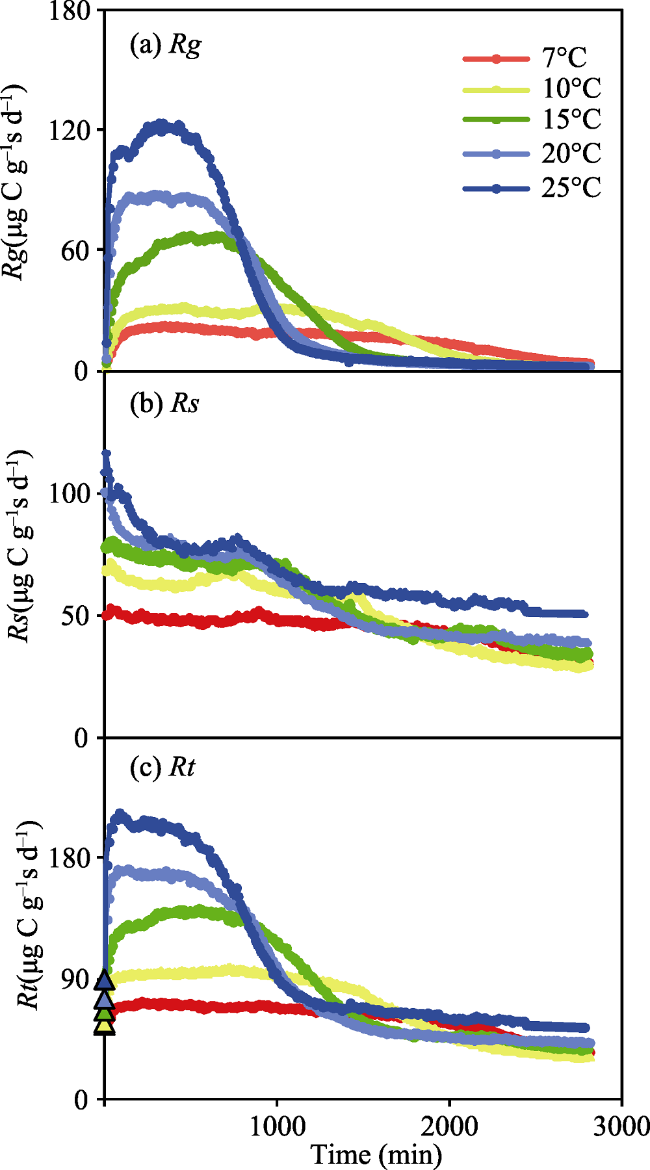
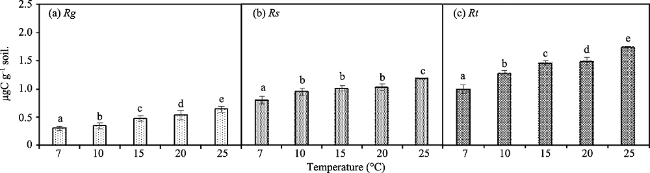
Fig. 1 Changes in the respiration rate using glucose (Rg, (a)) and soil organic matter (Rs, (b)), and the total respiration rate (Rt, (c)) in a glucose addition treatment conducted at a minute scale.
Note: Here, Rt = Rg + Rs; triangular symbols represent the data points of the initial respiration rate without glucose addition.
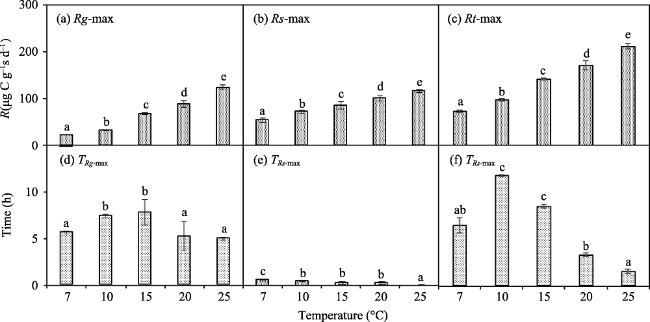
Fig. 2 The Rg-max, Rs-max, Rt-max, TRg-max, TRs-max, and TRt-max at different temperatures.
Note: Rg-max, Rs-max, Rt-max represent the maximum value of glucose soil respiration rate within the 48 h test period, soil organic matter respiration rate, and total soil respiration rate, respectively; TRg-max, TRs-max, and TRt-max represent the time required to reach the Rg-max, Rs-max, and Rt-max, respectively, after glucose addition. Columns with the same lowercase letters are not significantly different at the P < 0.05.

3.2 Characters for the curves of soil respiration under pulse glucose addition

Rt-max gradually increased with an increase in temperature, and there was a significant difference in Rt-max between the five temperatures (P < 0.05). Rt-max was 73.4 ± 2.9 mg C g-1 d-1 (n = 3) at 25°C, except at 7°C, where the time required to reach Rt-max decreased. The time needed to reach the maximum differed significantly between 10, 15, 20, and 25°C (P < 0.05) (Fig. 3c). Furthermore, the trend of Rg and Rs was similar to that of Rt in response to the temperature changes. At 7°C, Rg-max and Rs-max were 23.3 ± 0.8 and 54.0 ± 4.1 mg C g-1 d-1, respectively, and at 25°C, Rg-max and Rs-max were 125.6 ± 5.1 and 117.3 ± 3.0 mg C g-1 d-1, respectively (Fig. 4a, b).
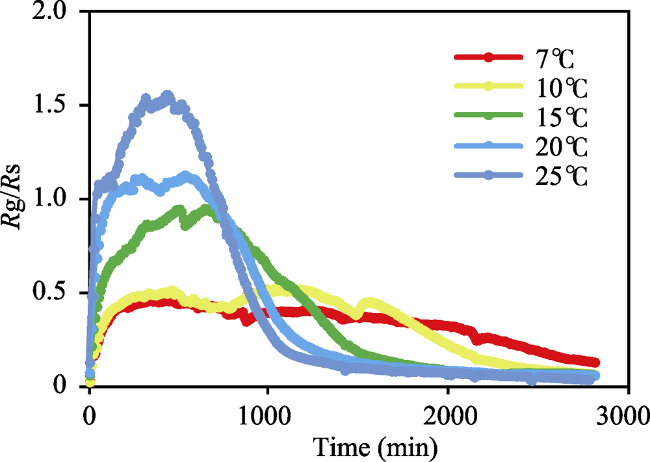
Fig. 3 The changing trend for the ratio of Rg/Rs at different incubation temperatures
Note: Rg, the respiration rate while using glucose as the respiratory substrate; Rs, the respiration rate while using soil organic matter as the respiratory substrate.
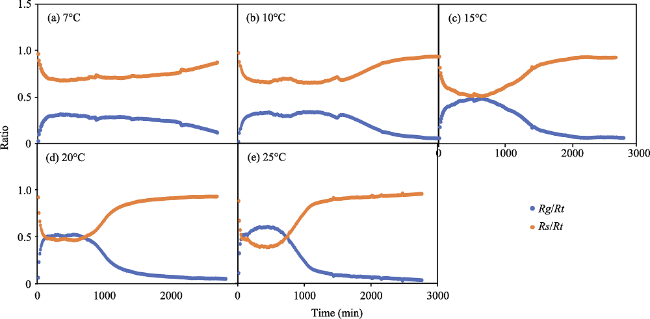
Fig. 4 Changes in the ratio of Rg/Rt and Rs/Rt at different incubation temperatures
Note: Rg, the respiration rate while using glucose as the respiratory substrate; Rs, the respiration rate while using soil organic matter as the respiratory substrate; Rt = Rg + Rs.
The 1/2Rg-max and 1/2 Rs-max increased significantly with increasing temperature (P < 0.05). However, T1/2Rg-max decreased significantly with increasing temperature (P < 0.05). Except for 7°C, the 1/2Rs-max value was not reached during the 48 h incubation period. For the remaining four temperatures, T1/2Rs-max decreased significantly with increasing temperature (P < 0.05).
The 1/2Rt-max increased gradually with increasing temperature, and was significantly different among temperatures (P < 0.05). The time taken to reach 1/2Rt-max decreased significantly with the increase in temperature (P < 0.05). At 7°C, the 1/2Rt-max was 36.7 ± 1.8 mg C g-1 d-1 (n = 3) and the T1/2Rt-max was 44.8 ± 3.0 h; however, at 25°C, the 1/2Rt-max was 107.0 ± 3.8 mg C g-1 d-1 and the T1/2Rt-max was 15.1 ± 0.5 h.
At 7°C, Rs-duration had not been observed (higher than 1/2Rs-max) during the 48 h measurement period; therefore, the duration of Rs at 7°C was unavailable. The duration of Rg and Rs gradually decreased with the increase in temperature (i.e., at the other four experimental temperatures), but the duration of Rt was the shortest at 15°C.

3.3 Changes in the ratios: Rg/Rs, Rg /Rt, Rs /Rt, at different temperatures

The ratio Rg/Rs gradually increased with an increase in temperature, and the time taken to reach stabilization gradually became shorter (Fig. 3). At 7°C, the ratio of Rg/Rs-max was 0.5 ± 0.03 (n=3); however, at 25°C, it was 1.6 ± 0.02, which means that glucose as the main substrate of respiration before reaching the Rg/Rs-max.
At all temperatures, Rg/Rt increased at the early stage. With prolonged incubation, the rate of this increase gradually slowed and tended to stabilize. However, Rs/Rt first decreased and then increased to reach a stable value (Fig. 4).

3.4 Changes in C accumulation at different temperatures

The C accumulation, indicated by Rt, Rg, and Rs, increased with an increase in temperature, and the difference was significant among the different temperatures (P < 0.05). At 7°C and 25°C, the C accumulations were 1.0 ± 0.08 (n=3), 0.3 ± 0.04, and 0.7 ± 0.07 mg C g-1 soil and 1.7 ±0.01, 0.6 ± 0.05, and 1.1± 0.01 mg C g-1 soil for Rt, Rg, and Rs, respectively (Fig. 5).
Fig. 5 The accumulation of C emission from Rg, Rs, and Rt within 48 h at different temperatures.
Note: Rt, total soil respiration rate; Rg, the respiration rate while using glucose as the respiratory substrate; Rs, the respiration rate while using soil organic matter as the respiratory substrate. Columns with the same lowercase letters are not significantly different at the P < 0.05 level.

3.5 Effect of temperature on ΔRt, ΔRg, ΔRg/Rs, Rg/Rt, and ΔRs/Rt under conditions with adequate substrate

For the first nine measured points (the phase of adequate substrate), we found that Δ Rt, Δ Rg, ΔRg/Rs, ΔRg/Rt, and ΔRs/Rt fitted well to various temperatures (Fig. 6a, b, c; P < 0.05), which indicated the effect of incubation temperature on soil microbial utilization after the input of a new C source
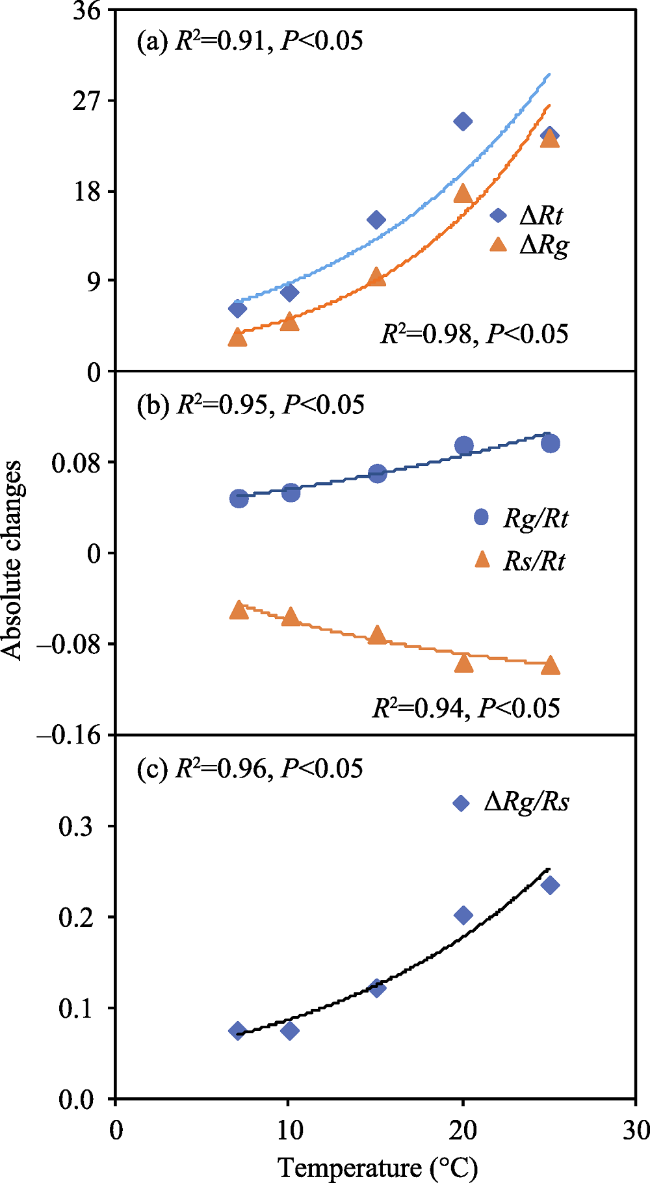
Fig. 6 The relationship of the absolute changes in Rt (ΔRt), RgRg), Rg/RtRg/Rt), Rs/RtRs/Rt), and Rg/RsRg/Rs) with temperature under adequate substrate supply.
Note: Rt, total soil respiration rate; Rg, the respiration rate while using glucose as the respiratory substrate; Rs, the respiration rate while using soil organic matter as the respiratory substrate; Rg/Rs, the ratio of Rg and Rs; Rg/Rt, the ratio of Rg and Rt; Rs/Rt, the ratio of Rs and Rt.

4 Discussion

4.1 Application and prospect of the continuous and automatic system for measuring SOM decomposition

In this study, we developed a continuous and automatic system for the measurement of CO2 and δ13C under various temperatures, which may have wide applications in studies on SOM turnover and microbial responses to rapid pulse resources. Traditionally, IRMS and IRIS have been used to test isotopic value and provide an important foundation for studying isotopes. However, these two methods are slow and time-consuming, which are, therefore, insufficient and impractical for the assessment of rapid processes (Van Geldern and Barth, 2012), such as those that play important roles in SOM turnover or soil C cycles, particularly in response to pulse phenomena of precipitation and nutrient addition (Schulze et al., 2006). The novel system used in this study is able to test each incubation bottle in 3 min, and thus provides a rapid approach. A test of reproducibility using three randomly selected groups of duplicate data of Rt at 15°C (Fig. 7) showed that there was a significantly linear correlation, and that all R2 values were greater than 0.9 (P < 0.05). Based on the diagram (Fig. 7), each repeated curve was almost completely synchronized with the others. This indicated that the continuous and automatic measurement system of 12CO2 and δ13C was stable under variable temperatures.
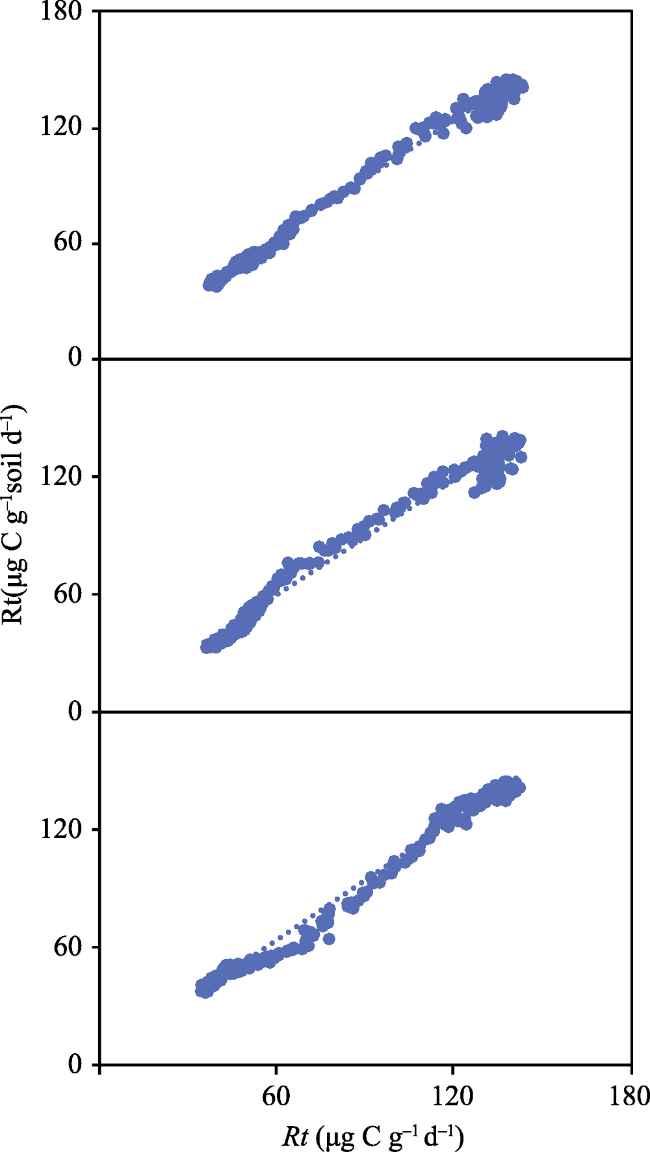
Fig. 7 Correlation test of three groups of repeated data
Moreover, this system can be applied to studies involving the soil priming effect and rainfall pulse effect in nature. The response of microbes to pulse phenomena is a rapid process, and it is therefore difficulty to capture it. For example, the effects of sudden rainfall events on soil microbial respiration in arid or semi-arid ecosystems is rapid and strong,and the peak of respiration rate can be observed 10-20 min after simulating rainfall (Wang et al., 2016). Furthermore, some changes in land-use or vegetation transformation from evergreen broad-leaved forests to artificial deciduous forests may alter the seasonal dynamics of litter input and affect the soil C cycle to some extent. The alteration of SOM input can result in a substantial effect on soil respiration (Sawada et al., 2016). This device can simulate the process of change in microbial respiration rate and separate the utilization strategies of SOM by microbes for external SOM input and initial SOM, which provides new insights into these rapid processes. If the incubation experiments and the interval of measurements are prolonged, and in addition to the contribution of the parameters of CO2 and δ13C, the new system may be used to explore the traditional priming effect with low-cost and high efficiency, which has been a hot topic in recent years (Dijkstra et al., 2006).
In addition to PRI-8800 (He et al., 2013; Song et al., 2017; Liu et al., 2018), the PICARRO isotope tester is one of the main instruments used in this system, which requires the strict control of water content in the whole system. To ensure the normal functioning of the PICARRO isotope tester, less than 3% water content is recommended. This drawback can be solved with further development of the PICARRO isotope tester.

4.2 Divergent response of soil microbes to different C sources

The responses of soil respiration to glucose addition, i.e., Rg, Rs, and Rt, were rapid and strong. Soil microbes prioritize the utilization of the newly inputted C sources because they enhance the availability of active organic matter. When the soil environment is favorable in terms of temperature, moisture, and soil physical and chemical properties, an increase in the amount of easily decomposed SOM can stimulate soil microbial growth (Lundquist et al., 1999; Lipson et al., 2000). According to stoichiometric principles, when a soil microbe decomposes SOM, it needs to assimilate one portion of nitrogen to form its own cell body when assimilating five portions of C to maintain its internal C:N ratio (5:1). For the assimilation (absorption and utilization) of one portion of C, four portions SOC will be consumed in order to obtain energy. Therefore, 25 portions of SOC are consumed by microbial absorption to gain one portion of nitrogen. The increase in the number of soil microbes, which obtain more nutrients by increasing the secretion of extracellular enzymes, therefore, results in rapid, excess CO2 emissions (Deng et al., 2016).
In addition to the requirement of nutrient elements and energy, microbial adaptation to the environment is important. Some microbes are able to use a small proportion of energy to maintain their cellular metabolism in a "metabolically alert" state, which is usually referred to as the potential active state (De Nobili et al., 2001). Soil microbes can respond more quickly to the input of new substrates in such a state than soil microbes in a dormant state. When fresh SOM is added to the soil, "hungry" microbes quickly obtain nutrients from the addition, and “potential” state soil microbes rapidly convert to “active” state soil microbes to obtain the new SOM (Moorekucera and Dick, 2008). It is important for soil microbes to prioritize the utilization of exogenous SOM and respond quickly to the additions.
Furthermore, soil microbes with different growth strategies determine the rapid response to some extent. (Fontaine et al., 2003) divided soil microbes into two categories: microorganisms with an r-selected growth strategy (mainly bacteria) and those with a k-selected growth strategy. Microorganisms with the r-selected growth strategy use only exogenous fresh and unstable SOM to achieve rapid growth in a short period, and are unable to secrete extracellular enzymes to decompose more complex organic components, such as plant branches with high lignin content. Microorganisms with the k-selected growth strategy can utilize complex SOM to meet their growth and development requirements. When water-soluble SOM of small molecules enter soil, microorganisms with the r-selected growth strategy first utilize these easily degradable molecules for their rapid growth and turnover (Paterson et al., 2007; Moorekucera and Dick, 2008), which is accompanied by a rapid increase in microbial biomass in the short term. When this decomposable SOM is depleted, the microorganisms with the k-selected growth strategy secrete the intrinsic SOM by extracellular enzyme decomposition and continue to grow and reproduce. Recently, Yan et al. (2018) showed that different plant litter forms result in different soil microbial community structures that drive different litter decomposition patterns and have different soil C sequestration capacities.

4.3 Temperature affects the utilization strategies of soil microbes for different C sources

Our study provided the first experimental evidence that temperature can largely affect the utilization strategy of microorganisms for different C sources, i.e., Rg/Rs, in response to glucose addition. Other studies have demonstrated the effects of temperature on Rs. For example, when soil temperature increases, Rs increases (Ise et al., 2006), and they are tended to the studies of temperature sensitivity (Q10) (Mu et al., 2016). The effect of temperature on Rs is mainly due to the change in the activity of extracellular enzymes (Li et al., 2015; Xu et al., 2015), because enzyme activity is mainly controlled by temperature. When the temperature is much higher or much lower than the enzyme optimal temperature, enzyme activity can decrease or even cease (Kempner and Haigler, 1982).
In the present study, the response curves of Rg/Rt and Rs/Rt in the glucose addition treatments were different at different temperatures. There was no intersection between Rg/Rt and Rs/Rt at 7°C, indicating that under low temperature, microbes cannot utilize the added glucose completely, but only selectively utilize some decomposable SOM. Furthermore, Rt, Rg, and Rs were significantly low at 7°C; therefore, it appeared that the decrease in extracellular enzyme activity at low temperature led to the decrease in microbial activity (Wildung et al., 1975), and that microbes ensure their own normal growth and, therefore, do not need to allocate more energy for nutrient absorption (Pietikainen et al., 2005). The enzyme activity of soil microbes was gradually restored with an increase in temperature, and there were two intersections in both the curves at 20°C and 25°C. The first intersection at the beginning of the curves in the 20°C and 25°C incubation experiments indicated the absorption and utilization of the additional C source (glucose) by the microorganisms. After the external C source had been gradually depleted, a second set of intersection points became evident, which indicated when microbes began using the intrinsic SOM as the main respiratory substrate. In this study, we found there to be an exponential relationship between ΔRt and temperature at sufficient stages of substrate utilization (R = 0.93, P < 0.05). These relationships not only represented the effect of temperature on the utilization strategy of microorganisms for different C sources, but also provided novel insights for evaluating and predicting the effects of future seasonal temperature changes or climate change on SOM turnover. Moreover, the effects of temperature on the intensity of the microbial respiratory response and the ratio of Rg/Rs should be incorporated into future ecological models to improve the accuracy of their predictions.

5 Conclusions

Soil microbial respiration rapidly and strongly responds to some pulses, such as available SOM or water input from precipitation. During the pulse processes, initial SOM can be decomposed by microbes to produce many available mineral nutrients and CO2. This emission of CO2 into the atmosphere is important consider when determining soil C sources and sinks, especially in arid and semi-arid ecosystems. In order to assess and better understand these processes, we developed a novel system that is capable of measuring 12CO2 and 13CO2 rapidly and synchronously under controlled incubation temperatures. In the present study, we provide a new approach for elucidating the changes in the utilization strategies of soil microbes of initial SOM and new SOM input. This novel system has potential applications in studies on SOM turnover and microbial responses to rapid pulse resources and priming effects, and unique improvements.
Interestingly, our findings showed that temperature controlled microbial utilization strategies for different C sources (glucose addition versus initial SOM); therefore, it is important to consider the effect of seasonal temperature or climate change on SOM turnover. Furthermore, the regular control of temperature on the response intensity and the composition ratio of respiration from newly inputted SOM and intrinsic SOM in the soil are important to incorporate into future ecological models to better understand and predict SOM turnover.

The authors have declared that no competing interests exist.

[1]
Baumann A, Schimmack W, Steindl H, et al.1996. Association of fallout radiocesium with soil constituents: effect of sterilization of forest soils by fumigation with chloroform.Radiation & Environmental Biophysics, 35(3): 229-233.

[2]
Bhattacharya S S, Kim K, Das S, et al.2016. A review on the role of organic inputs in maintaining the soil carbon pool of the terrestrial ecosystem.Journal of Environmental Management, 167(167): 214-227.

[3]
Blaud A, Lerch T Z, Chevallier T, et al.2012. Dynamics of bacterial communities in relation to soil aggregate formation during the decomposition of 13C-labelled rice straw.Applied Soil Ecology, 53(1): 1-9.

[4]
Brand W A.2010. Comments on “Discrepancies between isotope ratio infrared spectroscopy and isotope ratio mass spectrometry for the stable isotope analysis of plant and soil waters”.Rapid Communications in Mass Spectrometry, 24(17): 2687-2688.

[5]
Cable J M, Ogle K, Williams D G, et al, 2008. Soil texture drives responses of soil respiration to precipitation pulses in the sonoran desert: implications for climate change.Ecosystems, 11(6): 961-979.

[6]
Chamberlain P M, Bull I D, Black H I, et al.2006. Collembolan trophic preferences determined using fatty acid distributions and compound- specific stable carbon isotope values.Soil Biology & Biochemistry, 38(6): 1275-1281.

[7]
Cui M Y, Caldwell M M.1997. A large ephemeral release of nitrogen upon wetting of dry soil and corresponding root responses in the field.Plant and Soil, 191(2): 291-299.

[8]
Daniel R M, Danson M J.2010. A new understanding of how temperature affects the catalytic activity of enzymes.Trends in Biochemical Sciences, 35(10): 584-591.

[9]
Daniel R M, Danson M J, Eisenthal R, et al.2001. The temperature optima of enzymes: a new perspective on an old phenomenon.Trends in Biochemical Sciences, 26(4): 223-225.

[10]
Davidson E A, Janssens I A.2006. Temperature sensitivity of soil carbon decomposition and feedbacks to climate change.Nature, 440(7081): 165-173.

[11]
De Nobili M, Contin M, Mondini C, et al.2001. Soil microbial biomass is triggered into activity by trace amounts of substrate.Soil Biology & Biochemistry, 33(9): 1163-1170.

[12]
De Troyer I, Amery F, Van Moorleghem C, et al.2011. Tracing the source and fate of dissolved organic matter in soil after incorporation of a 13C labelled residue: A batch incubation study.Soil Biology & Biochemistry, 43(3): 513-519.

[13]
Deng Q, Cheng X L, Hui D F, et al.2016. Soil microbial community and its interaction with soil carbon and nitrogen dynamics following afforestation in central China.Science of The Total Environment, 541: 230-237.

[14]
Dijkstra F A, Cheng W, Johnson D W, et al.2006. Plant biomass influences rhizosphere priming effects on soil organic matter decomposition in two differently managed soils.Soil Biology & Biochemistry, 38(9): 2519-2526.

[15]
Fontaine S, Mariotti A, Abbadie L, et al.2003. The priming effect of organic matter: a question of microbial competition?Soil Biology & Biochemistry, 35(6): 837-843.

[16]
Gallaher R N, Weldon C O, Boswell F C.1976. A semiautomated procedure for total nitrogen in plant and soil samples. Soil Science Society of America Journal, 40(6): 887-889.

[17]
Gregorich E G, Beare M H, Stoklas U, et al.2003. Biodegradability of soluble organic matter in maize-cropped soils.Geoderma, 113(3): 237-252.

[18]
He N P, Wang R L, Gao Y, et al.2013. Changes in the temperature sensitivity of SOM decomposition with grassland succession: implications for soil C sequestration.Ecology & Evolution, 3(15): 5045-5054.

[19]
Ise T, Moorcroft P R.2006. The global-scale temperature and moisture dependencies of soil organic carbon decomposition: an analysis using a mechanistic decomposition model.Biogeochemistry, 80(3):217-231.

[20]
Kempner E S, Haigler H T.1982. The influence of low temperature on the radiation sensitivity of enzymes.Journal of Biological Chemistry, 257(22): 13297-13299.

[21]
Kendall C, Silva S R, Kelly V J, et al.2001. Carbon and nitrogen isotopic compositions of particulate organic matter in four large river systems across the United States.Hydrological Processes, 15(7): 1301-1346.

[22]
Lee P S, Majkowski R F.1986. High resolution infrared diode laser spectroscopy for isotope analysis—Measurement of isotopic carbon monoxide.Applied Physics Letters, 48(10): 619-621.

[23]
Leis H J, Gleispach H, Malle E.1988. A convenient route to stable-isotope- labelled compounds for use in quantitative gas chromatography/mass spectrometry.Rapid Communications in Mass Spectrometry, 2(12): 263-265.

[24]
Li J, He N P, Wei X H, et al.2015. Changes in temperature sensitivity and activation energy of soil organic matter decomposition in different Qinghai-Tibet Plateau grasslands.Plos One, 10(7): 1-14.

[25]
Li J, He N P, Xu L, et al.2017. Asymmetric responses of soil heterotrophic respiration to rising and decreasing temperatures.Soil Biology & Biochemistry, 106(1): 18-27.

[26]
Lipson D A, Schmidt S K, Monson R K, et al.2000. Carbon availability and temperature control the post-snowmelt decline in alpine soil microbial biomass.Soil Biology & Biochemistry, 32(4): 441-448.

[27]
Liu E, Wang J, Zhang Y, et al.2015. Priming effect of (13) C-labelled wheat straw in no-tillage soil under drying and wetting cycles in the Loess Plateau of China.Scientific Reports, 5(1): 13826-13826.

[28]
Liu Y, He N P, Zhu J X, et al.2017. Regional variation in the temperature sensitivity of soil organic matter decomposition in China's forests and grasslands. Global Change Biology, 23(8): 3393-3402.

[29]
Liu Y, Wen X F, Zhang Y H, et al.2018. Widespread asymmetric response of soil heterotrophic respiration to warming and cooling.Science of the Total Environment, 635: 423-431.

[30]
Lloyd J, Taylor J A.1994. On the temperature dependence of soil respiration. Functional Ecology, 8(3): 315-323.

[31]
Lundquist E J, Jackson L E, Scow K M, et al.1999. Wet-dry cycles affect dissolved organic carbon in two California agricultural soils.Soil Biology & Biochemistry, 31(7): 1031-1038.

[32]
Moore-Kucera J, Dick R P, 2008. Application of 13C-labeled litter and root materials for in situ decomposition studies using phospholipid fatty acids. Soil Biology & Biochemistry, 40(10): 2485-2493.

[33]
Mu C C, Zhang T J, Zhang X, et al.2016. Sensitivity of soil organic matter decomposition to temperature at different depths in permafrost regions on the northern Qinghai-Tibet Plateau.European Journal of Soil Science, 67(6): 773-781.

[34]
Nelson D W, Sommers L E, Sparks D L, et al.1996. Total carbon, organic carbon, and organic matter.Methods of Soil Analysis, 9(6): 961-1010.

[35]
Paterson E, Gebbing T, Abel C, et al.2007. Rhizodeposition shapes rhizosphere microbial community structure in organic soil.New Phytologist, 173(3): 600-610.

[36]
Phillips J D, Marion D A.2007. Soil geomorphic classification, soil taxonomy, and effects on soil richness assessments.Geoderma, 141(1-2): 89-97.

[37]
Pietikainen J, Pettersson M, Baath E, et al.2005. Comparison of temperature effects on soil respiration and bacterial and fungal growth rates.FEMS Microbiology Ecology, 52(1): 49-58.

[38]
Reid J, Adair E C, Hobbie S E, et al.2012. Biodiversity, nitrogen deposition, and CO2 affect grassland soil carbon cycling but not storage.Ecosystems, 15(4): 580-590.

[39]
Sawada K, Funakawa S, Kosaki T, et al.2016. Short-term respiration responses to drying-rewetting in soils from different climatic and land use conditions.Applied Soil Ecology, 103: 13-21.

[40]
Schaeffer S M, Evans R D.2005. Pulse additions of soil carbon and nitrogen affect soil nitrogen dynamics in an arid Colorado Plateau shrubland.Oecologia, 145(3): 425-433.

[41]
Schulze E D, Turner N C, Nicolle D, et al.2006. Leaf and wood carbon isotope ratios, specific leaf areas and wood growth of Eucalyptus species across a rainfall gradient in Australia.Tree Physiology, 26(4): 479-492.

[42]
Schwinning S, Sala O E.2004. Hierarchy of responses to resource pulses in arid and semi-arid ecosystems.Oecologia, 141(2): 211-220.

[43]
Shahbaz M, Kumar A, Kuzyakov Y, et al.2018. Priming effects induced by glucose and decaying plant residues on SOM decomposition: A three- source 13C/ 14C partitioning study.Soil Biology & Biochemistry, 121: 138-146.

[44]
Shi A, Marschner P.2014. Drying and rewetting frequency influences cumulative respiration and its distribution over time in two soils with contrasting management.Soil Biology & Biochemistry, 72: 172-179.

[45]
Song X L, Zhu J X, He N P, et al.2017.Asynchronous pulse responses of soil carbon and nitrogen mineralization to rewetting events at a short-term: Regulation by microbes.Scientific Reports, 7(1):7492.

[46]
Unger S, Cristina Máguas, Pereira J S, et al.2010. The influence of precipitation pulses on soil respiration - Assessing the “Birch effect” by stable carbon isotopes.Soil Biology & Biochemistry, 42(10): 1800-1810.

[47]
Van Geldern R, Barth J A.2012. Optimization of instrument setup and post-run corrections for oxygen and hydrogen stable isotope measurements of water by isotope ratio infrared spectroscopy (IRIS).Limnology and Oceanography-methods, 10(12): 1024-1036.

[48]
Wang Q, He N P, Liu Y, et al.2016. Strong pulse effects of precipitation events on soil microbial respiration in temperate forests.Geoderma, 275(1): 67-73.

[49]
Wang W, Liu W Q, Zhang T S, et al.2013. Measurements of stable isotopes in atmospheric CO2 and H2O by open-path Fourier transform infrared spectrometry.Spectroscopy & Spectral Analysis, 33(8): 2017-2023.

[50]
Wildung R E, Garland T R, Buschbom R L, et al.1975. The interdependent effects of soil temperature and water content on soil respiration rate and plant root decomposition in arid grassland soils.Soil Biology & Biochemistry, 7(6): 373-378.

[51]
Williams M A, Rice C W.2007. Seven years of enhanced water availability influences the physiological, structural, and functional attributes of a soil microbial community.Applied Soil Ecology, 35(3): 535-545.

[52]
Xu Z W, Yu G R, Zhang X Y, et al.2015. The variations in soil microbial communities, enzyme activities and their relationships with soil organic matter decomposition along the northern slope of Changbai Mountain.Applied Soil Ecology, 86(86): 19-29.

[53]
Yan J F, Wang L, Hu Y, et al.2018. Plant litter composition selects different soil microbial structures and in turn drives different litter decomposition pattern and soil carbon sequestration capability.Geoderma, 319(2): 194-203.

[54]
Yu X N, Huang Y M, Li E H, et al.2018. Effects of rainfall and vegetation to soil water input and output processes in the Mu Us Sandy Land, northwest China.Catena, 161(1): 96-103.

[55]
Zhang W D, Wang X F, Wang S L, et al.2013. Addition of external organic carbon and native soil organic carbon decomposition: a meta- analysis.Plos One, 8(2): 1-6.

Outlines

/