
Journal of Resources and Ecology >
Spatial Analysis of the Soil Carbon Sequestration Potential of Crop-residue Return in China Based on Model Simulation
Received date: 2018-10-22
Accepted date: 2018-12-10
Online published: 2019-03-30
Supported by
Foundation: The National Key Research and Development Program of China (2017YFC0503803)
General Program of National Natural Science Foundation of China (41571192)
The National Key Research and Development Program of China (2016YFA0600202)
Science and Technology Planning Project of Hebei, China (17390313D).
Copyright
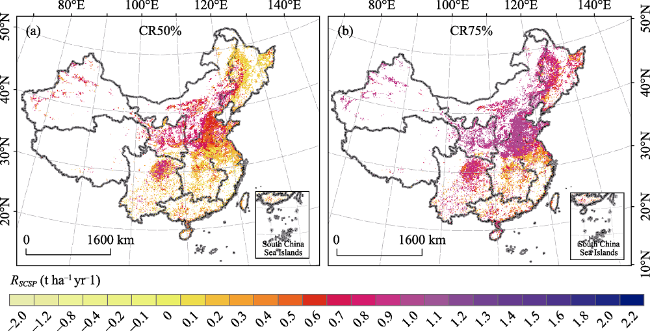
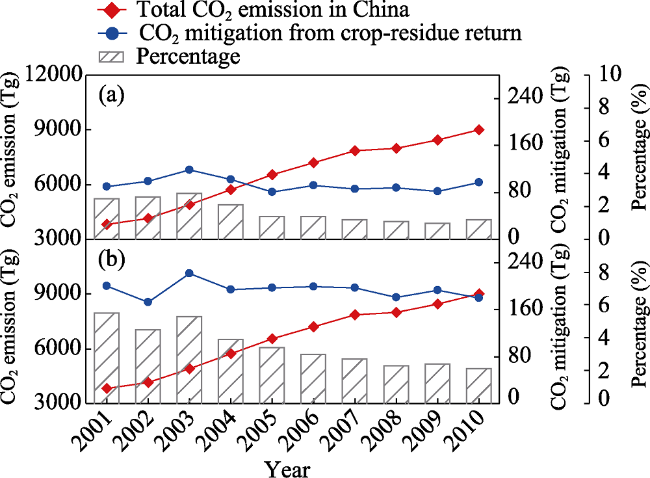
Crop-residue return is a recommended practice for soil and nutrient management and is important in soil organic carbon (SOC) sequestration and CO2 mitigation. We applied a process-based Environmental Policy Integrated Climate (EPIC) model to simulate the spatial pattern of topsoil organic carbon changes from 2001 to 2010 under 4 crop-residue return scenarios in China. The carbon loss (28.89 Tg yr-1) with all crop-residue removal (CR0%) was partly reduced by 22.38 Tg C yr-1 under the status quo CR30% (30% of crop-residue return). The topsoil in cropland of China would become a net carbon sink if the crop-residue return rate was increased from 30% to 50%, or even 75%. The national SOC sequestration potential of cropland was estimated to be 25.53 Tg C yr-1 in CR50% and 52.85 Tg C yr-1 in CR75%, but with high spatial variability across regions. The highest rate of SOC sequestration potential in density occurred in Northwest and North China while the lowest was in East China. Croplands in North China tended to have stronger regional SOC sequestration potential in storage. During the decade, the reduced CO2 emissions from enhanced topsoil carbon in CR50% and CR75% were equivalent to 1.4% and 2.9% of the total CO2 emissions from fossil fuels and cement production in China, respectively. In conclusion, we recommend encouraging farmers to return crop-residue instead of burning in order to improve soil properties and alleviate atmospheric CO2 rises, especially in North China.
CHEN Jinghua , WANG Shaoqiang , Florian KRAXNER , Juraj BALKOVIC , XU Xiyan , SUN Leigang . Spatial Analysis of the Soil Carbon Sequestration Potential of Crop-residue Return in China Based on Model Simulation[J]. Journal of Resources and Ecology, 2019 , 10(2) : 184 -195 . DOI: 10.5814/j.issn.1674-764X.2019.02.009
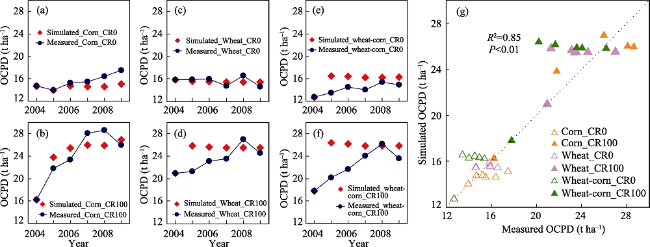
Fig. 1 Model validation through long-term experiment at Yucheng agricultural station |
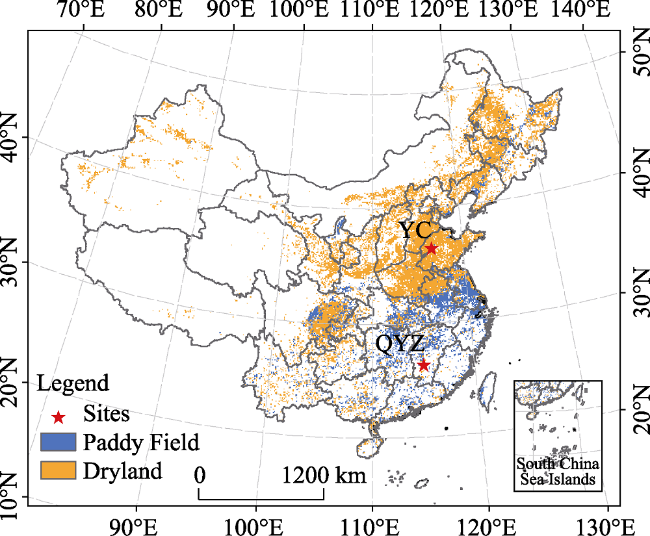
Fig. 2 The distribution map of cropland in China (2000) |
Table 1 Optimized crop parameters of wheat, corn and rice in the EPIC model |
| Parameter | Wheat | Corn | Rice | |||
|---|---|---|---|---|---|---|
| Default value | Optimized value | Default value | Optimized value | Default value | Optimized value | |
| HI | 0.45 | 0.47 | 0.5 | 0.55 | 0.2 | 0.5 |
| DMLA | 6 | - | 6 | 7 | 6 | - |
| DLAI | 0.6 | 0.5 | 0.8 | 0.6 | 0.8 | 0.9 |
| HMX (m) | 1 | - | 2 | 2.5 | 0.8 | - |
| RDMX (m) | 2 | - | 2 | 2.5 | 2 | - |
| WYSF | 0.21 | 0.2 | 0.4 | - | 0.25 | - |
Note: Abbreviations: HI, harvest index; DMLA, maximum potential leaf area index (LAI); DLAI, fraction of the growing season when LAI begins to decline; HMX, maximum crop height; RDMX, maximum root depth; WSYF, lower limit of harvest index. |
Table 2 Field management calendar for wheat-corn rotation and double-cropping rice system |
| Item | Date | |
|---|---|---|
| Wheat-corn rotation | Double-cropping rice | |
| Build furrow dikes | - | 20-Apr |
| Cultivate | - | 25-Apr |
| Plant | 24-Oct (wheat) | 25-Apr |
| Irrigate | 13-Mar | 2-May |
| Apply pesticide | 25-Mar | 20-May |
| Harvest | 15-Jun | 10-Jul |
| Cultivate | - | 31-Jul |
| Plant | 27-Jun (corn) | 1-Aug |
| Apply pesticide | 18-Jul | 20-Aug |
| Harvest | 2-Oct | 5-Nov |
Table 3 Annual residue yields and cultivated areas of wheat, corn and rice |
| Year | Total crop-residue (TCR, Mt) | Cultivated area (A, Mha) | Yield of crop-residue (CR, t ha-1) | |||||
|---|---|---|---|---|---|---|---|---|
| Wheat | Corn | Rice | Wheat | Corn | Rice | Dryland | Paddy field | |
| 2000 | 136.10 | 211.99 | 117.07 | 26.65 | 23.06 | 29.96 | 7.00 | 3.91 |
| 2001 | 128.23 | 228.18 | 110.63 | 24.66 | 24.28 | 28.81 | 7.28 | 3.84 |
| 2002 | 123.34 | 242.62 | 108.74 | 23.91 | 24.63 | 28.20 | 7.54 | 3.86 |
| 2003 | 118.14 | 231.66 | 100.09 | 22.00 | 24.07 | 26.51 | 7.59 | 3.78 |
| 2004 | 125.62 | 260.68 | 111.59 | 21.63 | 25.45 | 28.38 | 8.21 | 3.93 |
| 2005 | 133.13 | 278.76 | 112.87 | 22.79 | 26.36 | 28.85 | 8.38 | 3.91 |
| 2006 | 147.45 | 303.27 | 113.58 | 23.61 | 28.46 | 28.94 | 8.65 | 3.92 |
| 2007 | 149.31 | 304.60 | 115.90 | 23.72 | 29.48 | 28.92 | 8.53 | 4.01 |
| 2008 | 153.63 | 331.83 | 119.55 | 23.62 | 29.86 | 29.24 | 9.08 | 4.09 |
| 2009 | 156.88 | 327.71 | 121.79 | 24.29 | 31.18 | 29.63 | 8.74 | 4.11 |
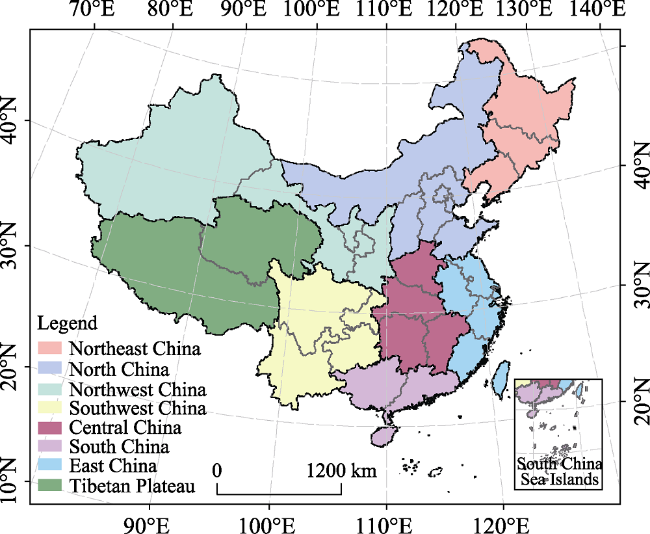
Fig. 3 Eight agricultural regions of China |
Table 4 The average and standard deviation (SD) of ROCPD in 8 agricultural regions under 4 crop-residue return scenarios |
| Region | CR0% | CR30% | CR50% | CR75% | ||||
|---|---|---|---|---|---|---|---|---|
| ROCPD (t C ha-1 yr-1) | SD | ROCPD (t C ha-1 yr-1) | SD | ROCPD (t C ha-1 yr-1) | SD | ROCPD (t C ha-1 yr-1) | SD | |
| Northeast China | -0.60 | 0.41 | -0.05 | 0.20 | 0.17 | 0.31 | 0.66 | 0.33 |
| North China | -0.19 | 0.30 | 0.03 | 0.14 | 0.56 | 0.30 | 0.94 | 0.19 |
| Northwest China | -0.15 | 0.23 | 0.05 | 0.14 | 0.61 | 0.32 | 0.95 | 0.21 |
| Southwest China | -0.51 | 0.57 | -0.20 | 0.52 | 0.14 | 0.62 | 0.46 | 0.63 |
| Central China | -0.34 | 0.41 | -0.09 | 0.27 | 0.19 | 0.37 | 0.51 | 0.49 |
| South China | -0.48 | 0.70 | -0.30 | 0.58 | -0.07 | 0.60 | 0.18 | 0.67 |
| East China | -0.42 | 0.40 | -0.13 | 0.25 | 0.07 | 0.28 | 0.36 | 0.44 |
| Tibetan Plateau | -0.39 | 0.41 | 0.00 | 0.30 | 0.48 | 0.43 | 0.84 | 0.37 |
| Total China | -0.37 | 0.45 | -0.07 | 0.31 | 0.29 | 0.45 | 0.65 | 0.48 |
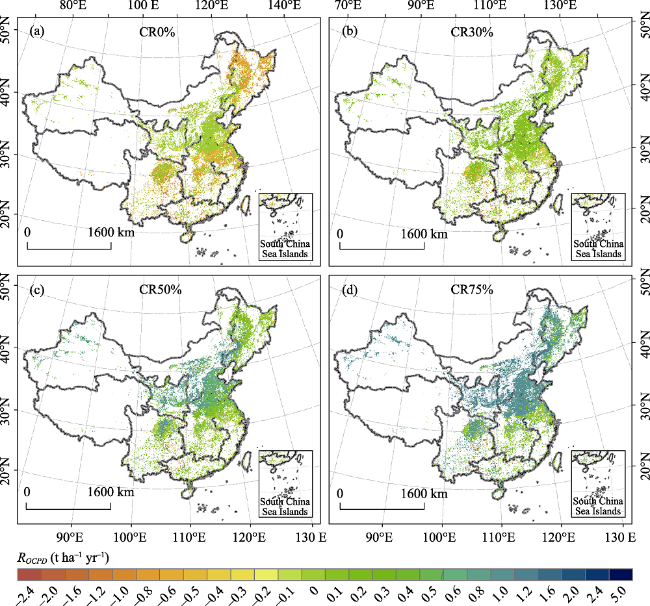
Fig. 4 The spatial pattern of ROCPD under (a) CR0%, the baseline scenario, (b) CR30%, the status quo scenario, (c) CR50% and (d) CR75%, the potential scenarios. |
Table 5 The SOC sequestration potentials in 8 agricultural regions under CR50% and CR75% |
| Region | Cropland type | Area (Mha) | RSCSP (t C ha-1 yr-1) | SCSP (Tg C yr-1) | ||
|---|---|---|---|---|---|---|
| CR50% | CR75% | CR50% | CR75% | |||
| Northeast China | Paddy field | 3.20 | 0.04 | 0.41 | 0.14 | 1.30 |
| Dryland | 7.90 | 0.24 | 0.76 | 1.93 | 5.98 | |
| North China | Paddy field | 0.32 | 0.14 | 0.72 | 0.04 | 0.23 |
| Dryland | 15.98 | 0.54 | 0.91 | 8.64 | 14.56 | |
| Northwest China | Paddy field | 0.28 | 0.12 | 0.57 | 0.03 | 0.16 |
| Dryland | 5.61 | 0.59 | 0.92 | 3.28 | 5.17 | |
| Southwest China | Paddy field | 4.52 | 0.11 | 0.43 | 0.49 | 1.92 |
| Dryland | 6.12 | 0.44 | 0.76 | 2.67 | 4.66 | |
| Central China | Paddy field | 9.40 | 0.10 | 0.26 | 0.93 | 2.44 |
| Dryland | 9.28 | 0.43 | 0.87 | 3.97 | 8.08 | |
| South China | Paddy field | 4.65 | 0.12 | 0.29 | 0.54 | 1.37 |
| Dryland | 0.71 | 0.33 | 0.68 | 0.24 | 0.48 | |
| East China | Paddy field | 6.36 | 0.12 | 0.31 | 0.78 | 1.99 |
| Dryland | 5.32 | 0.33 | 0.82 | 1.76 | 4.36 | |
| Tibetan Plateau | Paddy field | 0.00 | 0.18 | 0.45 | 0.00 | 0.00 |
| Dryland | 0.17 | 0.49 | 0.85 | 0.08 | 0.14 | |
| Total China | Paddy field | 28.73 | 0.11 | 0.34 | 2.95 | 9.41 |
| Dryland | 51.08 | 0.44 | 0.85 | 22.58 | 43.44 | |
| Total cropland | 79.81 | 0.36 | 0.72 | 25.53 | 52.85 | |
Fig. 5 The spatial pattern of RSCSP under (a) CR50% for converting burning crop-residues in the field to return and (b) CR75% for converting burning crop-residues both in the field and as household fuel to return |
Fig. 6 The contribution of CO2 mitigation by the increasing crop-residue return rate from 30% to 50% (a) and 75% (b) |
Table 6 Estimated SOC sequestration potential of China’s croplands from different investigators |
| Scenarios | SOC sequestration potential | Methods | Reference | |
|---|---|---|---|---|
| C storage (Tg C yr-1) | C density (t C ha-1 yr-1) | |||
| CR40%-CR90% | 36.8 | 0.28 | Meta-analysis | Sun et al., 2010 |
| CR100% | 48.2-56.2 | - | Meta-analysis | Lu, 2015 |
| CR15%-CR50% | 54.69 | - | DNDC model | Tang et al., 2006 |
| CR25%- CR50% | 23.2 | - | GLO-PEM model and CEVSA model | Yan et al., 2007 |
| CR25%- CR100% | 57.1 | - | GLO-PEM model and CEVSA model | Yan et al., 2007 |
| CR50%(rice), CR95%(corn) | 42.23 | 0.397 | Statistical model | Han et al., 2008 |
| CR100% | 34.4 | 0.087-0.730 | Statistical model | Lu et al., 2009 |
| CR 4 t/ha | - | 0.275 | Field experiments | Lou et al., 2011 |
| CR 12.4 t/ha | - | 1.425 | Field experiments | Lou et al., 2011 |
| CR 3 t/ha + N fertilizer | - | 1.18 | Field experiments | Yang et al., 2015 |
| CR 3 t/ha + pig manure compost + N fertilizer | - | 1.27 | Field experiments | Yang et al., 2015 |
| CR30%-CR50% | 25.53 | 0.20-0.56 | EPIC model | This study |
| CR30%-CR75% | 52.85 | 0.48-0.91 | EPIC model | This study |
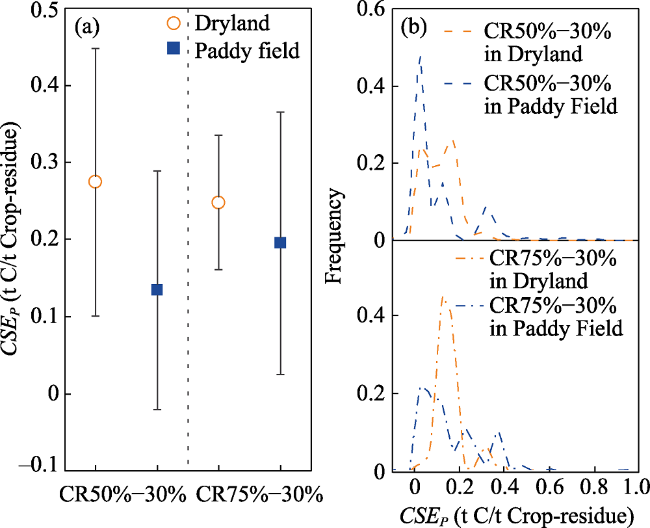
Fig. 7 The CSEp (a) and its frequency distribution (b) in dryland and paddy field under 2 potential return scenarios |
The authors have declared that no competing interests exist.
| [1] |
|
| [2] |
|
| [3] |
|
| [4] |
|
| [5] |
|
| [6] |
CAREI.2000. Strategic considerations for development and utilization of biological energy in China. Chinese Association for Rural Energy Industries. Beijing, 61pp. (in Chinese)
|
| [7] |
|
| [8] |
|
| [9] |
|
| [10] |
|
| [11] |
FAO. 2014. Food and Agricultural Organization of the United Nations.
|
| [12] |
|
| [13] |
|
| [14] |
|
| [15] |
|
| [16] |
|
| [17] |
|
| [18] |
|
| [19] |
|
| [20] |
|
| [21] |
|
| [22] |
|
| [23] |
|
| [24] |
|
| [25] |
|
| [26] |
|
| [27] |
|
| [28] |
|
| [29] |
|
| [30] |
|
| [31] |
|
| [32] |
|
| [33] |
|
| [34] |
|
| [35] |
|
| [36] |
|
| [37] |
|
| [38] |
|
| [39] |
|
| [40] |
NBSPRC (National Bureau of Statistics of the People’s Republic of China). China Rural Statistical Yearbook 2001/2002/2003/2004/2005/2006/ 2007/2008/2009/2010. Beijing: China Statistics Press. (in Chinese)
|
| [41] |
|
| [42] |
|
| [43] |
|
| [44] |
|
| [45] |
|
| [46] |
|
| [47] |
|
| [48] |
|
| [49] |
|
| [50] |
|
| [51] |
|
| [52] |
STEMOA, 2010. Survey and access report of national crop straw source. Department of Science and Technology and Education, Ministry of Agriculture of the People’s Republic of China.
|
| [53] |
|
| [54] |
|
| [55] |
|
| [56] |
|
| [57] |
The State Council of the People’s Republic of China. 2012. Circular of the State Council on Printing and Distributing the National Modern Agricultural Development Plan (2011-2015).
|
| [58] |
|
| [59] |
|
| [60] |
|
| [61] |
|
| [62] |
|
| [63] |
|
| [64] |
|
| [65] |
|
| [66] |
|
| [67] |
|
| [68] |
|
| [69] |
|
| [70] |
|
| [71] |
|
/
| 〈 |
|
〉 |