
Journal of Resources and Ecology >
Chinese Cropland Quality and Its Temporal and Spatial Changes due to Urbanization in 2000-2015
Received date: 2018-11-12
Accepted date: 2019-01-20
Online published: 2019-03-30
Supported by
National Key Research and Development Program of China (2017YFC0503803)
National Natural Science Foundation of China (41501428)
Humanities and Social Sciences Foundation of the Ministry of Education (16YJCZH098)
Copyright
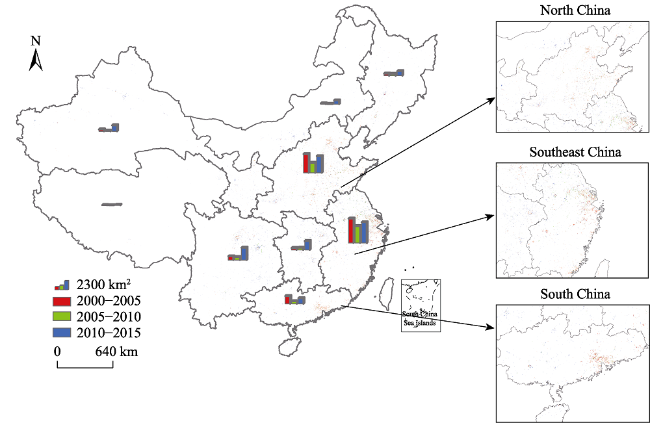
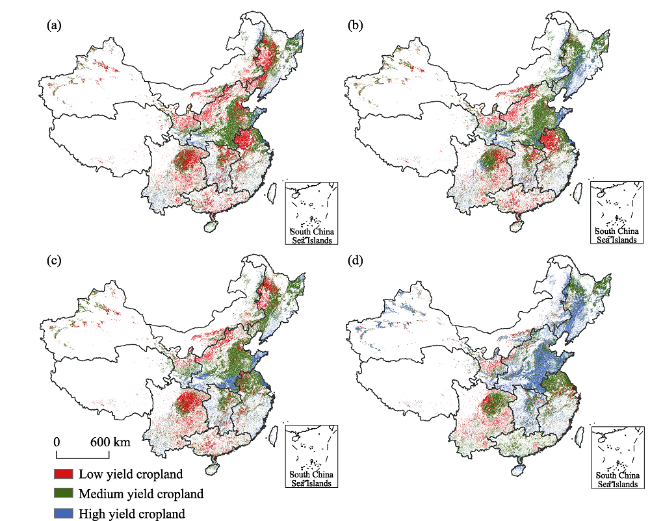
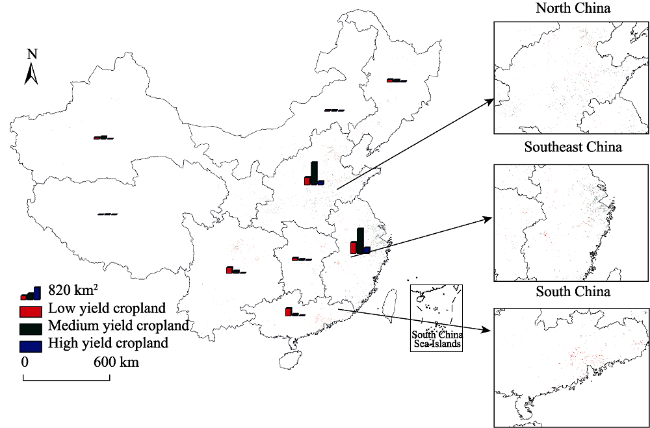
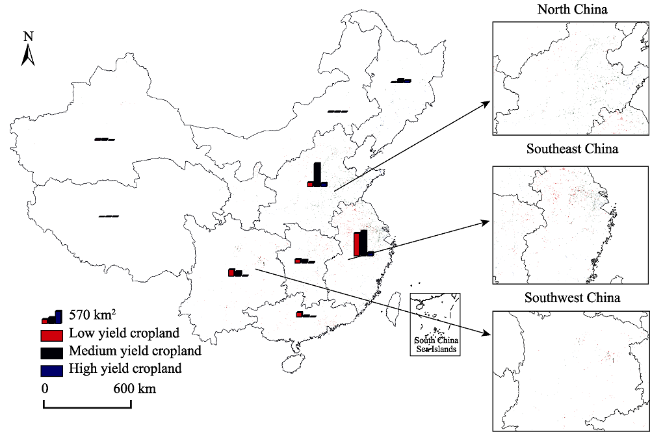
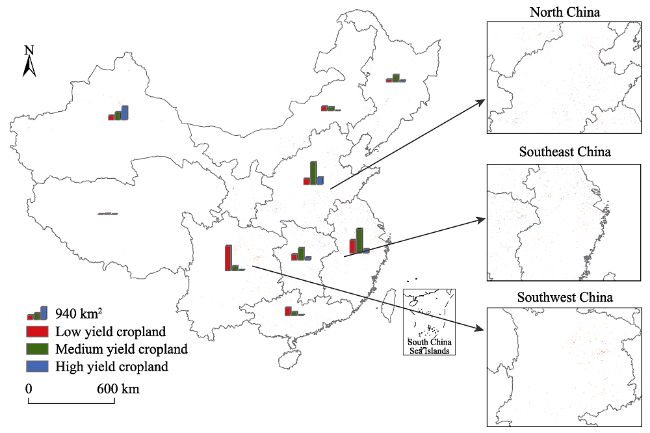
The acceleration of urbanization has led to the occupation of more cropland, especially higher quality cropland, which could pose a huge threat to food security and have other implications for the inadequate cropland resource supply in China. Though the spatial status of Chinese cropland quality has been assessed, its temporal changes since 2000 to 2015 are still not clear. An accumulated probability distribution method was used to determine the criteria of cropland quality using the net primary production data product (MOD17) from Moderate Resolution Imaging Spectroradiometer (MODIS). Then the cropland quality of higher, median and lower production was spatially mapped and its changes due to occupation by urbanization were analyzed through the land use changes (LUCC) data primarily from Landsat TM images in the three periods of 2000-2005, 2005-2010, and 2010-2015. The results showed that of the total cropland reduction area the proportion taken by urbanization increased from 47.29% in the early stage to 77.46% in the recent period. The quality of Chinese cropland was dominated by low- and medium-yield fields, accounting for 40.81% and 48.74%, respectively, with high-yield fields accounting for only 10.44% of the total cropland in the country in 2000. The high-yield areas have been seriously threatened by the expansion of construction land fields, with the ratio of high-yield area to total area occupied by urbanization increasing from 9.71% in 2000-2005 to 15.63% in 2010-2015. Spatially, this phenomenon has been moving from eastern and southern China to central and western China, especially in Northwest China where the ratio has arrived at the highest proportion, with 52.97% of high-yield cropland in the total land taken by the expansion by 2015. This study not only provides a method to assess cropland quality but also reveals the threatening trend from the expansion of urbanization on high-quality cropland. More attention should be paid to the latter in land use planning and policies made to prevent threats to food security from declines in both cropland quantity and quality.
WANG Chunyu , SUN Xiaofang , WANG Meng , WANG Junbang , DING Qingfu . Chinese Cropland Quality and Its Temporal and Spatial Changes due to Urbanization in 2000-2015[J]. Journal of Resources and Ecology, 2019 , 10(2) : 174 -183 . DOI: 10.5814/j.issn.1674-764X.2019.02.008
Table 1 The NPP (gC m-2 yr-1) criteria for defining higher, medium and lower yield cropland for the nine regions (climatic zones) in China |
| Region | Upper value of low-yield cropland | Lower value of high-yield cropland |
|---|---|---|
| Inner Mongolia | 165.46 | 273.98 |
| Northwest China | 188.36 | 387.18 |
| Tibetan Plateau | 164.53 | 372.79 |
| Southwest China | 587.89 | 878.65 |
| Central China | 427.35 | 560.24 |
| Northeast China | 245.20 | 365.19 |
| North China | 245.29 | 446.07 |
| Southeast China | 437.17 | 654.33 |
| South China | 541.82 | 873.34 |
Table 2 The net change of cropland area (km2) and the area of cropland occupied by construction land expansion (km2) and its proportion (%) from 2000 to 2015 |
| Region | Net change in cropland area (km2) | Cropland area occupied by construction land (km2) | Proportion of cropland occupied by construction land (%) | ||||||
|---|---|---|---|---|---|---|---|---|---|
| 2000-2005 | 2005-2010 | 2010-2015 | 2000-2005 | 2005-2010 | 2010-2015 | 2000-2005 | 2005-2010 | 2010-2015 | |
| Inner Mongolia | 11 | 358 | -158 | 125 | 33 | 690 | 4.93 | 20.12 | 47.26 |
| Northwest China | 6092 | 2415 | 8372 | 357 | 128 | 1149 | 13.08 | 15.92 | 55.48 |
| Tibetan Plateau | -22 | 50 | -79 | 35 | 10 | 79 | 27.78 | 45.45 | 81.44 |
| Southwest China | -1471 | -1308 | -2630 | 725 | 591 | 2349 | 32.51 | 42.98 | 80.86 |
| Central China | -1148 | -572 | -2020 | 351 | 393 | 1683 | 28.70 | 67.76 | 75.91 |
| Northeast China | 1222 | 311 | 1821 | 392 | 346 | 856 | 27.80 | 27.16 | 67.24 |
| North China | -5005 | -2437 | -2593 | 3537 | 1886 | 3137 | 55.15 | 69.13 | 86.39 |
| Southeast China | -4918 | -3427 | -3552 | 4608 | 3187 | 3916 | 80.69 | 89.15 | 89.30 |
| South China | -2081 | -773 | -1015 | 1477 | 491 | 1055 | 68.10 | 61.68 | 86.83 |
| Total | -7320 | -5383 | -1854 | 11607 | 7065 | 14914 | 47.29 | 62.42 | 77.46 |
Fig. 1 The spatial pattern of cropland occupied by construction land expansion |
Fig. 2 The spatial pattern of high-, medium- and low-yield cropland in China in 2000(a), 2005(b), 2010(c) and 2015(d). |
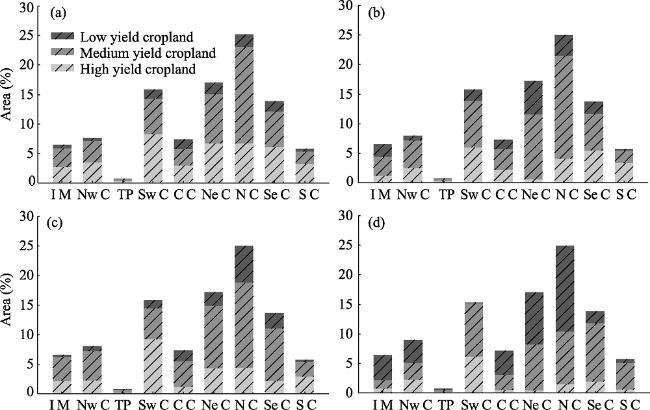
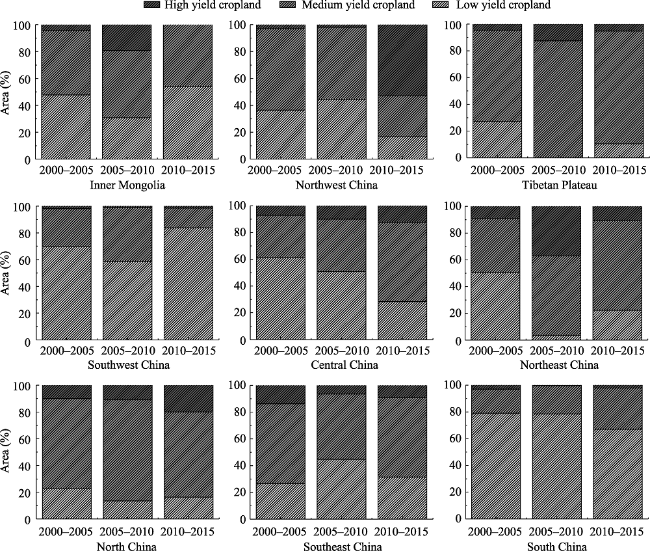
Fig. 3 The proportions of high-, medium- and low-yield cropland of each sub-region (climate zone) in the total cropland area of China in 2000(a), 2005(b), 2010(c) and 2015(d). |
Fig. 4 The spatial pattern of high-, medium- and low-yield cropland occupied by construction land expansion from 2000 to 2005 |
Fig. 5 The spatial pattern of high-, medium- and low-yield cropland occupied by construction land expansion from 2005 to 2010 |
Fig. 6 The spatial pattern of high-, medium- and low-yield cropland occupied by construction land expansion from 2010 to 2015. |
Fig. 7 The proportion of high-, medium- and low-yield cropland occupied by construction land expansion in each sub-region (climate zone) from 2000 to 2015. |
The authors have declared that no competing interests exist.
| [1] |
|
| [2] |
|
| [3] |
|
| [4] |
|
| [5] |
|
| [6] |
|
| [7] |
|
| [8] |
|
| [9] |
|
| [10] |
|
| [11] |
|
| [12] |
|
| [13] |
|
| [14] |
|
| [15] |
|
| [16] |
|
| [17] |
|
| [18] |
|
| [19] |
|
| [20] |
|
| [21] |
|
| [22] |
|
| [23] |
|
| [24] |
|
| [25] |
|
| [26] |
|
| [27] |
|
| [28] |
|
| [29] |
|
| [30] |
|
| [31] |
|
| [32] |
|
| [33] |
|
| [34] |
|
| [35] |
|
| [36] |
|
| [37] |
|
| [38] |
|
| [39] |
|
| [40] |
|
| [41] |
|
| [42] |
|
| [43] |
|
| [44] |
|
| [45] |
|
| [46] |
|
| [47] |
|
| [48] |
|
| [49] |
|
| [50] |
|
| [51] |
|
| [52] |
|
| [53] |
|
| [54] |
|
| [55] |
|
| [56] |
|
| [57] |
|
| [58] |
|
| [59] |
|
| [60] |
|
| [61] |
|
/
| 〈 |
|
〉 |