Grassland Ecosystem

Rating the Degradation of Natural Hay Pastures in Northern China

  • XU Lijun 1 ,
  • SHEN Beibei 1 ,
  • NIE Yingying 1 ,
  • XIN Xiaoping , 1, * ,
  • GAO Wa 1 ,
  • LI Da 2 ,
  • WANG Di 2 ,
  • YAN Ruirui 1 ,
  • CHEN Baorui 1
Expand
  • 1. Hulunber Grassland Ecosystem Observation and Research Station/Institute of Agricultural Resources and Regional Planning of Chinese Academy of Agricultural Sciences, Beijing 100081, China
  • 2. Institute of Animal Husbandry Science of Baicheng, Baicheng, Jilin 137000, China
*Corresponding author: XIN Xiaoping, E-mail:

Received date: 2018-10-19

  Accepted date: 2018-12-30

  Online published: 2019-03-30

Supported by

National Key Research and Development Program of China (2017YFC0503805, 2016YFC0500603, 2017YFE0104500)

China Agriculture Research System (CARS-34)

National Nonprofit Institute Research Grant of CAAS (821-32).

Copyright

All rights reserved

Abstract

Natural hay pastures in semi-arid pastoral areas produce the highest yields of hay in northern China. However, long-term continuous hay harvesting with no rest interval has resulted in severe degradation across widespread areas of these natural hay pastures. In addition, no clear data exist on the spatial distribution or degree of degradation occurring in natural hay pastures primarily because a nationally unified and normative evaluation standard is lacking. In view of the above problems, we employed an analytic hierarchy process to carry out screening and accuracy validation of evaluation indicators for natural hay pastures in north China grasslands (temperate meadow steppes, temperate steppes, mountain meadows, and lowland meadows). Our study identified seven easily measured indicators that reflect the state of natural hay pastures (average height, aboveground biomass, coverage, proportion of medium grasses, litter biomass, proportion of degradation-indicative plants, and proportion of bare spots and saline-alkali spots). A five-level scoring method was employed to delineate the threshold range for these indicators, The results of this study show that this method effectively solved the technical bottleneck for graded evaluation of degradation in natural hay pastures. This provides a theoretical basis for the scientific assessment of natural hay pasture degradation as well as important technical support for sustainable use of natural hay pastures and livestock production.

Cite this article

XU Lijun , SHEN Beibei , NIE Yingying , XIN Xiaoping , GAO Wa , LI Da , WANG Di , YAN Ruirui , CHEN Baorui . Rating the Degradation of Natural Hay Pastures in Northern China[J]. Journal of Resources and Ecology, 2019 , 10(2) : 163 -173 . DOI: 10.5814/j.issn.1674-764X.2019.02.007

1 Introduction

Pastoral natural grasslands cover 236 million ha in China, of which 50.8% are located in semi-arid regions. Based on incomplete statistics, natural hay pastures in semi-arid pastoral areas cover approximately 13.33-20 million ha. These pastures are mainly distributed in eastern Inner Mongolia, the ago-pastoral ecotone of northern China, the Songnen Plain, northern Xinjiang, and other areas with appropriate humidity and temperature conditions (Fig. 1). These represent pastures with the highest yield in these areas of China (Tang et al., 2015). Natural pastures in semi-arid pastoral areas are traditionally cut and mown to complement grazing. Cutting and mowing ensures that an adequate supply of winter supplemental feed is available for livestock and hay serves as a basic feed supply in feedlots. Therefore, protecting natural hay pastures from urbanization and ensuring these areas are used rationally are important to the overall management of grasslands. Scientists have conducted a great amount of research that grades or classifies grassland degradation in China and other countries. Studies from the United States and Austria have proposed using grassland health as a scale to evaluate grassland conditions and suggested watershed health evaluation indicators such as environmental and vegetative conditions and economic benefits. Pellant et al. (2005) proposed methods for using 17 observable indicators for grassland health evaluation including bare land, the existence of erosion or degradation of topsoil, litter biomass, annual yield, and the ability of perennial plants to proliferate. These indicators can be used to rapidly evaluate three basic attributes of grassland: soil stability, hydrological function, and biological communities. This evaluation method is the most complete method in current practice. In China, the national grassland monitoring and evaluation standards (Ji et al., 2011; Su et al., 2003; Li et al., 2008; Su et al., 2015; Yun et al., 2006) include GB/T 27515-2011 (Technical Regulation for Rotational Mowing on Natural Grassland), GB 19377-2003 (Parameters for Degradation, Sandification, and Salification of Rangelands), GB/T 21439-2008 (Assessment for the Status of Rangeland Health), NY/T 635-2015 (Calculation of Rangeland Carrying Capacity), and NY/T 1233-2006 (Rules For Monitoring of Rangeland Resources and Ecology). Natural hay pastures are an important strategic resource for semi-arid pastoral areas in China where areas of natural grasslands in semi- arid pastoral areas cover 120 million ha, of which natural hay pastures cover around 1300-2000 ha. Natural hay pastures serve as the most productive pastures in semi-arid pastoral areas. However, in recent years climate change and human factors (such as irrational use and long-term continuous mowing) have resulted in severe degradation of natural hay pastures. This degradation mainly takes the form of a reduction in the number of plant species, changes to seed banks, soil nutrient deficiency, and physical and structural changes in the grassland ecosystem. The degradation of natural hay pastures has become an important technical bottleneck affecting ecological restoration efforts, productivity, and the development of grasslands.
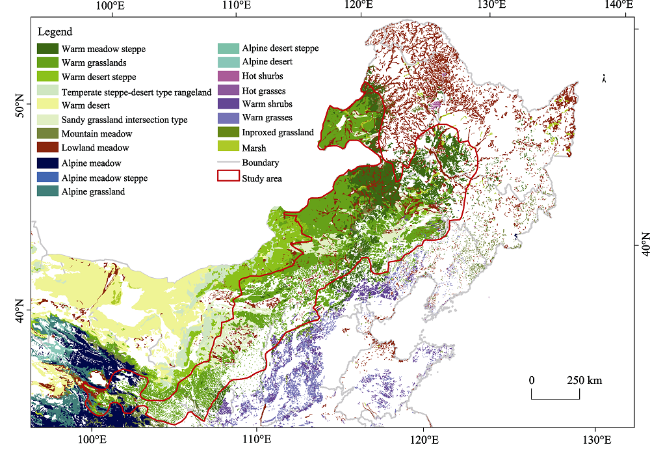
Fig. 1 Distribution of several types of natural hay pasture in the semi-arid region of north China
Currently, no local or overseas standards or specifications are available for assessing the degradation and status of natural hay pastures. However, many technical indicators and methods exist for investigating and monitoring both grassland degradation and the baseline conditions of grassland, which allow for standardized evaluation of the degradation occurring in natural hay pasture. The main reason why baseline data remain unclear regarding the spatial distribution and degree of degradation of natural hay pastures in China is that unified and standardized evaluation criteria for China are lacking. Technical methods for this type of standardized evaluation are important to providing scientifically sound management techniques and have significance for the protection and sustainable development of natural hay pastures and improving productivity levels. Considering the degradation and rational use of natural hay pastures, we studied several evaluation and technical indicators for analyzing varying degrees of degradation. The present study effectively increases the ability of researchers to comprehensively evaluate the degradation status of pasture and solves the technical bottleneck required for producing a graded evaluation for the degradation of natural hay pasture. The findings can be used to specify the techniques used for evaluating the degradation status of natural hay pasture and provide technical support for scientifically sound evaluation of such degradation. The findings will be significant for the sustainable use of hay pastures, livestock production and ecological protection.

2 Materials and methods

2.1 Indicator determination method

2.1.1 Data collection
We collected relevant research articles, scientific and technological papers, and relevant data on the study site. These data mainly included national and regional grassland surveys, manuals providing monitoring techniques, implementation protocols, relevant experimental and statistical data, the first unified national and provincial grassland survey data from the 1980s, information related to grassland ecological restoration projects, productivity monitoring data and monitoring reports published since the year 2000 (Ministry of Agriculture, 2011, 2012, 2013, 2014, 2015, 2016) Additionally, we reviewed the indicator systems related to forestry resource evaluation, land desertification, relevant local and overseas evaluation techniques (Dang et al., 2008; Wang et al., 2004; Li, 1997; Guo et al., 2003, Xu et al., 2002; Xu and Yu, 2002), and implementation measures and protocols for the protection and development of management plans for the natural grasslands of China produced by various regional government agencies (The Inner Mongolia Autonomous Region East flag government, 2002; The State Council, 2003).
2.1.2 Questionnaire survey
During indicator selection, maintaining the rational use of pastures and related ecosystem structure and function were taken as prerequisites. We fully considered the technical level and management effectiveness of current grading systems applied to the degradation of natural hay pasture in China. Indicator selection also revolved around grassland productivity and ecological management requirements for the use, cultivation, and protection of hay pastures. The critical factors and indicators for grading of hay pasture degradation were determined to conform to the strategy of rational use and ecological security of hay pastures. We formulated a “Basic characteristics questionnaire for grading the degradation of natural hay pasture sample plots” and a “Quadrat measurement table for grading of natural hay pasture degradation” to be applied during ground surveys of sample plots and herder surveys to obtain the characteristics of the overall situation. The survey subjects were mainly local pastures workers, farmers and herders.
2.1.3 Indicator screening and measurement
Indicator screening was carried out using questionnaire surveys and an expert meeting. The experts were invited to analyze and comprehensively evaluate the indicators based on their own knowledge and experience. Also, the experts described the importance of the indicators, added indicators and merged some indicators. The selected indicators were scored. The collected results were compiled and scientific analysis on the screening and weight determination of evaluation indicators were carried out using classical mathematical models to avoid subjectivity in the judgments of experts. Finally, the selected indicators were used for field data collection. The selected indicators were further screened and validated based on the measured results.

2.2 Indicator weights

2.2.1 Preliminary selection of indicators
Expert consultation, theoretical analysis, and frequency analysis were used for the comprehensive screening and evaluation of indicators. We selected indicators that have frequently been used from research articles related to ecological evaluation as well as those related to standards and indicators of sustainable development. Combining the collection of published data with field survey data is the most basic process used in indicator screening and determines the difficulty of obtaining evaluation indicators and the scientific-soundness of the indicators. The initial indicators included the average height of the leaf layer in forage vegetation, total coverage of grasses, litter biomass, proportion of small and medium grasses in total yield, proportion of degradation-indicative plants in total yield, aboveground biomass, average height of the leaf layer, proportion of reduction in plant species, proportion of edible herbivorous species in all species, proportion of bare spots and saline-alkali spots (Table 1).
Table 1 Selection of degradation rating indices of natural hay pasture in north China
A B C D E F G H I J K L M N O P Q R S T U V
A 1 1 1 2 3 3 1 2 2 1 3 2 3 3 7 3 3 9 2 3 3 5
B 1 1 1 2 3 3 1 2 2 2 4 3 3 3 8 5 5 9 2 5 4 6
C 1 1 1 2 3 3 1 2 2 2 4 2 3 3 7 4 4 9 2 4 3 5
D 1/2 1/2 1/2 1 2 2 1/2 1 1 1 2 1 2 2 4 2 2 6 1 2 2 3
E 1/3 1/3 1/3 1/2 1 1 1/2 1 1 1/2 2 1 1 1 3 2 2 5 1 2 2 2
F 1/3 1/3 1/3 1/2 1 1 1/2 1 1 1/2 2 1 1 1 3 2 2 5 1 2 1 2
G 1 1 1 2 2 2 1 2 2 2 3 2 4 3 6 4 2 9 2 3 3 5
H 1/2 1/2 1/2 1 1 1 1/2 1 1 1 2 1 2 2 4 2 2 6 1 2 2 3
I 1/2 1/2 1/2 1 1 1 1/2 1 1 1 2 1 2 2 4 2 2 6 1 2 2 3
J 1 1/2 1/2 1 2 2 1/2 1 1 1 2 2 2 5 3 3 8 1 3 2 3 3
K 1/3 1/4 1/4 1/2 1/2 1/2 1/3 1/2 1/2 1/2 1 1/2 1 1 2 1 1 3 1/2 1 1 1
L 1/2 1/3 1/2 1 1 1 1/2 1 1 1/2 2 1 1 1 3 2 2 5 1 1 1 2
M 1/3 1/3 1/3 1/2 1 1 1/4 1/2 1/2 1/2 1 1 1 1 2 2 2 5 1 1 1 2
N 1/3 1/3 1/3 1/2 1 1 1/3 1/2 1/2 1/5 1 1 1 1 2 2 2 4 1/2 1 1 2
O 1/7 1/8 1/7 1/4 1/3 1/3 1/6 1/4 1/4 1/3 1/2 1/3 1/2 1/2 1 1/2 1/2 2 1/3 1/2 1/2 1
P 1/3 1/5 1/4 1/2 1/2 1/2 1/4 1/2 1/2 1/3 1 1/2 1/2 1/2 2 1 1 3 1/2 1 1 1
Q 1/9 1/9 1/9 1/6 1/5 1/5 1/9 1/6 1/6 1 1/3 1/5 1/5 1/4 1/2 1/3 1/3 1 1/6 1/3 1/3 1/2
R 1/2 1/2 1/2 1 1 1 1/2 1 1 1/3 2 1 1 2 3 2 2 6 1 2 2 3
S 1/3 1/5 1/4 1/2 1/2 1/2 1/3 1/2 1/2 1/2 1 1/2 1 1 2 1 1 3 1/2 1 1 1
T 1/3 1/4 1/3 1/2 1/2 1 1/3 1/2 1/2 1/3 1 1/2 1 1 2 1 1 3 1/2 1 1 1
U 1/5 1/6 1/5 1/3 1/2 1/2 1/5 1/3 1/3 1/3 1 1/2 1/2 1/2 1 1 1 2 1/3 1 1 1

Note: A: Average height; B: Aboveground biomass; C: Coverage; D: Proportion of medium grasses; E: Proportion of reduction in plant species; F: Litter biomass; G: Proportion of degradation-indicative plants; H: Proportion of bare spots and saline-alkali spots; I: Proportion of edible herbivorous species in all species; J: Proportion of increase in edible herbivorous species; K: Proportion of non-edible grass in total herbaceous vegetation; L: Proportion of harmful grasses in total herbaceous vegetation; M: Proportion of increase in soil erosion modulus; N: Proportion of rodent hole area in grassland area; O: Proportion of increase in soil bulk density in the soil layer; P: Proportion of reduction in total nitrogen content in the soil layer; Q: Proportion of increase in soil salinity; R: Proportion of reduction in organic matter content; S: Proportion of grasses; T: Proportion of increase in desertification-indicative plants; U: Proportion of increase in salinization-indicative plants;V: ???

2.2.2 Expert survey of selected indicators
An analytic hierarchy process was employed in which the scoring results of the initial indicators by 30 experts were summarized. Pairwise comparison of the indicators was conducted and a judgment matrix was constructed to calculate the maximum characteristic root and its corresponding eigenvector. The final weight values were used to select the most representative indicators for the standard used in this study.
The judgment matrix was constructed as follows:
Comparison of the importance of quantitative indicators: The greater the importance value, the more important a particular factor is. The maximum value is nine, which means extremely important and the minimum value is one. A reciprocal represents relative unimportance, with 1/9 being the most unimportant. Further, the consistency and continuity of judgment should be maintained (Table 1).
Calculation of maximum eigenvector:
Elements in each column in the judgment matrix were normalized and the general term of each element is shown in Eq. (1):
${{\bar{b}}_{ij}}=\frac{{{b}_{ij}}}{\sum\limits_{i,j=1}^{n}{{{b}_{ij}}}}(i,j=1,2,\cdots ,n)$ (1)
Where bij represents the element of the i-th row and the j-th column in the matrix.
The rows of the judgment matrix that had undergone normalization for every column were added into Eq. (2):
${{\bar{S}}_{i}}=\sum\limits_{i=1}^{n}{{{b}_{ij}}}(i=1,2,\cdots ,n)$ (2)
The vector $W=({{W}_{1}},{{W}_{2}},\cdots ,{{W}_{n}})$ is normalized, as shown in Eq. (3):
${{W}_{i}}=\frac{{{\overline{S}}_{i}}}{\sum\limits_{i=1}^{n}{{{\overline{S}}_{j}}}}(i=1,2,\cdots ,n)$ (3)
The approximate solution for the eigenvector obtained is $W={{({{W}_{1}},{{W}_{2}},\cdots ,{{W}_{n}})}^{\text{T}}}$
The calculation of maximum eigenvectors was used to sort the indicators by weight (Table 2).
Table 2 Weights of the degradation indices of natural hay pasture in north China
Indicator Weight Indicator Weight
Aboveground biomass 0.104 Litter biomass 0.039
Coverage 0.096 The proportion of harmful grasses in total herbaceous vegetation 0.033
Proportion of degradation-indicative plants 0.090 Proportion of increase in soil erosion modulus 0.031
Average height 0.089 Proportion of increase in desertification-indicative plants 0.026
Litter biomass 0.070 Proportion of increase in edible herbivorous species 0.025
Proportion of medium grasses 0.053 Proportion of grasses 0.025
Proportion of bare spots and saline-alkali spots 0.050 Proportion of reduction in total nitrogen content in the soil layer 0.023
Proportion of edible herbivorous species in all species 0.050 Proportion of increase in soil bulk density in the soil layer 0.023
Proportion of reduction in organic matter content 0.046 Proportion of increase in salinization-indicative plants 0.019
Proportion of non-edible grass in total herbaceous vegetation 0.041 Proportion of rodent hole area in grassland area 0.014
Proportion of reduction in plant species 0.041
2.2.3 Consistency indicator testing for the judgment matrix
The maximum characteristic root of the judgment matrix was calculated as ${{\lambda }_{\text{max}}}$.
B is the comparison matrix mentioned above and W is the characteristic root that was obtained above. ${{\lambda }_{\text{max}}}$ was calculated using Eq. (4):
${{\lambda }_{\text{max}}}=\sum\limits_{i=1}^{n}{\frac{{{(BW)}_{i}}}{n{{W}_{i}}}}$ (4)
The consistency indicator (C.I.) for the judgment matrix was calculated using Eq. (5):
$C.I.=\frac{{{\lambda }_{\max }}-n}{n-1}$ (5)
Indicators with C.I. = 0.03 passed the consistency test.
2.2.4 Selection of indicators with strong dominance
The indicators were re-screened based on grassland production characteristics and ecological characteristic indicators. This was carried out by removing indicators that had high costs and poor applicability based on the weights from the expert survey. We selected the most representative qualitative and quantitative indicators to reflect hay pasture degradation.
By combining information from many years of grassland research and reading Chinese and global literature with re- levant data from management departments and units, the results showed that the most intuitive indicator during the degradation of grassland is change in vegetation. When grassland degradation occurs, vegetation changes rapidly, intuitively and accurately reflect the overall status of pasture use and the health of a hay pasture ecosystem. Among these indicators, changes in vegetation height, coverage and bio- mass directly reflect the degradation status of natural hay pastures so monitoring of the threshold value of vegetation degradation is extremely important. In addition, under China’s existing technological levels, it is relatively easy to obtain vegetation characteristic indicators from grasslands. This only requires a simple on-site description and measurements but does not require many tests or complex operations to obtain the desired data. Therefore, grassland vegetation in- dicators were used as the dominant factors for the grading of hay pasture degradation. Medium grasses were used to re- flect the quality of hay pastures; litter, bare spots, and sa- line-alkali spots were used to reflect soil and habitat changes. Understanding the accumulation of litter in grass- land ecosystems and its decomposition process is especially important to understanding its ecological functions and regulating the intensity of pasture use. In contrast, measur- ing soil nutrients and bulk density requires large amounts of capital and manpower costs so obtaining this type of data is not easily promoted. Therefore, these indicators were not selected.
After repeated adjustment, testing and validation, we de- fined an evaluation indicator system for hay pasture degra- dation that has strong dominance. Ultimately, we selected the top seven indicators from the indicator weight ranking, of which five were positive indicators. The higher the values of these indicators, the more healthy the pasture. The re- maining two indicators were negative indicators whereby the lower the value, the more healthy the pasture.
2.2.5 Determination of indicator threshold value
The threshold values were determined from a comprehensive analysis of grassland survey data from the 1960s, grassland resource survey data acquired in the 1980s, and published data from relevant articles on natural hay pasture degrada- tion (Dong Ujimqin Banner, 2015; Li et al., 1957-1980). The threshold values for average grass height, average yield, and average coverage were referenced from GB/T 27515- 2011 (Technical Regulation for Rotational Mowing on Natural Grassland) in which the height of the leaf layer for grasses should not be lower than 35 cm and grass coverage should not be lower than 50%. In addition, we referred to grassland yield data in the national grassland census con- ducted in the 1980s (Dong Ujimqin Banner, 2015) and 1964 Inner Mongolia Xilingol League data for proportion of grass yield in total yield (Li et al., 1957-1980). For litter biomass, we referenced the 1964 comprehensive survey of grassland use intensity, and other documents by the former State Sci- ence and Technology Commission. Litter biomass corre- sponds to the biomass of the ground litter layer. During the formulation of indicators for undegraded pastures, we ref- erenced other relevant indicators. These mainly included the relevant indicators for northeastern grassland dynamics in 1958 by Zhu and relevant indicators from the study by Li et al. (Inner Mongolia Ningxia comprehensive inspection team organized by the Chinese Academy of Sciences, 1980; Zhu, 1958; Guo et al., 1992; Department Animal husbandry and veterinary medicine, ministry of agriculture, 1995) (Table 3).
Table 3 Critical values of the degradation index for natural hay pasture in north China
Indicator Max Min
Average height (cm) Temperate meadow steppe 55 32
Temperate steppe 46 25
Mountain meadow 50 30
Lowland meadow 80 49
Aboveground biomass (kg ha-1) Temperate meadow steppe 1800 720
Temperate steppe 1200 480
Mountain meadow 1600 600
Lowland meadow 2500 1000
Coverage (%) Temperate meadow steppe 85 40
Temperate steppe 60 26
Mountain meadow 90 51
Lowland meadow 98 61
Proportion of medium grasses (%) 50 10
Litter biomass (kg ha-1) 400 100
Undegraded Lower limit of degradation
Proportion of degradation-indicative plant (%) 0-2 11
Proportion of bare spots and saline-alkali spots (%) 0-2 14
Table 4 Evaluation positive index system of natural hay pasture degradation in north China (five-level)
Indicator Weight Index score
100 77.5 55 32.5 10
Average height (cm) Temperate meadow steppe 0.25 >55 55-49.7 49.6-44.3 44.32-39 <39
Temperate steppe 0.25 >46 46-41.3 41.32-36.7 36.6-32 <32
Mountain meadow 0.25 >50 50-45.7 45.6-41.3 41.32-37 <37
Low wetland meadow 0.25 >80 80-72 71-64 63-56 <56
Aboveground biomass (kg ha-1) Temperate meadow steppe 0.2 >2000 2000-1532 1531-1064 1063-596 <596
Temperate steppe 0.2 >1200 1200-936.7 936.6-673.3 673.2-410 <410
Mountain meadow 0.2 >1500 1500-1198.7 1198.6-897.3 897.2-596 <596
Low wetland meadow 0.2 >2500 2500-1998.7 1998.6-1497.3 1497.2-996 <996
Total coverage (%) Temperate meadow steppe 0.15 >85 85-70 69-55 54-40 <40
Temperate steppe 0.15 >60 60-48.7 48.6-37.3 37.2-26 <26
Mountain meadow 0.15 >90 90-77 76-64 63-51 <51
Lowland meadow 0.15 >98 98-85.7 85.6-73.3 73.2-61 <61
Proportion of medium grasses (%) 0.1 >50 50-36.7 36.6-23.3 23.2-10 <10
Litter biomass (kg ha-1) 0.1 >400 400-300 299-200 199-100 <100
Table 5 Evaluation negative index system of natural hay pasture degradation in north China (five-level)
Negative evaluation indicators Weight Index score
100 -10 -35 -60 -85
Proportion of degradation-indicative plant (%) 0.1 0-2 2.1-4.7 4.6-7.3 7.2-10 >10
Proportion of sandy and saline-alkali spots (%) 0.1 0-2 2.1-5.3 5.2-8.7 8.6-12 >12
Table 6 Evaluation positive index system of natural hay pasture degradation in north China (seven-level)
Positive indicator type Weight Index score
100 85 70 55 40 25 10
Average height
(cm)
Temperate meadow steppe 0.25 >55 55-51.8 51.7-48.6 48.5-45.4 45.3-42.2 42.1-39 <39
Temperate steppe 0.25 >46 46-43.2 43.1-40.4 40.3-37.6 37.5-34.8 34.7-32 <32
Mountain meadow 0.25 >50 50-47.4 47.3-44.8 44.7-42.2 42.1-36.6 39.5-37 <37
Low wetland meadow 0.25 >80 80-75.2 75.1-70.4 70.3-65.6 65.5-60.8 60.7-56 <56
Above-biomass
(kg ha-1)
Temperate meadow steppe 0.20 >2000 2000-1719.2 1719.1-1438.4 1438.3-1157.6 1157.5-876.8 876.7-596 <596
Temperate steppe 0.20 >1200 1200-1042 1041-884 883-726 725-568 567-410 <410
Mountain meadow 0.20 >1500 1500-1319.2 1319.1-1138.4 1138.3-957.6 957.5-776.8 776.7-596 <596
Low wetland meadow 0.20 >2500 2500-2199.2 2199.1-1898.4 1898.3-1597.6 1597.5-1296.8 1296.7-996 <996
Total coverage
(%)
Temperate meadow steppe 0.15 >85 85-76 75-67 66-58 57-49 48-40 <40
Temperate steppe 0.15 >60 60-53.2 53.1-46.4 46.3-39.6 39.5-32.8 32.7-26 <26
Mountain meadow 0.15 >90 90-82.2 82.1-74.4 74.3-66.6 66.5-58.8 58.7-51 <51
Lowland meadow 0.15 >98 98-90.6 90.5-83.2 83.1-75.8 75.7-68.4 68.3-61 <61
Litter biomass (kg ha-1) 0.10 >400 400-340 339-280 279-220 219-160 159-100 <100
Proportion of medium grasses (%) 0.10 >50 50-42 41-34 33-26 25-18 17-10 <10
Table 7 Evaluation negative index system of natural hay pasture degradation in north China (seven-level)
Negative indicator type Weight Index score
100 -10 -25 -40 -55 -70 -85
Proportion of degradation-indicative plant (%) 0.1 0-2 2.1-3.6 3.7-5.2 5.3-6.8 6.9-8.4 8.5-10 >10
Proportion of sandy and saline-alkali spots (%) 0.1 0-2 2.1-4 4.1-6 6.1-8 8.1-10 10.1-12 >12

3 Results

3.1 Indicator value range and assignment

We constructed 5-level and 7-level scoring systems for eva-luating hay pasture degradation based. Tables 4-5 and 6-7 show the scores in the 5- and 7-level systems, respectively.Among the 192 sample plots in the 2011-2015 hay pas-ture inventory (Fig. 2), data from 45 sample plots and 123 quadrats were used for accuracy testing while the remaining 147 sample plots were used as a basis for indicator adjust-ment. Additionally, 30 years of data from the Chinese Academy of Sciences Xilinhot Typical Grassland Ecological Research Station and ten years of monitoring data from the Hulunbuir Xie'ertalazhen Meadow Grassland Ecological Research Station were used as validation data for degradation grading. These data were combined with historical grassland census data as well as information and data from research papers that were used as validation data. Through compiling, analyzing, and summarizing of these data, the results showed that the overall accuracy of the threshold values of the indicator system all reached 92.15% (Fig. 3) and the differences between the two grading systems were not significant (P>0.05). Therefore the 5-level scoring method was used. The accuracy of the testing results showed that the degree of degradation decreased with an increasing score. The evaluation results obtained when this standard and method were used for grading of the degradation of hay pasture generally are consistent with the characteristics and distribution patterns of hay pasture degradation grades in China. Based on field surveys, the degradation status of important northern hay pastures can be classified as follows: moderate degradation was widespread in the study area, while the distributions of mild and severe degradation were relatively low.
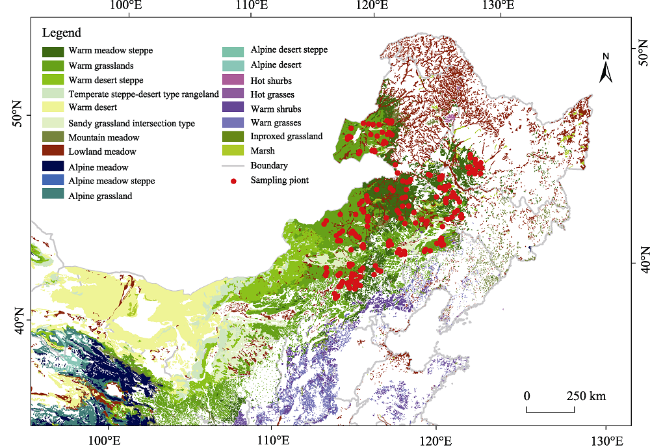
Fig. 2 Distribution diagram of sampling plots of several types of natural hay pasture in the semi-arid region of north China

3.2 Determination basis and methods for degradation grading indicators

The indicators used for grading degraded grassland in this standard were determined according to existing natural grassland degradation grades for China and existing natural grassland health assessment grade indicators used in China and worldwide. The grade indicators in GB 19377-2003 (Parameters For Degradation, Sandification and Salification of Rangelands) classify natural grasslands as undegraded, mild degraded, moderately degraded and severely degraded (Su et al., 2003).
When hay pasture is not over-used, it can be classified as mildly degraded: no significant changes occur in grass community structure or appearance, total grassland yield decreases by less than 30%, grass yield accounts for 30%-50% of the total grassland yield, and surface soil is relatively dry.
When hay pasture is moderately used, it becomes moderately degraded: significant changes in grass community structure and appearance occur, total grassland yield decreases by 30%-60%, grass yield accounts for 10%-30% of the total grassland yield, and surface soil is relatively dry. Degradation-indicative plants accounted for 15%-40% of the total grassland yield. The ground surface is dry and the soil is compacted.
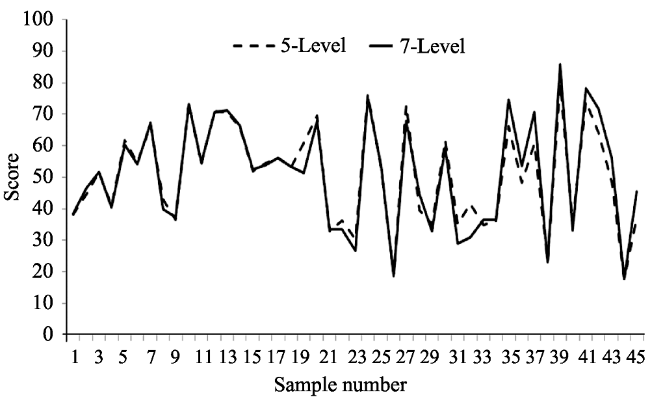
Fig. 3 Score analysis diagram of five-level score and seven-level score evaluation index system
When hay pasture is heavily used, it becomes severely degraded: fundamental changes in the grass community structure and appearance occur, total grassland yield decreases by more than 60%, grass yield accounts for less than 10% of total grassland yield. Degradation-indicative plants accounted for more than 40% of the total grassland yield. Surface soil is compacted with some bare spots, such as sandy and/or saline-alkaline area.

3.3 Calculation of natural hay pasture degradation grade and indicator measurement methods

The integrated grading of degradation in natural hay pasture was calculated using Eq. (1). Tables 1-2 were used for the calculation of the corresponding core for the indicators for grading degradation of natural hay pasture in Eq. (6).
S=0.2X1+0.2X2+0.15X3+0.15X4+0.1X5+0.1X6+0.1X7 (6)
where, S is the integrated rating for natural hay pasture degradation grade and X1, X2, X3, X4, X5, X6, and X7, are the scores for average height, aboveground biomass, coverage, the proportion of medium grasses, litter biomass, the proportion of degradation-indicative plants, and the proportion of bare and/or saline-alkali spots, respectively (Table 8-9).
Table 8 Results for positive indices and scores for degradation of natural hay pasture in north China
Score Indicator 100 77.5 55 32.5 10
Average height (cm) Temperate meadow steppe ≥55 55-47 47-40 40-32 <32
Temperate steppe ≥46 46-39 39-32 32-25 <25
Mountain meadow ≥50 50-43 43-37 37-30 <30
Lowland meadow ≥80 80-70 70-59 59-49 <49
Above-biomass (kg ha-1) Temperate meadow steppe ≥1800 1800-1440 1440-1080 1080-720 <720
Temperate steppe ≥1200 1200-960 960-720 720-480 <480
Mountain meadow ≥1600 1600-1267 1267-933 933-600 <600
Lowland meadow ≥2500 2500-2000 2000-1500 1500-1000 <1000
Coverage (%) Temperate meadow steppe ≥85 85-70 70-55 55-40 <40
Temperate steppe ≥60 60-49 49-37 37-26 <26
Mountain meadow ≥90 90-77 77-64 64-51 <51
Lowland meadow ≥98 98-86 86-73 73-61 <61
Proportion of medium grasses (%) ≥50 50-37 37-23 23-10 <10
Litter biomass (kg ha-1) ≥400 400-300 300-200 200-100 <100
Table 9 Results for negative indices and scores for degradation natural hay pasture in north China
Score 100 -10 -35 -60 -85
Proportion of degradation-indicative plant 0-2 2-5 5-8 8-11 ≥11
Proportion of bare spots and saline-alkali spots 0-2 2-6 6-10 10-14 ≥14

4 Discussion and conclusions

The final integrated rating (S) was used to classify the degree of pasture degradation into undegraded and mildly, moderately and severely degraded categories with scores of 76%-100%, 51%-75%, 25%-50% and <25%, respectively.
Scholars worldwide have conducted studies using varying scales on the degradation of grassland ecosystems; however, most studies have focused on grazing grasslands (Wu et al., 2011; Qi et al., 2015) and few studies have analyzed hay pastures. Wei et al. (2005) showed that as grazing intensity increases, the biomass of grasses and sedges will continuously decrease and the biomass of forbs increases. This causes the community structure to tend toward simplification, a decrease in vegetation coverage and biodiversity, and an increase in the proportin of noxious weeds. Chao et al. (2016) showed that frequent mowing caused by an inappropriate use system and unsustainable management in natural hay pastures resulted in a reduction in superior forage grass with a decrease in grass layer height and coverage. This causes undesirable succession of the community. Through comparison, we found that with increasing degradation of grazing grassland and hay pastures, vegetation coverage will decrease. However, because of the effects of grazing livestock, the rate at which the number of forbs increases and diversity declines in grazing grassland systems will far exceed that of hay pasture.
Several studies (Chen et al., 2015; Cui et al., 2007; Zhang et al., 2011; Du et al., 2015; Wang, 2003) have analyzed the causes of degradation in grassland ecosystems and found them to be relatively complex. These causes mainly include the effects of climate, wildlife and human activities. Among these, human factors play a dominant role and mainly present as overgrazing and frequent mowing. Tang et al. (2018) and Wang et al. (2016) studied degradation in grassland ecosystems and found that an undesirable chain of succession occurs from perennial half-shrubs and shrubs→ perennial grasses→annual and biennial herbs→annual herbaceous short-lived pioneer plants with an increasing degree of grassland degradation. This will ultimately result in desertification, salinization, alkalinization and conversion to barren land (Zhou, 2005). With regards to the evaluation of grassland ecosystem degradation and grassland biomass evaluation, researchers have mostly used production and ecological characteristics to evaluate grassland with the goal of understanding the degree of grassland degradation. Production performance indicators such as height, coverage and aboveground biomass of forage grass have been used to evaluate the degree of degradation. In addition, ecological evaluation indicators tend to be used to evaluate grassland biodiversity, vegetation community density and soil nutrients. Some researchers (Shan, 2009) have divided evaluation indicators into three categories: (1) vegetation characteristics of the grassland (grassland grass yield, community coverage, density, aboveground biomass, and surface litter); (2) grassland soil characteristics (soil porosity, soil nutrients, and soil microorganisms); (3) grassland quality (proportion of superior forage grass and nutrient content of forage grasses). Among these areas, changes in vegetation characteristics serve as an important indicator that can reflect ecosystem health (Zhang, 2009). The present study was based on the foundation laid by previous studies while changes in vegetation characteristics were used as a focus and combined with the causes, characteristics, and forms of grassland ecosystem degradation for an integrated consideration of the ease of obtaining evaluation indicators. The importance of each indicator was used to calculate the score for each indicator and threshold values were determined. We employed an analytic hierarchy process in this study to carry out screening and accuracy validation of assessment indicators for natural hay pastures in north China grasslands (temperate meadow steppes, temperate steppes, mountain meadows, and lowland meadows). Our study determined that these seven indicators can be rapidly analyzed and reflect the level of degradation in natural hay pasture. A five-level scoring method was employed to delineate the threshold range for the indicators, i.e. 25-80 cm for average height, 480-2500 kg ha-1 for aboveground biomass, 26%-98% for coverage, 10%-50% for proportion of medium grasses, 100-400 kg ha-1 for litter biomass, 0-11% for proportion of degradation-indicative plants, and 0-14% for proportion of bare spots and saline-alkali spots. The results of the present study resolve the technical bottleneck related to graded evaluation of degradation in natural hay pasture. This provides a theoretical basis for the scientific evaluation of this type of degradation and important technical support for the sustainable use of natural hay pastures and livestock production.

The authors have declared that no competing interests exist.

[1]
Chao L M Q Q G., Yan X H, Jin H, et al.2016. Prospects for research on degradation and control measures of natural grassland in Xilin Gol League.Grassland and Prataculure, 28(1): 6-9.(in Chinese)

[2]
Chen W Q.2015. The mechanisms of different grazing managements on Leymus Chinensis grassland ecosystem carbon sequestration. Beijing: China Agricultural University.(in Chinese)

[3]
Cui Q H, Jiang Z G, Liu J K, et al.2007. A review of the cause of rangeland degradation on Qinghai-Tibet Plateau.Prataculure Science, (5): 20-26.(in Chinese)

[4]
Dang P X, Hou X W, Hui G Y, et al.2008. Evaluation indicator and evaluation method of regional forest resource quality.Forest Research, 21(1): 84-90.(in Chinese)

[5]
Department Animal Husbandry and Veterinary Medicine, Ministry of Agriculture. 1995. National Animal Husbandry Station, Grassland resources of China. Beijing: Science and Technology of China Press.

[6]
Dong Ujimqin Banner.2015. Notice on the time and management measures for storing grass in Eastern Mu Zhu Qin Banner.

[7]
Du J Z, Wang G X, Li Y S.2015. Rate and causes of degradation of alpine grassland in the source regions of the Yangtze and Yellow Rivers during the last 45 years.Acta Prataculure Sinice, 24(6): 5-15. (in Chinese)

[8]
Guo J X, Zhu T C.1992. Contrast study about litter dynamics of main communities in Aneurolepidium chinense grassland region in northeast of china.Journal of Integrative Plant Biology, (7): 529-534. (in Chinese)

[9]
Guo Z G, Cheng G D, Wu B L, et al.2003.Evaluation on sustainability of forest resources in Bailom River forest region, Gansu Province.Chinese Journal of Applied Ecology, 14(9): 1433-1437. (in Chinese)

[10]
Inner Mongolia Ningxia Comprehensive Inspection Team Organized by the Chinese Academy of Sciences. 1980. Natural grassland in the Inner Mongolia Autonomous Region and its adjacent areas. Beijing: Science Press.

[11]
Ji M S, Xing Q, Gao W, et al.2011. Technical regulation for rotation mowing on natural grassland (GB/T 27515-2011). (in Chinese)

[12]
Li B. The rangeland degradation in north China and its preventive strategy.1997. Scientia Agricultura Sinica, 30(6): 1-9. (in Chinese)

[13]
Li C H, Xu J J, Yu B T.2002. Comprehensive appraising methodology for sustainable development of China forest resources.Journal of North East Forestry University, 30(2): 74-76.

[14]
Li J T, Li B, Liu R, et al.1957-1980. Vegetation of schell tara stock farm in Hulun Buir, Inner Mongolia.Compilation of Scientific Achievements in Plant Ecology, 178-183. (in Chinese)

[15]
Li X L, Wan L Q, He F, et al.2008. Assessment for the status of rangeland health (GB/T 21439-2008). (in Chinese)

[16]
Liang Y, Han G D, Zhou H, et al.2011. Study on rational utilization of grassland in Leymus Grassland in Keshiketeng Banner, Inner Mongolia.Inner Mongolia Prataculture, 3(23): 34-36. (in Chinese)

[17]
Ministry of Agriculture. 2011. 2011 national grassland monitoring report. . 2011. 2011 national grassland monitoring report.

[18]
Ministry of Agriculture. 2012. 2012 national grassland monitoring report. . 2012. 2012 national grassland monitoring report.

[19]
Ministry of Agriculture. 2013. 2013 national grassland monitoring report. . 2013. 2013 national grassland monitoring report.

[20]
Ministry of Agriculture. 2014. 2014 national grassland monitoring report. . 2014. 2014 national grassland monitoring report.

[21]
Ministry of Agriculture. 2015. 2015 national grassland monitoring report. . 2015. 2015 national grassland monitoring report.

[22]
Ministry of Agriculture. 2016. 2016 national grassland monitoring report . 2016. 2016 national grassland monitoring report

[23]
Pellant M, Shaver P, Pyke D.2005. Interpreting Indicators of Rangeland Health. Version 4 Colorado:Division of Science Integration Branch of Publishing Services.

[24]
Qi B L, Wang D J, Wang Z F.2015. Investigation and research on the current situation of hitting grassland in western semi-arid region of Jilin province.Modern Agricultural Sciences and Technology, (23): 282-287. (in Chinese)

[25]
Shan G L.2009. Study on restoration succession and health evaluation of typical steppe in Xilingol, Inner Mongolia. Beijing: Chinese Academy of Agricultural Sciences. (in Chinese)

[26]
Su D X, Meng Y D, Wu B G.2015. Calculation of proper carrying capacity of rangelands (NY/T 635-2015). (in Chinese)

[27]
Su D X, Zhang Z H, Chen Z Z, et al.2003. Parameters for degradation and salification of rangelands (GB 19377-2003). (in Chinese)

[28]
Tang H, Gao W, Xu L J, et al.2015. Monitoring forage harvesting area in semi-arid pasture based on Landsat TM images. Transactions of the Chinese Society of Agricultural Engineering, 23(31): 160-165. (in Chinese)

[29]
Tang Z S.2018. Vegetation degradation on mechanism of the desert steppe in semi-arid region. Yangling, Shaanxi: Northwest A&F University. (in Chinese)

[30]
The Inner Mongolia Autonomous Region East flag government.2002. Interim Measures for management of grassland in Eastern the Inner Mongolia Autonomous Region banner.

[31]
The Sate Council.2003. Some opinions on strengthening grassland protection and construction.

[32]
Wang B F, Liu X C, Wang J H.2004. Study on monitoring and assessment indicator systems of sandy desertif ication in China.Journal of Arid Land Resources and Environment, 18(4): 23-28. (in Chinese)

[33]
Wang L L.2016. Dynamic of ecological environment of fenced grassland and its management in Yanchi County. Beijing: Beijing Forestry University. (in Chinese)

[34]
Wang S P.2003. Vegetation degradation and protection strategy in the “Three rivers fountainhead” area in the Qinghai Province.Acta Prataculure Sinice, (6): 1-9. (in Chinese)

[35]
Wei X H, Yang P, Li S, et al.2005. Effects of over-grazing on vegetation degradation of the Kobresia pygmaea meadow and determination of degenerative index in the Naqu Prefecture of Tibet.Acta Prataculure Sinice, (3): 41-49. (in Chinese)

[36]
Wu X, Wang L X, Liu H M, et al.2011. Vigor and resilience of plant communities of typical steppe in Inner Mongolia Plateau.Journal of Arid Land Resources and Environment, (5): 47-51. (in Chinese)

[37]
Xu J J, Yu B T.2002. Comprehensive appraising methodology for sustainable development of china forest resources.Journal of North East Forestry University, 30(2): 74-76. (in Chinese)

[38]
Yun X J, Xing Q, Yong S P, et al.2006. Technical Rules For Monitoring of Rangeland Resources and Ecology (NY/T 1233-2006). (in Chinese)

[39]
Zhang W H, Yang Y.2011. The Feature analysis for grassland degradation and the restoration of natural vegetation in degraded grassland.Northern Environmental, 23(8): 40-44.

[40]
Zhang X S.2009. Vegetation and its geographical pattern in China. Beijing: Geological Publishing House. (in Chinese)

[41]
Zhou L Y, Wang M J, Han G D.2005. Effects of different grazing intensities on community and soil physical and chemical characteristics in Stipa baicalensis steppe. Journal of Arid Land Resources and Environment, (S1): 182-187. (in Chinese)

[42]
Zhu T C.1958. Introduction to the main grassland in Northeast China.Science Quarterly of Northeast Normal University, (1): 98-116. (in Chinese)

Outlines

/