Forest Ecosystem

Modelling Soil Greenhouse Gas Fluxes from a Broad-leaved Korean Pine Forest in Changbai Mountain: Forest-DNDC Model Validation

  • YE Shu 1, 2 ,
  • GUO Chuying 1, 2 ,
  • HAN Jiayin 1, 2 ,
  • ZHANG Leiming , 1, 2, * ,
  • DAI Guanhua 3 ,
  • WEN Xuefa 1, 2 ,
  • YU Guirui 1, 2
Expand
  • 1. Key Laboratory of Ecosystem Network Observation and Modeling, Institute of Geographic Sciences and Natural Resources Research, Chinese Academy of Sciences, Beijing 100101, China
  • 2. College of Resources and Environment, University of Chinese Academy of Sciences, Beijing 100190, China
  • 3. Institute of Applied Ecology, Chinese Academy of Sciences, Shenyang 110016, China
*Corresponding author: ZHANG Leiming, E-mail:

Received date: 2018-12-05

  Accepted date: 2019-01-24

  Online published: 2019-03-30

Supported by

National Key Research and Development Program of China (2017YFC0503801)

National Natural Science Foundation of China (31570446).

Copyright

All rights reserved

Abstract

Fluctuations in soil greenhouse gas (GHG) are an important part of the terrestrial ecosystem carbon-nitrogen cycle, but uncertainties remain about the dynamic change and budget assessment of soil GHG flux. Using high frequency and consecutive soil GHG fluxes measured with an automatic dynamic chamber system, we tested the applicability of the current Forest-DNDC model in simulating soil CH4, CO2 and N2O fluxes in a temperate broad-leaved Korean pine forest at Changbai Mountain. The results showed that the Forest-DNDC model reproduced general patterns of environmental variables, however, simulated seasonal variation in soil temperature, snow melt processes and soil moisture partly deviated from measured variables, especially during the non-growing season. The modeled CH4 flux was close to the field measurement and co-varied mainly with soil temperature and snowpack. The modeled soil CO2 flux had the same seasonal trend to that of the observation along with variation in temperature, however, simulated CO2 flux in the growing season was underestimated. The modeled N2O flux attained a peak in summer due to the influence of temperature, which was apparently different from the observed peak of N2O flux in the freeze-thaw period. Meanwhile, both modeled CO2 flux and N2O flux were dampened by rainfall events. Apart from consistent estimation of annual soil CH4 flux, the annual accumulation of CO2 and N2O was underestimated. It is still necessary to further optimize model parameters and processes using long-term high-frequency observation data, especially transference of heat and water in soil and GHG producing mechanism. Continues work will improve modeling, ecosystem carbon-nitrogen budget assessment and estimation of soil GHGs flux from the site to the region.

Cite this article

YE Shu , GUO Chuying , HAN Jiayin , ZHANG Leiming , DAI Guanhua , WEN Xuefa , YU Guirui . Modelling Soil Greenhouse Gas Fluxes from a Broad-leaved Korean Pine Forest in Changbai Mountain: Forest-DNDC Model Validation[J]. Journal of Resources and Ecology, 2019 , 10(2) : 127 -136 . DOI: 10.5814/j.issn.1674-764X.2019.02.003

1 Introduction

There has been a significant increase in greenhouse gas (GHG) concentrations in the atmosphere since pre-industrial times. CO2, CH4 and N2O together amount to 80% of the total radiative forcing from well-mixed GHGs (IPCC, 2013). As an important component of terrestrial ecosystem carbon and nitrogen cycles, dynamic changes and budget assessments for CO2, CH4 and N2O fluxes between soil and the atmosphere have attracted attention (Batjes et al., 1996; Schindlbacher et al., 2004; Piao et al., 2009; Tian et al., 2016; Oertel et al., 2016).
The Chamber method is commonly used to observe soil GHGs flux, among which the static chamber-gas chromatograph technique has been widely used for its simple operation and low cost. However, it is difficult to carry out long-term and high-frequency observations due to excessive labor costs and limitations in measurement (Bouwman, 1996; Zheng et al., 2017). In recent years, with the development of trace greenhouse gas analysis technology, the in-situ observation of trace GHGs has become possible and provides important technical support for a better understanding of dynamic changes in soil GHGs fluxes and their environmental responses (Heinemeyer et al., 2011).
Ecosystem process-based modeling is an effective way to analyze carbon-nitrogen cycle processes in terrestrial ecosystems (Wang et al., 2004). The Biochemical Model-DNDC (DeNitrification-DeComposition), which integrates the ecological process of carbon and nitrogen, has been widely used (Guo et al., 2013; Gilhespy et al., 2014). Based on the forest version of the DNDC (Forest-DNDC), the simulation analysis of GHGs fluxes (Stange et al., 2000; Xiao et al., 2004), sources of soil respiration (Wang et al., 2008, 2011), vegetation growth and ecosystem carbon balance (Miehle et al., 2006; Dai et al., 2015; Li et al., 2017), and the estimation of soil GHGs fluxes at a regional scale (Butterbach-Bahl et al., 2001, 2004; Kesik et al., 2005; Kiese et al., 2005; Lamers et al., 2007) have been carried out. However, due to limited consecutive and high-frequency observation data, many studies were based on static chamber data with low frequency (e.g., 1-2 times a month) within the growing season to validate the model (Zhang et al., 2002; Werner et al., 2006; Wu et al., 2014). There remains uncertainty regarding the dynamic change of modeled soil GHGs flux and environmental responses, especially during the non-growing season.
As one a zonal forest vegetation type in the Northeast Chinese Transect (NECT), the temperate broad-leaved Korean pine forest in Changbai Mountain (CBF) is assumed to be an important carbon sink using both flux observation and model simulation (Zhang et al., 2010; Wu et al., 2007; Han et al., 2012). Observation from a static chamber indicates that the CBF soil was a CH4 sink, but CO2 and N2O sources during the growing season (Jiang et al., 2005; Geng et al., 2017). Combined with high frequency and consecutive soil GHGs fluxes using an automatic dynamic chamber system in CBF, this study aimed to test and analyze the applicability of the current Forest-DNDC model in simulating dynamic changes in soil GHG (CH4, CO2 and N2O) fluxes. These data will provide an effective basis to retrieve long-term soil GHGs fluxes and evaluate ecosystem carbon and nitrogen budgets from the site to the region.

2 Materials and methods

2.1 Study site

The experimental site was located within the temperate broad-leaved Korean pine forest of Changbai Mountain Forest Ecosystems Research Station (40°24ʹ12ʺ-42°24ʹ12ʺ N, 128°05ʹ41ʺ-128°05ʹ46ʺ E, and 784 m a.s.l.), situated in the southeast of Jilin Province, China. Affected by the monsoon climate of temperate continental region, the annual average temperature is 3.6°C with an annual average precipitation of 700-800 mm. Vegetation type is Changbai mountain temperate broad-leaved Korean pine forest and the forest type is mature primeval forest. Dominant species include Korean pine (Pinus koraiensis), Purple lime (Tiliaamurensis), Mongolian oak (Quercus mongolica), Manshurian ash (Fraxinus mandshurica) and Mono maple (Acer mono). The soil is dark brown soil developed from volcanic ash (Albic Luvisol), classified as Eutric Cambisol (FAO classification).

2.2 Soil GHG flux

2.2.1 Field observation of soil GHG flux
In order to meet the needs of on-line and long-term observation of soil GHG, an automatic multi-channel soil CO2, CH4 and N2O flux observation system was developed through systematic integration. The analysis system includes CO2 and CH4 Gas Analyzer (907-0010, LGR, USA), N2O Analyzer (907-0014, LGR, USA) with a frequency of 1 Hz. The determination accuracy is better than 0.1 μmol m-2 s-1 (CO2), 0.5 nmol m-2 s-1 (CH4) and 0.1 nmol m-2 s-1 (N2O). The sampling system uses the technology of cylinder braking and multiplex control to connect the chamber. The opening and closing of the chamber adopt a closed-circuit cyclic pneumatic based on an independent vacuum pump.
As shown in Fig. 1, the gas analyzer consisted of the apexes with the eight chambers around it. The control system (SF-3000, Li-ca Co. Ltd., China) controlled the chambers’ open-close circle and two gas analyzers. The mainframe controlled the chambers to sample gas in turn. It took about 2 minutes per measurement and 30 minutes per cycle. Built-in storage module for on-line calculation and preservation of flux data. The soil temperature and moisture at 5 cm and 10 cm depths was monitored by TDR (CS615, Campbell Sci., USA) every 30 minutes when soil GHG flux was measured. The snowpack was continuously monitored using an ultrasonic snow sensor (SR50A, Campbell Sci., USA) every 30 minutes. The observation began in August 2014.
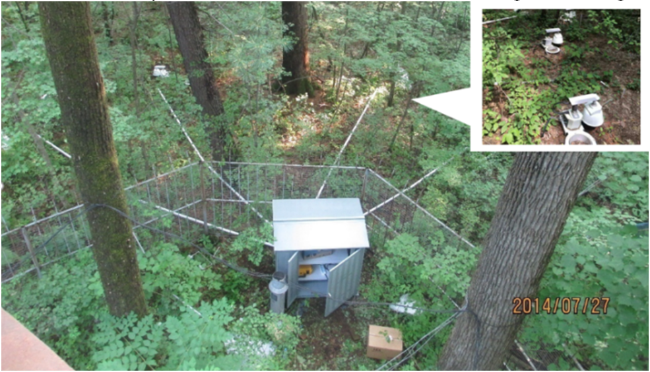
Fig. 1 Deployment and operation of the automatic dynamic chamber observation system at the temperate broad-leaved Korean pine forest in Changbai Mountain (CBF)
2.2.2 Data process
Based on the automatic dynamic chamber observation system, the calculation formulas of GHGs flux are as follows:
${{F}_{\text{C}{{\text{H}}_{\text{4}}}}}=\frac{10\times V\times {{P}_{0}}\times \left( 1-\frac{{{W}_{0}}}{1000000} \right)\times \frac{\partial {C}'}{\partial {t}'}}{R\times S\times \text{(}{{T}_{0}}+273.15)}$ (1)
${{F}_{\text{C}{{\text{O}}_{\text{2}}}}}=\frac{10\times V\times {{P}_{0}}\times \left( 1-\frac{{{W}_{0}}}{1000000} \right)\times \frac{\partial {C}'}{\partial {t}'}}{R\times S\times ({{T}_{0}}+273.15)}$ (2)
${{F}_{{{\text{N}}_{\text{2}}}\text{O}}}=\frac{10\times V\times {{P}_{0}}\times \left( 1-\frac{{{W}_{0}}}{1000000} \right)\times \frac{\partial {C}'}{\partial {t}'}}{R\times S\times \text{(}{{T}_{0}}+273.15)}$ (3)
Here,${{F}_{\text{C}{{\text{H}}_{\text{4}}}}}$,${{F}_{\text{C}{{\text{O}}_{\text{2}}}}}$and${{F}_{{{\text{N}}_{\text{2}}}\text{O}}}$denote soil CH4 flux (nmol m-2 s-1), CO2 flux (μmol m-2 s-1) and N2O flux (nmol m-2 s-1). V is the total volume of the measuring circuit (cm³); P0 is the initial pressure (kPa); W0 is the initial water vapor concentration (μmol mol-1); S is the soil ring cross-sectional area, 298.51 cm2; T0 is the initial air temperature (°C); $\frac{\partial {C}'}{\partial {t}'}$ is the change rate of GHG concentration after water vapor correction; and R is gas constant, 8.314 Pa m3 mol-1 K-1.
In order to match the output of the Forest-DNDC model, the average value of observed data per day was taken to represent daily flux. Correspondingly, the average daily soil temperature and moisture were calculated.

2.3 Forest-DNDC Model

2.3.1 Model overview
The DNDC model integrates photosynthesis, evapotranspiration, nitrification-denitrification, combination-decomposition and hydrological processes (Li et al., 2000; Stange et al., 2000). Forest-DNDC was developed by integrating an upland forest mode (PnET-N-DNDC) with a hydrology-driven model (Wetlands-DNDC), for simulating forest growth, soil carbon and nitrogen dynamics, carbon sequestration and soil-borne trace gas emissions in forest ecosystems. Forest-DNDC created a new modelling framework to fill some gaps existing in most forest models in terms of the linkage between forest and soil processes (Gilhespy et al., 2014). The Forest-DNDC model consists of six components including: soil environment, vegetation growth, organic decomposition, nitrification, denitrification and fermentation. The organic decomposition, nitrification, denitrification and fermentation submodules, predicts CO2, NO, N2O, CH4, and NH3 biochemical reactions fluxes through simulating impacts of soil environmental conditions on the relevant geochemical and biochemical reactions (Li et al., 2000). We download the Forest-DNDC from The DNDC Model home page (http://www.dndc.sr.unh.edu/) and tested with the continuous high frequency soil GHG flux data.
2.3.2 Input data and parameters
The input data of Forest-DNDC includes four parts: meteorological data, vegetation data, soil data and anthropogenic management data. Meteorological data mainly includes the daily maximum temperature, minimum temperature, precipitation, photosynthetic active radiation (PAR), atmospheric background CO2 concentration, N content in rainfall and other atmospheric background data. Vegetation data are derived from forest inventory, including vegetation type, forest age, leaf N content and other physiological parameters. Soil data includes soil composition, pH and soil hydraulic parameters. With regard to management data, considering that the reach area is located in the nature reserve and human disturbance is very small, management activity was ignored. The definitions of input data and parameters are listed in Table 1.
Table 1 Definition and source of the main parameters for Forest-DNDC
Parameter Unit Value Definition Source
Vegetation
Upper-story age year 140 Age of upper-story trees Han et al., 2012
Upper-story type unitless pine Dominant type of upper-story trees. CNREN
Initial leaf N content % % 1.4 Initial N concentration in foliage, % by weight Sun et al., 2016
AmaxA, n mole CO2 g-1 s-1 unitless 9.3 Coefficients for photosynthesis curve Aber et al., 1996
AmaxB unitless 21.5 Coefficients for photosynthesis curve Aber et al., 1996
Amax fraction unitless 0.76 Daily Amax as a fraction of instantaneous Amax Aber et al., 1996
Light half satur constant µmole m-2 second-1 200 Half saturation light intensity Aber et al., 1996
Respiration Q10 unitless 2 Effect of temperature on respiration Aber et al., 1996
DVPD 1 and DVPD2 unitless 0.05 2 Coefficients for calculating vapor pressure deficit Aber et al., 1996
Leaf start TDD unitless 600 Accumulative thermal degree days for starting leaf growth Amina et al., 2013
Leaf end TDD unitless 1744 Accumulative thermal degree days for ceasing leaf growth Amina et al., 2013
Senesc start day unitless 264 Starting Julian day for senescence Han et al., 2012
Leaf C: N unitless 31.5 C: N ratio in foliage Han et al., 2012
Wood C: N unitless 200 C: N ratio in woody biomass Aber et al., 1996
Leaf retention Year 2.25 Time span of leaf retention Aber et al., 1996
C reserve fraction unitless 0.75 Fraction of available C for plant reserve. Aber et al., 1996
C fraction of dry matter unitless 0.45 C/dry matter ratio Aber et al., 1996
Specific leaf weight g m-2 200 Specific leaf weight Aber et al., 1996

Soil
Forest floor Mineral soil
Type unitless Moder Sandy loam Defined based on quality of the organic matter, proportions of sand, silt and clay in a soil Han et al., 2012
Thickness M 0.042 0.5 Thickness of forest floor or mineral soil Han et al., 2012
pH unitless 4.8 4.8 Soil acidity Han et al., 2012
SOC kg C ha-1 5400 24472 Soil organic carbon content in the entire organic or mineral profile. The unit is kg C/ha Han et al., 2012
Bulk Density g cm-3 0.5 1.53 Soil bulk density. The unit is g soil per cubic cm Han et al., 2012
Clay unitless 0.02 0.49 Clay fraction by weight cm per minute, d≤0.005mm Han et al., 2012
Porosity unitless 0.68 0.62 Pore volumetric fraction of the soil Han et al., 2012
Field Capacity unitless 0.7 0.55 The maximum water-filled fraction of total porosity in a freely drained soil Han et al., 2012
Wilting Point unitless 0.2 0.11 The maximum water-filled fraction of total porosity at which the plant starts wilting permanently Han et al., 2012
2.3.3 Model parameter optimization and calibration
During model optimization, first, meteorological data were obtained from the flux Tower at CBF, other data and parameters listed in Table 1 were collected from the Science and Technology Resources Service System of National Ecosystem Observation Research Network (CNERN, http:// cnern.org.cn/) and derived from the scientific publications. Second, the field observed CO2, CH4 and N2O flux in 2015 were selected to optimize model parameters. The soil GHG flux were monitored and collected with the automatic dynamic chamber observation system as presented in 2.2. Third, the vegetation character, plant physiological and ecological indicators and soil properties were adjusted according to the comparison between the modeled value and measured data. The optimized parameters are presented in Table 1, and the calibrated results are shown in Table 2.
Table 2 Observed and model GHG emission and model performance in 2015
GHG N Observed emission Modeled emission Model performance
Mean Max Min Mean Max Min MA ${{r}^{2}}$ $r_{eff}^{2}$ $RMSP{{E}_{n}}$
CH4(Kg C ha-1 d-1) 276 -0.008 0.000 -0.023 -0.004 0.000 -0.010 51 0.260 <0 0.818
CO2(Kg C ha-1 d-1) 279 7.186 46.270 -3.871 7.439 24.5 0.68 103.5 0.633 0.928 0.236
N2O(g N ha-1 d-1) 289 1.150 33.586 -7.916 0.439 4.9 0.01 38 0.013 <0 1.039

2.4 Statistical methods

In order to verify model performance, the following parameters were selected for evaluating the Model effect:
Model Accuracy
MA=$\frac{{{{\bar{x}}}_{\text{mod}}}}{{{{\bar{x}}}_{\text{obs}}}}$×100% (4)
Coefficient of determination
${{r}^{2}}=\frac{{{\left( \mathop{\sum }^{}\left( {{x}_{\text{mod}}}-{{{\bar{x}}}_{\text{mod}}} \right)\times \left( {{x}_{\text{obs}}}-{{{\bar{x}}}_{\text{obs}}} \right) \right)}^{2}}}{\mathop{\sum }^{}{{\left( {{x}_{\text{mod}}}-{{{\bar{x}}}_{\text{mod}}} \right)}^{2}}\times \mathop{\sum }^{}{{\left( {{x}_{\text{obs}}}-{{{\bar{x}}}_{\text{obs}}} \right)}^{2}}}$ (0 ≤ r2 ≤ 1) (5)
Model efficiency
$r_{eff}^{2}=1-\left( \frac{\mathop{\sum }^{}{{\left( {{x}_{\text{mod}}}-{{x}_{\text{obs}}} \right)}^{2}}}{\mathop{\sum }^{}{{\left( {{x}_{\text{obs}}}-{{{\bar{x}}}_{\text{obs}}} \right)}^{2}}} \right)$ ($r_{eff}^{2}$≤1) (6)
Normalized root mean square prediction error
$RMSP{{E}_{n}}=\frac{\sqrt{\frac{\mathop{\sum }^{}{{\left( {{x}_{\text{mod}}}-{{x}_{\text{obs}}} \right)}^{2}}}{n}}}{SD}$ (7)
Here,${{x}_{\text{mod}}}$denotes modeled value and${{x}_{\text{obs}}}$denotes observed value,${{\bar{x}}_{\text{mod}}}$denotes mean value of modeled and${{\bar{x}}_{\text{obs}}}$denotes mean value of observed value, and the SD is the standard deviation of the observed data.

3 Results and discussion

3.1 Simulation of environmental factors

Under the influence of the continental monsoon climate, obvious seasonal trends of a hot and rainy summer, and cold and dry winter is indicated by the measured air temperature and precipitation in Changbai Mountain (Fig. 2a); considerable snow appears during winter (Fig. 2b). According to model simulation, Forest-DNDC could accurately simulate the time when the snowpack begins to melt (DOY 75) and snow begins to accumulate (DOY 302) when the temperature closes to 0°C, which should be determined by the correlation between air temperature and snowpack. Although there are some deviations in the simulation of snowpack, the model can accurately simulate whether there is covered with snow.
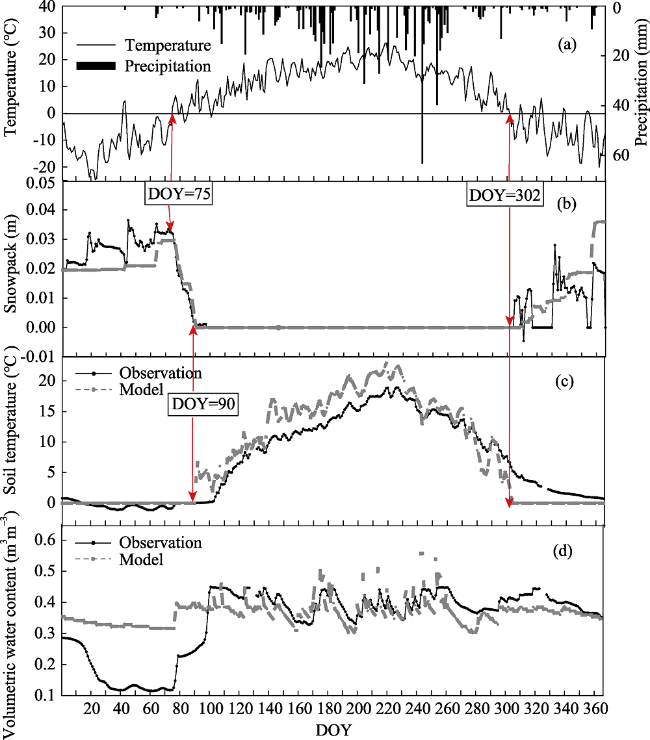
Fig. 2 Precipitation, air temperature (a), comparison of observed (black line) and Forest-DNDC model simulations (grey line) of snowpack (b), daily average soil temperature (c) and soil moisture at a soil depth of 0.1 m (d) in 2016 at Changbai mountain.
The snowmelt process was closely related to variation in soil temperature. Both the measured and simulated time of complete snow melt were coincident to the time of soil temperature exceeding 0°C (Fig. 2b and 2c). The simulation of soil temperatures was obviously underestimated in spring and autumn, indicating that the model could not effectively simulate dynamic changes in soil temperature, especially subzero temperatures during the non-growing season. Compared to the gradual increase of measured soil temperature, the modeled soil temperature increased rapidly after the snow melted completely at DOY 90 and decreased rapidly after snow appeared. The main reason for this phenomenon is that for exposed soils the soil surface temperature in Forest-DNDC was directly expressed as the soil adjustment temperature,
ST0=ST (8)
ST=$\frac{{{T}_{\text{air}}}+{{T}_{\text{max}}}}{2}$ (9)
When the ground is covered with snow, the soil temperature will be adjusted by the empirical formula,
ST0=$\frac{ST}{\left( 1+2000\times Snowpack \right)}$ (10)
Here, ST0 denotes surface soil temperature (°C); ST denotes soil adjustment temperature (°C); and Snowpack denotes snow thickness (m) (Li, 2016). Although the soil temperature and air temperature are basically positively correlated, due to insulation by snow, changes in soil temperature are different from changes in air temperature during snow cover (Guo et al., 2013).
With frequent rain in summer soil moisture changed greatly (Fig. 2d). The modeled soil moisture was higher in winter and early spring (January-March) and more variable in summer (Fig. 2d). One of the possible reasons might be that soil resistance increased in the freeze, resulting in smaller data as measured by the soil moisture analyzer (Xu et al., 2018). During the growing season, the modeled soil moisture seemed to be more correlated with occurrence of precipitation than measured soil moisture, and variations in the latter appeared to lag the former. Considering dense vegetation canopy in summer (LAI > 6.0) and water infiltration in soil, soil moisture probably should vary smoothly and with a time lag after rainfall. Therefore, further improvement of the model regarding rainfall redistribution will improve model performance.
Generally, Forest-DNDC performed satisfactorily in modeling soil temperature and moisture of the broad-leaved Korean pine forest in CBF. There are still uncertainties regarding soil heat transfer processes during soil freezing (Baishali et al., 2017), which was the main reason for the deviation in soil temperature and moisture simulation during the non-growing season, especially the freeze-thaw period.

3.2 Simulation of soil GHG flux

Using the optimized Forest-DNDC model, the simulation of dynamic changes of soil GHG flux was validated with field data at CBF in 2016. The observed and modeled average CH4 fluxes were very close, -5.44 and -5.41 g C ha-1 d-1, respectively. The modeled annual average CO2 flux value was 10.4 kg C ha-1 d-1, which was significantly lower than the measured 14.853 kg C ha-1 d-1. The modeled average N2O flux was 1.185 g N ha-1 d-1, which was lower than the measured 1.853 g N ha-1 d-1. Therefore, Forest- DNDC provided the unbiased estimation on annual average soil CH4 flux, while an obvious underestimated average CO2 flux and average N2O flux (Table 3).
Table 3 Observed and modeled GHG emission and model performance in 2016
GHG N Observed emission Modeled emission Model performance
Mean Max Min Mean Max Min MA ${{r}^{2}}$ $r_{eff}^{2}$ $RMSP{{E}_{n}}$
CH4(kg C ha-1 d-1) 329 -0.005 0.000 -0.017 -0.005 0.000 -0.020 99.3 0.021 0.100 0.928
CO2(kg C ha-1 d-1) 327 14.853 46.270 0.017 10.400 26.340 2.680 70 0.021 0.604 0.277
N2O(g N ha-1 d-1) 343 1.854 23.469 -2.048 1.185 9.690 0.010 63.9 0.030 < 0 1.159
3.2.1 CH4 flux
The modeled CH4 flux showed a similar seasonal trend to observed CH4 flux, with high absorption in summer and autumn, small absorption in winter and spring. However, there are still obvious differences between modeled and observed variations. Probably due to the limitation of resolution, the modeled flux was just 0 in the non-growing season and -0.01 kg C ha-1 d-1 during the growing season, respectively, and presented a quick stair-step development tendency between the growing season and the non-growing season. Combined with the change in modeled soil temperature, the modeled CH4 flux has a strong correlation with modeled soil temperature and snow cover. When the modeled soil temperature stabilized above 0 °C and snow disappeared, the modeled CH4 flux increased rapidly from 0 to -0.01 kg C ha-1 d-1, which was nearly the observed average value for the growing season.
The reason for the rapid change might be that after the melting of snow in spring, increased soil temperature and soil aeration means that soil microorganisms began to oxidize CH4 from the atmosphere (Li, 2016). In autumn, the opposite changes were shown as soil temperature decreased and snow began to accumulate. Therefore, modification of soil temperature and snowpack submodule in the Forest-DNDC model will improve model performance.
3.2.2 CO2 flux
Comparison results showed that modeled CO2 emissions have the same seasonal trend as observed values in general. The modeled flux was underestimated in the growing season, for example, the maximum CO2 flux in summer was 46.270 kg C ha-1 d-1 by observation and not different from previous research results (Geng et al., 2017; Xiao et al., 2004), but 26.340 kg C ha-1 d-1 from the model.
Previous studies have indicated that carbon inputs from the decomposition of litter have a significant impact on soil CO2 flux (Xiao et al., 2004; Zhou et al., 2005; Wang et al., 2008; Li, 2016). Due to a lack of simulations for mixed forest in the current Forest-DNDC version, this study selected types of pine forest. Therefore, it probably did not reflect the effect of broad-leaved litter characterized as having a low C: N ratio and more easily decomposed than pine litter, on the increment of soil substrate for microbial respiration and soil carbon emission, resulting in the underestimation of the CO2 flux (Li, 2016).
Meanwhile, a more obvious fluctuation of the modeled CO2 flux varied with the occurrence of rainfall in the growing season (Fig. 3b). Previous studies indicated that precipitation events not only change the temperature and moisture of the soil, but also influence the redox environment and molecular diffusion of the soil, for example, the higher soil water content was prone to a declining soil CO2 flux (Li et al., 1992; Dai et al., 2015; Wu et al., 2018). However, the modeled CO2 flux was very sensitive to precipitation events and is probably related to the simulation of the response of soil moisture to rainfall, which attained the highest in each rainfall (Fig. 2d).
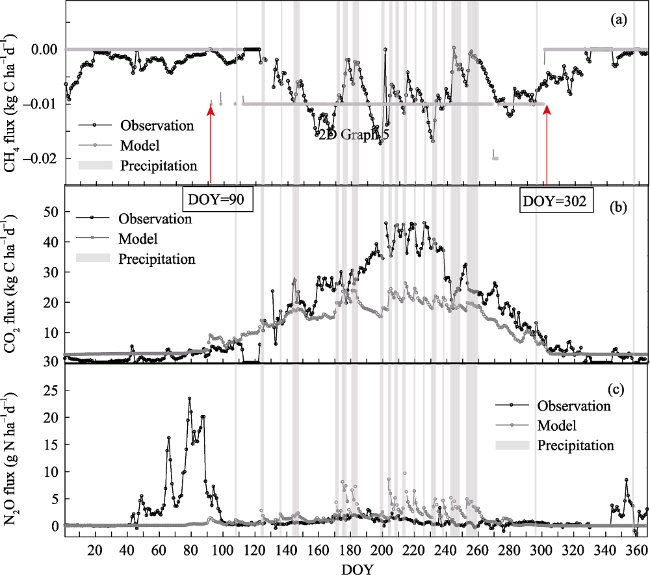
Fig. 3 Comparison of observed (black line) and Forest-DNDC model simulations (grey line) of daily average CH4 flux (a), CO2 flux (b) and N2O flux (c), the areas shaded in gray indicate periods of each precipitation >10mm, in 2016 at Changbai mountain.
3.2.3 N2O Flux
Soil N2O flux mainly comes from nitrification, denitrification and chemical denitrification (Stange et al., 2000). As shown in Fig. 3c, the observed peak of N2O flux occurred during the freeze-thaw period and the maximum flux was 23.469 g N ha-1 d-1, consistent with previous studies (Li et al., 2000; Kim et al., 2012), while N2O flux was quite small during other periods. Compared to the measured N2O flux, the simulated N2O flux attained the highest in the summer coincident to the air or soil temperature. The simulated N2O flux appeared to be sensitive to the occurrence of rainfall during the growing season, possibly because the anaerobic environment formed by precipitation reduces nitrification rapidly and N2O flux decrease.
There is still no consensus on soil N2O flux and its response to environmental changes (Cui et al., 2005; Li et al., 2018). Most researchers believe that soil in the freeze-thaw period is general in anaerobic conditions. The increase in soil temperature makes microbes more reactive, and the increasing denitrification reactions were the main reason for the increase in N2O (Bruijn et al., 2009). The modeled peak of N2O flux occurred in summer, consistent with the law that the nitrification reaction increases with temperature (Li, 2016). Whereas, the different sources of soil N2O might be the main reason leading to different patterns of modeled and observed N2O flux. The study area was the mature broad- leaved Korean pine forest, many studies show that dominant coniferous forest in the later stage of succession was often applicable to NH4+-dominated systems (or limited ability to use NO3-) and weak nitrification potential under the lower soil pH, and resulted in a lower N2O flux (Cui et al., 2005; Li et al., 2018). Stang et al. (2000) used Forest-DNDC to simulate N2O emissions in a Harvard pine forest with low nitrate content, the modeled result was also different from the measured flux (Stang et al., 2000). Therefore, further study was still necessary to identify the inherent mechanism and processes of N2O production in CBF, which will be useful to improve simulation of soil N2O flux.

3.3 Accumulative soil GHGs fluxes

The evaluation of ecosystem GHG budgets has received extensive attention using field measurements and model simulation. Fig. 4 presents the comparison between the measured and simulated accumulative soil CO2, CH4 and N2O fluxes in 2016. Despite different seasonal variations in measured and simulated CH4 flux, both the seasonal and annual accumulative CH4 flux were similar, except for winter (Fig. 4a). The annual accumulations were -1.80 kg C ha-1 and -1.78 kg C ha-1, respectively, with an absolute error of 1%. Therefore, while it is difficult to simulate daily dynamic changes of CH4 flux base using the Forest-DNDC, it is interesting to provide an effective estimate of the annual distribution and annual accumulation.
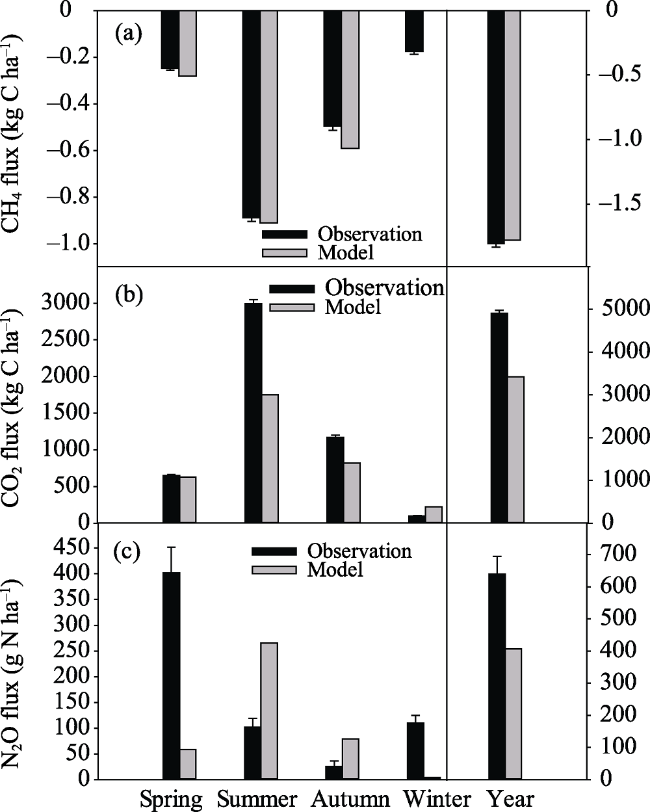
Fig. 4 Comparison of observed (black) and Forest-DNDC model simulations (grey) of accumulation CH4 (a), CO2 (b) and N2O (c) flux, in 2016 at the Changbai mountain.
For CO2 flux, the annual distribution of the observed and modeled CO2 flux showed a similar seasonal pattern, reaching peaks of 2992.32 kg C ha-1 and 1753.67 kg C ha-1 in summer and accounting for 60.93% and 51.24% of the annual total, respectively. But the model generally understated soil respiration, especially in summer. In terms of annual accumulation, which was 3421.86 kg C ha-1 and 4910.38 kg C ha-1, the simulation was also significantly lower than the observed flux mainly due to underestimation in summer (Fig. 4b).
For N2O flux, there were large deviations both in seasonal allocation and annual accumulations. The observed results showed that the peak N2O flux was in spring 401.58 g N ha-1,and other seasons were relatively low. The model results showed that the peak N2O flux was 265.26 g N ha-1 in summer (Fig. 4c).

4 Conclusions

Using high frequency and consecutive soil GHG flux measurements from an automatic dynamic chamber system, we attempted to test the applicability of the current Forest-DNDC model in simulating soil CH4, CO2 and N2O flux at a temperate broad-leaved Korean pine forest at Changbai Mountain. Through parameter optimization and preliminary validation, the following conclusions are made,
(1) The Forest-DNDC model accurately simulated the time when the snowpack began to melt and snow began to accumulate. The simulated soil temperature and the existence of snow cover were closely related: the simulated soil temperature changes dramatically after the melt or appearance of snowpack compared to gradual changes in the measured soil temperature. Probably due to the high sensitivity of soil moisture to the occurrence of rainfall in the model, the change in simulated soil moisture varied with rainfall and fluctuated more than the observed data during the growing season.
(2) Both field observation and model simulation showed that the CH4 flux reached the maximum in the growing season, and was regulated by soil temperature and snowpack. However, the simulated CH4 flux was more sensitive to changes in soil temperature and snowpack, which presented a dramatic change between the growing season and the non-growing season compared to the observed CH4 flux. The modeled soil CO2 flux had the same seasonal trend to that of the observation, high emissions in summer and autumn and low emissions in spring and winter due to the influence of temperature. However, the simulated CO2 flux in the growing season was underestimated obviously, probably related to the lack of simulation on mixed forest in the current Forest-DNDC. The simulated N2O flux attained its peak in summer due to the influence of temperature, which was apparently different from the observed peak in N2O flux in the freeze-thaw period. At the same time, both modeled CO2 flux and N2O flux were dampened by rainfall events.
(3) For seasonal allocation and annual accumulations of soil GHG fluxes, CBF soil was indicated to be the sink for CH4, source for CO2 and N2O sources by both field observation and model simulation. The modeled CH4 flux in different seasons closed to the observation, the annual accumulations were -1.80 kg C ha-1 and -1.78 kg C ha-1, respectively. The simulated CO2 flux was underestimated in summer, and the annual accumulation (3421.86 kg C ha-1) was 30% lower than observation (4910.38 kg C ha-1). The seasonal allocation and annual accumulation of simulated N2O flux significantly deviated from observed values.
In conclusion, the current Forest-DNDC model reproduced general patterns of environmental variables, such as soil temperature and soil moisture, and soil CH4 and CO2 flux. However, the internal parameters, estimation functions and simulation accuracy of the model still need optimization with long-term high-frequency observation data, especially the accurate description on variations in soil temperature and moisture, which influence soil GHG flux. Such improvements will provide an effective basis to retrieve long-term soil GHG fluxes and evaluate ecosystem carbon and nitrogen budgets at different scales.

Ackonwledgements

The authors would like to thank Dr. DENG Jia for valuable comments of improvements to the simulated results. Special thanks to Dr. GUO Xuebing for preparing input data in this study.

The authors have declared that no competing interests exist.

[1]
Aber J D, Reich P B, Goulden M L, et al.1996. Extrapolating leaf CO2 exchange to the canopy: A generalized model of forest photosynthesis compared with measurements by eddy correlation.Oecologia , 106(2): 257-265.

[2]
Amina M, Zhang M, Yu G R, et al.2013. Variation of the growing season and accumulated temperature for temperate mixed forest in Changbai Mountains during 1990-2010.Desert and Oasis Meteorology, 7(5): 44-50. (in Chinese)

[3]
Baishali D, Brian B G, Katelyn A C, et al.2017. Characterising effects of management practices, snow cover, and soil texture on soil temperature: Model development in DNDC.Biosystems engineering, 168: 54-74.

[4]
Batjes N H.1996. Total carbon and nitrogen in the soils of the world.European Journal of Soil Science, 47(2): 151-163.

[5]
Bouwman A F.1996. Direct emission of nitrous oxide from agricultural soils.Nutrient Cycling in Agroecosystems, 46(1): 53-70.

[6]
Butterbach-Bahl K, Kesik M, Miehle P, et al.2004. Quantifying the regional source strength of N-trace gases across agricultural and forest ecosystems with process based models.Plant and Soil, 260(1-2): 311-329.

[7]
Butterbach-Bahl K, Stange F, Papen H, et al.2001. Regional inventory of nitric oxide and nitrous oxide emissions for forest soils of southeast Germany using the biogeochemical model PnET-N-DNDC.Journal of Geophysical Research-Atmospheres, 106(D24): 34155-34166.

[8]
Cui X Y, Song J F.2005. Soil NH4+/NO3- nitrogen characteristics in primary forests and the adaptability of some coniferous species.Acta Ecologica Sinica, 25(11): 3082-3092. (in Chinese)

[9]
Dai Z, Johnson K D, Birdsey R A, et al.2015. Assessing the effect of climate change on carbon sequestration in a Mexican dry forest in the Yucatan Peninsula.Ecological Complexity, 24: 46-56.

[10]
de Bruijn A M G, Butterbach-Bahl K, Blagodatsky S, et al.2009. Model evaluation of different mechanisms driving freeze-thaw N2O emissions.Agriculture, Ecosystems & Environment, 133: 196-207.

[11]
Fenn M E, Poth M A, Aber J D, et al.1998. Nitrogen excess in North American ecosystems: Predisposing factors, ecosystem responses, and management strategies. Ecological Applications, 8(3): 706-733.

[12]
Geng J, Cheng S L, Fang H J, et al.2017. Soil nitrate accumulation explains the nonlinear responses of soil CO2 and CH4 fluxes to nitrogen addition in a temperate needle-broadleaved mixed forest.Ecological Indicators, 79: 28-36.

[13]
Geng S C, Chen Z J, Han S J, et al.2017. Rainfall reduction amplifies the stimulatory effect of nitrogen addition on N2O emissions from a temperate forest soil.Scientific Reports, 7: 1-10.

[14]
Gilhespy S L, Anthony S, Cardenas L, et al.2014. First 20 years of DNDC (Denitrification-Decomposition): Model evolution.Ecological Modelling, 292: 51-62.

[15]
Guo J W, Zou Y C, Huo L L, et al.2013. DNDC model, a model of biogeochemical processes: Research progress and applications.Chinese Journal of Applied Ecology, 24(2): 571-580. (in Chinese)

[16]
Han S J, Sun H L, Yu G R.2012. Data set of ecological system positioning observation and research in China: Forest ecosystem roll, Jilin Changbai Mountain Station: 2001-2008. Beijing: China Agricultural Press. (in Chinese)

[17]
Heinemeyer A.,and McNamara N P.2011. Comparing the closed static versus the closed dynamic chamber flux methodology: Implications for soil respiration studies.Plant and Soil, 346(1-2): 145-151.

[18]
IPCC. 2013. Anthropogenic and Natural Radiative Forcing. Climate Change 2013: The Physical Science Basis. Contribution of Working Group I to the Fifth Assessment Report of the Intergovernmental Panel on Climate Change. In: Stocker, T F, Qin D, Plattner G-K, et al. Cambridge: Cambridge University Press, United Kingdom and New York, NY, USA.

[19]
Jiang Y L, Zhou G S, Zhao M, et al.2005. Soil respiration in broad-leaved and Korean pine forest ecosystems, Changbai Mountain, China.Acta Phytoecologica Sinica, 29(3): 411-414. (in Chinese)

[20]
Kesik M, Ambus P, Baritz R, et al.2005. Inventories of N2O and NO emissions from European forest soils.Biogeosciences, 2(4): 353-375.

[21]
Kiese R, Li C S, Hilbert D W, et al.2005. Regional application of PnET-N- DNDC for estimating the N2O source strength of tropical rainforests in the Wet Tropics of Australia.Global Change Biology, 11(1): 128-144.

[22]
Kim D G, Vargas R, Bond-Lamberty B, et al.2012. Effects of soil rewetting and thawing on soil gas fluxes: a review of current literature and suggestions for future research.Biogeosciences, 9(7): 2459-2483.

[23]
Lamers M, Ingwersen J, Streck T.2007. Modelling N2O emission from a forest upland soil: A procedure for an automatic calibration of the biogeochemical model Forest-DNDC. Ecological Modelling, 205(1-2): 52-58.

[24]
Li C S.2016. Biogeochemical: Scientific basis and model method. Beijing: Tsinghua University Press, 253-437. (in Chinese)

[25]
Li C S, Aber J, Stange F, et al.2000. A process-oriented model of N2O and NO emissions from forest soils: 1. Model development.Journal of Geophysical Research-Atmospheres, 105(D4): 4369-4384.

[26]
Li C S, Frolking S, Frolking T A.1992. A model of nitrous oxide driven by rainfall events: 1. Model structure and sensitivity.Journal of Geophysical Research, 97(D9): 9759-9776.

[27]
Li C S.2000. Nutrient cycling in agroecosystems-modeling trace gas emissions from agricultural ecosystem.Nutrient Cycling in Agroecosystems, 58: 259-276.

[28]
Li M D, Liu L B, Ni J.2017. Modelling carbon cycle of karst evergreen and deciduous broad-leaved mixed forest during the last 50 years.Earth and Environment, 45(1): 96-105. (in Chinese)

[29]
Li P, Shi R J, Zhao F, et al.2018. Soil bacterial community structure and predicted functions in the larch forest during succession at the Greater Khingan Mountains of Northeast China. Chinese Journal of Applied Ecology. in Chinese)

[30]
Miehle P, Livesley S J, Feikema P M, et al.2006. Assessing productivity and carbon sequestration capacity of Eucalyptus globulus plantations using the process model forest-DNDC: Calibration and validation. Ecological Modelling, 192(1-2): 83-94.

[31]
Oertel C, Matschullat J, Zurba K, et al.2016. Greenhouse gas emissions from soils—A review.Chemie der Erde, 76: 327-352.

[32]
Piao S L, Fang J Y, Ciais P, et al.2009. The carbon balance of terrestrial ecosystems in China.Nature, 458(7241): 1009-1014.

[33]
Schindlbacher A, Zechmeister-Boltenstern S, Butterbach-Bahl K, et al.2004. Effects of soil moisture and temperature on NO, NO2, and N2O emissions from European forest soils. Journal of Geophysical Research-Atmospheres, 109: D17302.

[34]
Stange F, Butterbach-Bahl K, Papen H, et al.2000. A process-oriented model of N2O and NO emissions from forest soils 2. Sensitivity analysis and validation.Journal of Geophysical Research-Atmospheres, 105(D4): 4385-4398.

[35]
Sun J W, Wu J B, Ren L, et al.2016. Response of photosynthetic physiological characteristics to nitrogen addition by seedlings of two dominant tree species in a broadleaved-Korean pine mixed forest on Changbai Mountain.Acta Ecologica Sinica, 36(21): 6777-6785. (in Chinese)

[36]
Tian H Q, Lu C Q, Ciais P, et al.2016. The terrestrial biosphere as a net source of greenhouse gases to the atmosphere.Nature, 531(7593): 225-232.

[37]
Wang Q F, Nui D, Yu G R, et al.2004. Simulation study on CO2 and hydrothermal flux of forest ecosystem in Changbai Mountain.China Science Series D Earth Science, 34(Supplement II): 131-140. (in Chinese)

[38]
Wang X G, Zhu B, Gao M R, et al.2008. Soil CO2 efflux and simulation of Forest-DNDC model in the mixed plantation of alder and cypress in hilly areas of the central Sichuan Basin.Journal of Beijing Forestry University, 30(2): 27-32. (in Chinese)

[39]
Wang X G, Zhu B, Li C S, et al.2011. Dissecting soil CO2 fluxes from a subtropical forest in China by integrating field measurements with a modeling approach.Geoderma, 161(1-2): 88-94.

[40]
Werner C, Zheng X H, Tang J W, et al.2006. N2O, CH4 and CO2 emissions from seasonal tropical rainforests and a rubber plantation in Southwest China.Plant and Soil, 289(1-2): 335-353.

[41]
Wu D H, Ciais P, Viovy N, et al.2018. Asymmetric responses of primary productivity to altered precipitation simulated by ecosystem models across three long-term grassland sites.Biogeosciences, 15(11): 3421-3437.

[42]
Wu H, Peng C, Moore T R, et al.2014. Modeling dissolved organic carbon in temperate forest soils: TRIPLEX-DOC model development and validation.Geoscientific Model Development, 7(3): 867-881.

[43]
Wu J B, Guan D X, Zhang M, et al.2007. Carbon budget characteristics of the broadleaved Korean pine forests in Changbaishan Mountains.Journal of Beijing Forestry University, 29(1): 1-6. (in Chinese)

[44]
Xiao D M, Wang M, Wang Y S, et al.2004. Fluxes of soil carbon dioxide, nitrous oxide and firedamp in broadleaved/Korean pine forest.Journal of Forestry Research, 15(2): 107-112.

[45]
Xu H W, Li Jun, Li Jing, et al.2018. Comparison and analysis of soil resistivity between permafrost and non-permafrost.Technology Economic Guide, 26(12): 44. (in Chinese)

[46]
Yu G R, Zhang L M, Sun X M, et al.2004, Research progress on carbon flux observation of terrestrial ecosystems in the Asian region.China Science Series D Earth Science, 34(Supplement II): 15-29. (in Chinese)

[47]
Zhang M, Wen X F, Yu G R, et al.2010. Effects of CO2 storage flux on carbon budget of forest ecosystem.The Journal of Applied Ecology, 21(5): 1201-1209. (in Chinese)

[48]
Zhang Y, Li C S, Zhou X J, et al.2002. A simulation model linking crop growth and soil biogeochemistry for sustainable agriculture.Ecological Modelling, 151(1): 75-108.

[49]
Zheng X H, Wang R, 2017. Protocols for Chamber-Based Manual Measurement of CH4 and N2O Fluxes from Terrestrial Ecosystems. Beijing: Meteorology Press, 4-95. (in Chinese)

[50]
Zhou C Y, Zhou Y G, Wang Y H, et al.2005. Soil respiration of a coniferous and broad-leaved mixed forest in Dinghushan Mountain, Guangdong Province.Journal of Beijing Forestry University, 27(4): 23-27. (in Chinese)

Outlines

/