Orginal Article

Responding to Global Warming: Mitigation Policies and Actions of Stakeholders in China’s Tourism Industry

  • FENG Ling 1 ,
  • CHEN Da 2 ,
  • GAO Shan 1 ,
  • WANG Yongzhi 3 ,
  • TANG Chengcai , 1, *
Expand
  • 1. School of Tourism Sciences, Beijing International Studies University, Beijing 100024, China
  • 2. Department of Urban Studies and Planning, University of Sheffield, Sheffield S10 2TN, UK
  • 3. School of English Education, Beijing International Studies University, Beijing 100024, China
*Corresponding author: TANG Chengcai, E-mail:

Received date: 2018-09-18

  Accepted date: 2018-12-10

  Online published: 2019-01-28

Supported by

National Social Science Foundation of China (13CJY015)

National Natural Science Foundation of China (41301161)

Beijing Social Science Fund (14JGB025)

China National Tourism Administration Tourism Young Expert Training Program (TYETP201501).

Copyright

All rights reserved

Abstract

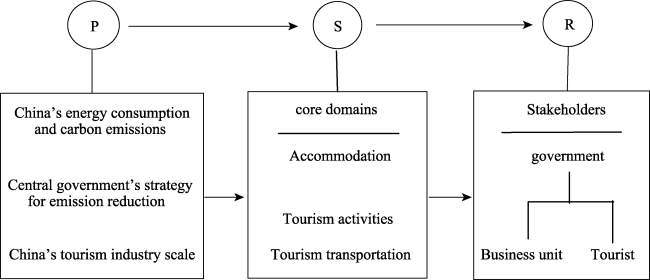
China’s tourism industry has witnessed rapid progress in recent years, and is now an important part of global tourism in dealing with climate change. Within a framework of Pressure-State-Response (PSR), this paper focuses on the emission reduction pressure, carbon emission status, and responses of stakeholders in China’s tourism industry. Findings include: 1) The central government’s strategy and rapid growth of the industry scale exert rising pressure on China’s tourism to reduce carbon emissions. 2) Carbon emissions of China's tourism account for 13%-14.6% of global tourism, and about 3% of China’s emissions overall. Chinese tourists’ per capita carbon emission is lower than half of the global level. 3) The Chinese government attaches great importance to energy-saving and carbon emission reduction. In the tourism industry, documents, standards and other regulative measures have been issued to ensure that business practitioners set up green operational and managerial systems. In the field of tourism transportation, China's high-speed rail, new energy vehicles, and urban shared bicycles, have developed very rapidly in recent years, and they have effectively reduced the carbon emissions in traveling. Furthermore, this paper finds that Chinese tourists already have awareness and willingness for low-carbon tourism.

Cite this article

FENG Ling , CHEN Da , GAO Shan , WANG Yongzhi , TANG Chengcai . Responding to Global Warming: Mitigation Policies and Actions of Stakeholders in China’s Tourism Industry[J]. Journal of Resources and Ecology, 2019 , 10(1) : 94 -103 . DOI: 10.5814/j.issn.1674-764X.2019.01.012

1 Introduction

The tourism industry is sensitive to climate change (Hein et al., 2009; Becken, 2013). At the same time, the tourism industry is an important source of greenhouse gases globally. A series of studies have shown that (UNWTO, 2017; Becken et al., 2006; Jones, 2013) by only taking into account tourism transportation, accommodation and activities, the industry has a great contribution to carbon dioxide emissions.
Therefore, the reduction of fossil energy consumption and control of greenhouse gas emissions have become the main propositions of the current global tourism (WTM, 2007; UNWTO, 2009). The World Tourism Organization (UNWTO) stressed at the Second Global Conference on Global Warming and Tourism in 2007: “Climate change is the most serious threatening factor to the sustainable development of tourism and the Millennium Development Goals of 21 century. All the Industry departments should act urgently, facing the climate change seriously”, and identified the theme of World Tourism Day in 2008 as “Tourism: Address the challenges of climate change” (Jones, 2013).
China has about one fifth of the world’s population and with the torrid growth of its national economy, the scale of its tourism industry has grown quickly, and this industry has become an indispensable part of the global carbon emissions of tourism (Shi et al., 2010; Shi and Wu, 2011; Yuan, 2013; Zhong, et al. 2014; Zhang, 2016). Under the pressure of global warming, how to respond to emission levels is essen-tial for tourism management departments, enterprises, tourists and other relevant stakeholders (UNWTO, 2017; WTM, 2007; UNWTO, 2009). In accordance with the strategies of UNWTO and China’s central government for energy saving and emission reduction, Chinese tourism stakeholders have taken a series of actions. Adopting a framework model of Pressure-State-Response (PSR) (OECD, 2017), this paper summarizes the related issues of China’s tourism industry, mainly focusing on China’s tourism energy-saving emission reduction policies and actions, and discusses the countermeasures of mitigating the impact of climate warming in the national economy and the rapid development of the tourism industry, in the hopes of providing reference and inspiration for the global tourism industry in coping with climate change.

2 Materials and methods

With the PSR framework model (Fig. 1), the relevant data, cases and other materials collected from China’s statistical yearbooks, industry reports, policy documents and websites, were organized. In this paper, “P” represents the pressure of carbon emission reduction of China’s tourism, which comes from the central government’s strategy and the growing industry scale. “S” represents the state of carbon emissions of the tourism industry, with the core domains including accommodation, tourism activities and transportation (UNWTO 2017). “R” represents the reaction of related stakeholders, that is, the appropriate actions for energy-saving and carbon emission reduction of governmental policy makers, operators of business units and tourists, which is the focused sector of this study.
Fig. 1 PSR model of carbon emission reduction in China’s tourism industry

3 Results

3.1 Pressure

According to the BP Statistical Review of World Energy (BIEE, 2017), from 2009 to 2015, China ranked the first in the world in total primary energy consumption (Fig. 2). Responding to this, at the United Nations Conference on Climate Change in Copenhagen in 2009, China officially announced the target of controlling greenhouse gas emissions for the first time. In 2020, the carbon emission per unit GDP will be reduced by 40%-45% compared with 2005 (State Council of China, 2017). In 2015, at the opening ceremony of the 21st Conference of the Parties to the United Nations Framework Convention on Climate Change in Paris, Chinese President Xi Jinping announced that, relative to the 2005 levels, by 2030 China will reduce carbon dioxide emissions per unit of GDP by 60% to 65%, raise the share of non-fossil fuel in primary energy consumption by about 20%, and increase forest stock by around 4.5 billion m3 (Central People’s Government of China, 2017).
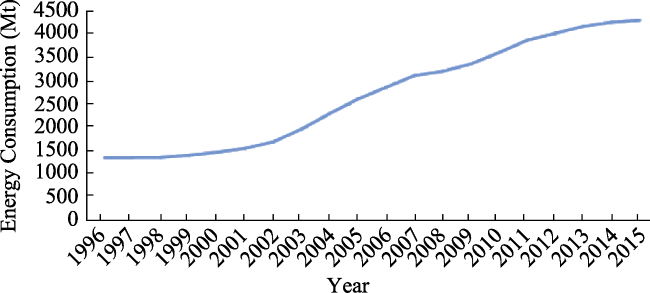
Fig. 2 China’s total energy consumption in the most recent 20 years
According to the data of the National Tourism Administration and National Statistical Office of China (CNTA 2017; NBS of China 1997-2016), in last few years, China has become the world's largest domestic tourism market, the world’s largest outbound tourism market and the fourth largest inbound tourism reception country. The number of domestic tourists in China increased from 644 million in 1997 to 4.44 billion in 2016, with an average growth of 10.13% per year (Fig. 3); and the inbound tourists increased from 51.12 million in 1997 to 138 million in 2016, with an average growth of 3.8% per year (Fig. 4). Consequently, China’s tourism industry is under heavy pressure to reduce carbon emissions.
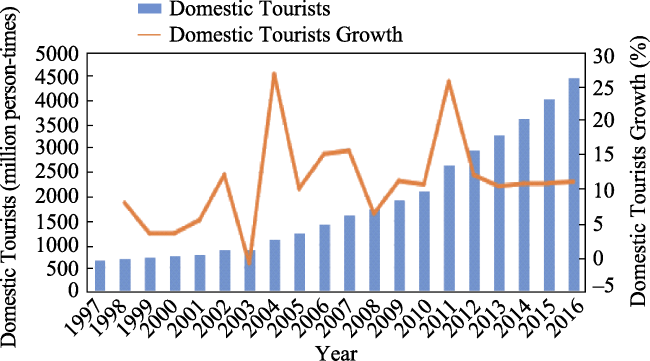
Fig. 3 China’s domestic tourists in the last 20 years
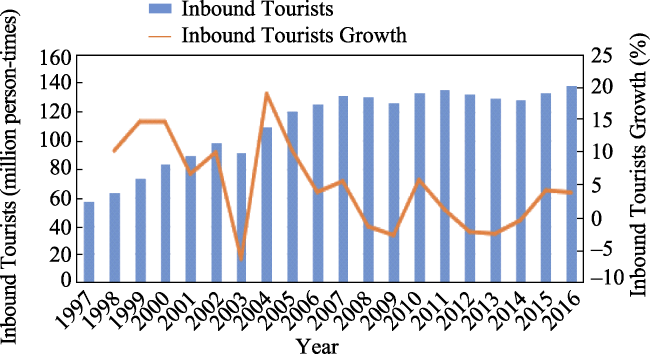
Fig. 4 China’s inbound tourists in the last 20 years

3.2 State

Some Chinese scholars have assessed the carbon emissions of China’s tourism industry. Taking account of transportation, star hotels and some of the tourism activities, it was estimated by Shi and Wu (2011) that carbon dioxide emissions of China’s tourism industry were 51.34 Mt in 2008, which accounted for 0.86% of the total emission for China. Yuan Y (2013) point out that the study of Shi P only measured the direct part of the energy consumption and carbon emissions of tourism, but in fact, meeting the needs of tourism products and services also requires a lot of indirect energy consumption and carbon emissions. He followed a different approach by using the input-output analysis methodology and calculated that the indirect carbon dioxide emissions of China’s tourism in 2007 was 162.84 Mt, accounting for 2.93% of the total carbon dioxide emissions from China’s national indirect energy consumption. Zhong et al.Zhang et al. research basically supports this result. Zhong et al. (2014), resorting to life cycle assessment theory and the input-output analysis method, put forward that the total carbon dioxide emissions from China’s tourism industry in 2007 was 169.78 Mt, with direct emissions of 73.56 Mt and indirect emissions of 96.23 Mt, and that tourism accounted for 2.71% of the total carbon dioxide emissions of all industries in China. Using input-output method and literature integration method, Zhang et al. (2016) calculated that the carbon dioxide emissions of China’s tourism industry in 2007 were 190.48 Mt, accounting for 3.17% of the Chinese total emissions in this year. Among them, the direct emissions were 74.97 Mt, and indirect emissions were 115.51 Mt; and China’s tourists’ carbon dioxide emissions per capita were 0.114t, which is significantly lower than the level of 0.25t reported by UNWTO as the global tourism carbon emissions per person.
According to the more comprehensive studies above, the total carbon dioxide emissions of China’s tourism industry in 2007 ranged from 169.78 to 190.48 Mt, accounting for about 3% of Chinese total in this year. Based on the per-capita calculations above we can find that China’s tourism industry has taken efficient actions to reduce the carbon dioxide emissions.

3.3 Response

3.3.1 Government policy
In China, the government plays a central role in social affairs. In response to global warming, the Chinese government has promulgated 1052 policies for energy-saving and emission reduction from 1997 to 2013 (Zhang et al., 2017). In reference to the related literature, there are 16 policies directly related to the tourism industry, without considering transportation. Among them, there are 4 for the whole tourism industry, 7 for hotel and accommodation, and 5 for the scenic areas. See Table 2 for more details.
Table 1 Carbon dioxide emissions of China’s tourism industry
Scholars Year Carbon dioxide
emissions (Mt)
Contribution to regional
total emissions (%)
Emissions per capita
(t/capita)
Shi P H; Wu P 2008 51.34 0.86 ——
Yuan Y J 2007 162.84 2.93 ——
Zhong Y; Shi S Y; Li S H 2007 169.78 2.71 ——
Zhang C L 2007 190.48 3.17 0.114
Table 2 Policies of China’s tourism industry for energy-saving and carbon emission reduction
Serial
number
Domain Year Title Classification Departments
1 Industry policy 2008 Several Opinions on Tourism in Addressing
Climate Change
Ministry normative
documents
National Tourism Administration
2 2008 Notice on Further Strengthening the Energy
Conservation Work of Tourism Industry
Ministry normative
documents
National Tourism Administration
3 2009 Opinions on accelerating the development of
tourism
State Council
normative documents
The State Council
4 2010 Opinions on Further Promoting Energy Saving
and Emission Reduction in Tourism Industry
Ministry normative
documents
National Tourism Administration
5 Accommodation 1993 Star-rating Standard for Tourist Hotels
(GB/T14308-1993)
National Standard National Tourism Administration
6 1993 Energy Conservation Design Standard on
Building Envelope and Air Conditioning for
Tourist Hotels (GB/50189-93)
National Standard State Bureau of Technical Supervision, Ministry of Construction
7 2006 Green Hotels (LB/T007-2006) Industry Standard National Tourism Administration
8 2009 Cleaner Production Standard Hotel
(HJ514-2009)
Industry Standard Ministry of Environmental Protection
9 2010 The Rationality of Electricity Usage in
Guesthouse and Hotel (GB/T12455-2010)
National Standard State Quality Supervision Bureau
10 2010 Hotel Energy-saving and
Emission Reduction 100
Departmental regulations National Tourism Administration
11 2011 Guidelines for Energy-saving and Emission
Reduction of Tourist Hotel (LB/018-2011)
Industry Standard National Tourism Administration
12 Scenic areas 1999 Standard of Rating for Quality of Tourist
Attractions (GB/T 17775-1999)
National Standard National Tourism Administration
13 2010 Construction and Operation Guidelines for
Prototype-zone of National Ecotourism
Attractions (GB/T26362-2010)
National Standard National Tourism Administration and Ministry of Environmental Protection
14 2010 A-level Scenic Area Energy-saving and
Emission Reduction 30
Departmental regulations National Tourism Administration
15 2011 Green Tourist Attraction (LB/T 015-2011) Industry Standard National Tourism Administration
16 2016 Demonstration Destination for Green
Tourism (LB/T 048-2016)
Industry Standard National Tourism Administration
In the table above, there are 3 milestone policies. Firstly, Several Opinions on Tourism in Addressing Climate Change (CNTA, 2017), issued in 2008 by China’s National Tourism Administration, points out for the first time ever that responding to climate change is an indispensable aspect of the sustainable development of the tourism industry. Secondly, the State Council’s Opinions on Accelerating the Development of Tourism (State Council of China, 2017), issued in 2009, clearly specified quantitative requirements that water and electricity consumption of star hotels and A-Class scenic spots be reduced by 20% in 2009 compared with 2005. Thirdly, Opinions on Further Promoting Energy Saving and Emission Reduction in Tourism Industry, issued in 2010 by the National Tourism Administration, attached two appendices respectively entitled 100 guidelines for hotels and 30 guidelines for A-level scenic areas (CNTA, 2017). After the last of these policies, the National Tourism Administration carried out special inspector work in Hebei and Shandong Provinces, and some local tourism authorities also worked out corresponding policies and measures for energy-saving and carbon emission reduction.
3.3.2 Accommodation
China has attached great importance to Accommodation for energy-saving and carbon emission reduction. Early in 1993, China issued Star-rating Standard for Tourist Hotels (GB/T14308-1993) (1993), which was revised in 2010 to include requirements on green design, clean production and green consumption. According to the National Tourism Administration statistics, by the first quarter of 2016, a total of 12678 star hotels had been certified as satisfying the aforesaid requirements. In 2006, China promulgated Green Hotels (LB/T007-2006) (2006), which divided green hotels into the two categories of the Golden Leaf and the Silver Leaf, on the basis of an overall assessment from the perspective of green design, clean production and clean consumption. The Hotel Energy-saving and Emission Reduction 100 was issued in 2010 (CNTA, 2017), which developed a total of seven major guideline categories: reducing energy waste, reducing water use, energy measurement, energy management and operation, building energy efficiency, equipment selection and management, and energy conservation and training. Then in 2011, mainly using Hotel Energy-saving and Emission Reduction 100, the Guidelines for Energy-saving and Emission Reduction of Tourist hotel (LB/018-2011) (2011) was issued, which effectively motivated the hotel industry to carry out energy-saving and carbon emission reduction work.
In recent years, China’s accommodation sector has developed new trends in energy saving and environmental protection. The Naked Stables is a classic case in the Chinese holiday and accommodation industry in recent years (Naked Hotel & Resort Management Co., Limited 2017)1(1Naked Hotel & Resort Management Co., Limited, 2017. Available online: http://www.nakedretreats.cn/naked-stables/zh-CN/. (accessed on 20 May 2017)), which is located in Moganshan Town, Deqing County, Zhejiang Province. “Naked” means to live away from the hustle and bustle of the city, so that life can return to natural purity and achieve self-balance. Naked Stables is dedicated to providing guests with a unique, immersive experience and it is the first in China to achieve Platinum certification from Leadership in Energy and Environmental Design (LEED). The rooms—earth huts and tree huts—are mainly made of local renewable materials with a structural insulation board, solar water heaters, Light Emitting Diode (LED) energy-saving lamps, rainwater collection and recycling devices. The daily operation uses biodegradable environmental protection soap and other cleaning supplies. The village also has many ecological activities such as farming, fishing, and tea cultivation. Since 2010, following its low- carbon and back-to-nature philosophy, Naked Stables has achieved great success with 153 day full-occupancy in 2016. Naked Stables is a high-end resort in China, with Table 3 listing the room price intercepted from its website on May 17, 2017 (Naked Hotel & Resort Management Co., Limited 2017)2(2Naked Hotel & Resort Management Co., Limited, 2017. Available online:http://www.nakedretreats.cn/booking/room.html?hotelCode=H000002& lang=zh-CN&showDebug=false. (accessed on 20 May 2017)). Despite such high prices, the success of the Naked Stables shows that environmentally friendly philosophies are gaining endorsement and popularity among Chinese holiday takers.
Table 3 Price of Naked Stables on weekends
Person Room Price
2 Earth Hut with Round Bed From 2800.00 Yuan / Night
4 2-Bedroom Tree Top Villa From 7200.00 Yuan / Night
6 3-Bedroom Tree Top Villa From 10800.00 Yuan / Night
3.3.3 Tourism activities
In China, tourism activities are generally carried out in scenic areas. China attaches great importance to energy saving and emission reduction in scenic areas. The most important document for scenic area management in China is the Standard of Rating for Quality of Tourist Attractions (GB/T17775-1999) (1999). In this standard, items of environment protection, resource conservation, waste disposal, energy saving measures and low-carbon touring, are strictly required. By the end of 2017, China had certified 249 National AAAAA Scenic Areas and 1284 National AAAA Scenic Areas, which include almost all of the important scenic resources in the country(CNTA, 2017). To obtain these ratings, these areas must achieve a high score requirement in resource conservation, environmental protection and energy saving. In 2010, A-level Scenic Area Energy-saving and Emission Reduction 30 was issued (CNTA, 2017), which provides guidance in the following 6 categories: environment protection, resource conservation, waste disposal, energy management, low-carbon touring and operation management, and has strongly promoted the work in this field.
China has made efforts to provide guidance for scenic area green development in four other areas. First, the National Tourism Administration issued Green Tourist Attraction (LB/T015-2011), which made detailed requirements on scenic resources protection, planning and construction, clean production, green services, green management and other aspects, but this has not been carried out substantively. Second, the National Tourism Administration and Ministry of Environmental Protection developed the Construction and Operation Guidelines for Prototype-zone of National Ecotourism Attractions (GB/T26362-2010) (2010), which specified requirements on scenic planning, ecological and environmental quality, traditional cultural protection, infrastructure and other aspects. Based on assessment in accordance with the aforesaid Norms, the two governmental agencies certified 39 demonstrative zones in 2013, 37 in 2014 and another 35 in 2015. Thirdly, in 2016 the National Tourism Administration developed Demonstration Destination for Green Tourism (LB/T048-2016) (2016), which made the request of the tourism area of space organizations, the quality of the ecological environment and comprehensive conditions of service. Ten tourist resorts, including Changbai Mountain of Jilin Province, were identified as the first group of candidates. Finally, China is actively seeking international certification. The Ministry of Environmental Protection assessed seven scenic areas as ISO14000 national demonstration areas in 2007 (MEP of China, 2017), but since then efforts of this kind have stopped.
3.3.4 Tourism transportation
(1) High-speed Railway. In recent years, the high-speed railway has been the most important transportation mode promoted by Chinese government, and it has become the most frequently chosen transportation option for medium-long distance tours thanks to its fast speed, easy accessibility and comfortableness. At the end of 2015, the total length of the high-speed railway in China reached 19000 km which ranked the first in the world (Liu, 2016). According to the Medium- and Long-term Railway Network Plan (NDRC of China, 2017), by the year 2020, China’s high- speed railways will reach 30000 km connecting 80% of China’s major cities. Research shows that due to the transportation and usage of large quantities of steel and cement, the energy consumption in construction of the high-speed railway is quite high (Kemp, 2004; Chang and Kendall, 2011). But considering that the trains are driven by the clean energy of electricity and operate at high energy efficiency in the high-speed state, for the whole life cycle it has better energy savings and emission reduction effects. According to Zhou X’s report (Zhou, 2015), when the CRH380A(L) train runs at a speed of 300 km per hour on the Beijing-Guangzhou high-speed railway, the per capita energy consumption for 100 kilometers is only 3.64 kWh, equivalent to 1/2 that of an airliner, 1/8 that of an automobile, or 1/3 that of a bus.
(2) New Energy Vehicles. New energy vehicles have developed rapidly in recent years. Nowadays more and more tourist destinations and scenic spots choose new energy vehicles as a part of tourist traffic. In 2009, 2011 and 2016, Notice on Starting New Energy Vehicles Pilot Promotion, Notice on Furthering New Energy Vehicles Pilot Promotion, and Notice on Adjusting the Application of Financial Subsidy Policy for New Energy Vehicles were promulgated, respectively, (MOF of China et al., 2017), which together granted the financial subsidies for the production and purchase of new energy vehicles and offered preferential measures for obtaining licenses, daily traffic and maintenance. According to China’s New Energy Automotive Industry Development Report (CATARC, 2016), the sales of a variety of plug-in hybrid electric vehicles (PHEV) and pure electric passenger cars increased from 2.74×10⁴ in 2012 to over 7.0×10⁵ in 2016. According to the Energy Conservation and New Energy Automotive Industry Development Plan (2012-2020) (State Council of China, 2017), the total number of new energy vehicles is expected to be more than 5 million by 2020. According to Tang B’s case study of Beijing City, the promoted new energy electric vehicles will save 154 billion kWh of electricity and reduce emissions by 39.4 Mt of carbon dioxide by 2020 (Tang et al., 2016)
(3) Urban Shared Bicycles. According to The Bike-sharing World Map (Meddin, 2017), there were about 946000 public bicycles in the whole world in 2014, of which about 750500 were in China. From 2016, bike sharing has developed explosively in major cities of China, and many tourists choose bike riding as one popular means of city travel. Through the 2017 White Paper of Shared Bicycle and Urban Development (Tongheng UDL, 2017), shared bicycles have entered 50 cities covering more than 20 provinces, and have become the third most frequently used mode of transportation after subways and taxis in Chinese cities. Shared bicycles can significantly replace other modes of transportation (Fishman et al., 2015). After the launch of shared bicycles, in the year ending April 2017, car use for short trips had been reduced by 55%, equivalent to reducing 54 Mt of carbon emissions (Tongheng UDL, 2017).
3.3.5 Tourist
As reflected in the case of Naked Stables (Naked Hotel & Resort Management Co., Limited, 2017), Chinese tourists already have a high awareness and willingness for energy conservation and eco-environmental protection, which can be corroborated from several surveys of Chinese tourists. The results of Tang M’s survey of tourists in Lijiang City (Tang et al., 2014), show that 68.5% of visitors have a high awareness of low-carbon tourism, that 87.5% and 57.5% of visitors believe that changing modes of tourism traffic and accommodation can reduce the carbon emissions of tourism, respectively, and that the willingness of low-carbon tourism is generally high (79.5%). But at the same time, 91% of tourists believe that public awareness is the primary factor for affecting the implementation of low-carbon tourism. Zhang et al. (2016) conducted a survey of tourists in the Gulangyu Island and reached similar conclusions. More than 80% of the tourists are willing to learn low-carbon tourism-related knowledge, to participate in low-carbon theme travel, to travel bringing their own toiletries, to reduce the purchase of excessively packaged products, to turn off the lights, television, air conditioning and other electrical appliances when they leave the hotel and to be involved in garbage recycling in exchange for small gifts. But when it comes to behaviors that incur inconvenience, such as car-sharing in self-driving tours, reducing the frequency of towel and sheet replacement in the hotel and always buying low-carbon tourism products (if at a higher price), visitors who are willing to adopt these behaviors dropped to 59.3 %, 63.2% and 62.4% respectively.

4 Discussion and conclusions

4.1 Discussion

In the context of global warming, as a responsible country, China has twice announced its commitment to energy-saving and carbon emissions reduction to the international community in 2009 and 2015. The tourism industry is one of the fastest growing sectors in China’s economy, and therefore it is faced with heavy pressure on carbon emission reduction.
The carbon dioxide emissions of China’s tourism in 2007 were between 169.78 Mt and 190.48 Mt (Zhong et al., 2014; Zhang, 2016). In comparison with the 1302 Mt for global tourism reported by the UNWTO in 2005 (UNWTO, 2017), China’s tourism contributed about 13% to 14.6%. In developed countries such as the Netherlands, New Zealand and Sweden, the contributions of carbon emissions of tourism to the national totals were about 10% (Bruijn et al., 2013; Smith and Rodger, 2009; Gössling and Hall, 2008), which is basically twice the global average of 4.9% (Table 4). In 2007, carbon emissions of the tourism industry accounted for about 3% of the Chinese total, slightly lower than the global average in 2005. This can be partly explained from the article by Zhang et al. (2016), which shows that the level of Chinese tourist carbon dioxide emissions per capita is only 0.114 t, significantly lower than the level of 0.25 t in global tourism, and far below the level of 0.42 t of developed countries like the Netherlands. In addition, as China is in the process of rapid economic development, tourism only accounts for a small proportion of the emissions of all economic activities (Gu and Li, 2016).
Table 4 Tourism carbon dioxide emissions of the world and some developed countries
Cases Year Carbon dioxide
emissions (Mt)
Contribution to
regional total
emis sions (%)
Emissions
per capita
(t)
World 2005 1302 4.90 0.25
Netherlands 2012 15.4 9.3 0.42
New Zealand 2009 7.9 10.23 ——
Sweden 2005 6.03 11 ——
Among the stakeholders of China’s tourism industry, the National Tourism Administration and related government departments are the leading force, having issued 16 policies aimed at promoting energy-saving and emission reduction. Most of them are standards, to guide and provide incentives for hotels and scenic areas to establish management systems for saving energy and reducing carbon emissions. In tourism transportation, respectively promoted by governmental investment and financial subsidies, China’s high-speed railway and new energy vehicles have developed rapidly in recent years, and have effectively reduced the energy consumption and carbon emissions of medium-long distance tours. Within city tourism, the shared bicycles provided by enterprises have quickly become popular since 2016 in China, making short-distance traffic carbon free. In addition, with the continuous improvements of people’s incomes and government propaganda, Chinese tourists’ awareness and willingness to save energy and protect the environment has gradually increased. According to the experiences from Organization for Economic Co-operation and Development (OECD) countries (OECD, UNEP, 2017), tourism policies responding to climate change generally include five aspects: 1) a scientific assessment of tourism energy consumption and corresponding emissions, to provide a scientific basis for emission reduction decisions and enhance stakeholders’ awareness; 2) simultaneous measures, including technological innovation, emissions management, tourism behavior adjustment, education, research and development and others; 3) carbon taxes, emissions trading and other economic instruments, through market-oriented means for adjustment; 4) standards, such as energy-saving building standards, green hotel standards and other constraints; and 5) incentive mechanisms, to provide economic, financial, tax and other incentives for motivating individuals or institutions in energy conservation and emission reduction. In contrast, China’s tourism has explored all of the above aspects, particularly in policy guidance, standard constraints and government subsidies, but efforts in these five aspects still need to work collaboratively in a systematic framework.

4.2 Conclusions

Using the PSR framework, this summary shows that China’s tourism industry is a rapid growing part of global tourism and China’s economy, which faces heavy pressure to achieve carbon emissions reduction. Initially driven by the central government, stakeholders of the tourism industry now participate in energy-saving and carbon emission reduction, which have effectively reduced the carbon emissions of tourism.
(1) In 2007, the carbon emissions of China’s tourism ranged from 169.78 Mt to 190.48 Mt, accounting for 13% -14.6% of global tourism, and about 3% of China’s total emissions. Chinese tourists’ per capita carbon emission is lower than half of the global level. Stakeholders of the tourism industry include the Chinese government, companies from many industries including tourism and tourists, and they have already begun to take measures.
(2) In the tourism industry, documents, standards and other regulative measures have been issued to ensure that business practitioners set up green operational and managerial systems. In reference to the related literature, there are 16 policies directly related to the tourism industry without transportation, urban and rural planning and many other industries.
(3) In the accommodation industry, in addition to escalating industry standards and norms, there is a new trend toward building and operating hotels in an energy-saving and advanced-technology manner, which has advanced great success.
(4) In the field of tourism transportation, China’s high- speed rail, new energy vehicles, and urban shared bicycles, have developed very rapidly in recent years. These new modes of transportation have effectively reduced travelers' carbon footprint across cities and tourism attractions.
(5) In the construction of tourist attractions, the most important document for scenic area management, Standard of Rating for Quality of Tourist Attractions (GB/T17775- 1999), has been upgraded several times and has proposed more detailed standards on the targets of energy-saving emission reduction.
(6) In the survey studies among tourists, we find that Chinese tourists have already shown awareness and willingness to carrying out low-carbon activities, but also need to be guided with a better social atmosphere.

4.3 Policy recommendations

China’s tourism industry has developed rapidly in recent years and has been under tremendous pressure to reduce carbon emissions. Tourism stakeholders have also responded to the reduction of tourism carbon emissions after China formally announced its goal of controlling greenhouse gas emissions, and the leading role of the Chinese government cannot be ignored. Among the energy-saving and emission-reducing policies directly promulgated by the government, in addition to the requirements of the entire industry they also include the requirements of stakeholders such as the construction and management of scenic areas and hotels. Other sectors of the policy formulation also contain elements that are closely linked with the tourism industry. In the future, the government should pay attention to the policies and supervision in the tourism industry. With the development of information technology and the rapid expansion of related industries some changes have taken place in such activities as travel, accommodation and catering in recent years. Relevant departments should keep pace with the times and make use of these changes to carry out practicable energy conservation and emission reduction activities.
Tourism-related enterprises are important players in energy-saving emission reduction activities. Increasing costs are inevitable in the process of upgrading hardware and software, but the business managers should realize that energy conservation and emission reduction are imperative. Whether in response to a government request or part of corporate social responsibility, energy conservation and emission reduction will surely bring long-term benefits and balance.
Tourists are an important part of the energy conservation and emission reduction in tourism. It is necessary to strengthen publicity and actively guide “low carbon” consumption behavior. The hotel should guide the guests to understand and support the hotel's energy-saving and water-saving measures, and reward the guests who voluntarily reduce linen washing and the consumption of supplies. The scenic spots should set up tips and initiatives on energy conservation and environmental protection, advocate the concepts of green consumption and moderate consumption, and accelerate the adoption of consumption patterns that are beneficial to resource conservation and environmental protection.

4.4 Limitations and future research directions

This article focuses on the work and progress of tourism stakeholders in energy conservation and emission reduction, which remains inadequate in the following areas.
First, in the aspect of government research, both government supervision and management measures of enterprises are important parts of the government's law enforcement and energy conservation and emission reduction. In future research, we can sum up the experience through the study of specific cases and summarize the experiences and lessons for the future energy conservation and emission reduction work.
Second, in transportation, public transport at tourist destinations is also important. Convenient and reasonable public transportation can reduce carbon emissions, which is not discussed in this article. For example, the extensive development of electric buses cannot neglect the role of energy conservation and emission reduction in the city.
Third, this article mainly takes China as the research object, so it lacks the comparative study of related cases in the same period throughout the world. In the future, we can find the suitable ways and the research directions for energy saving and emission reduction in China by taking the experiences and lessons of both developed and developing countries as examples.

The authors have declared that no competing interests exist.

[1]
Becken S, Patterson M, Viner D.2006. Measuring national carbon dioxide emissions from tourism as a key step towards achieving sustainable tourism. Journal of Sustainable Tourism, 14(4): 323-338.

[2]
Becken S.2013. A review of tourism and climate change as an evolving knowledge domain.Tourism Management Perspectives, 6: 53-62.

[3]
British Institute of Energy Economics. 2017. BP statistical review of world energy 2016. Available online:

[4]
Bruijn K, Driven R, Eijgelaar E.20132013. Travelling large in 2012: the carbon footprint of dutch holidaymakers in 2012 and the development since 2002. Centre for Sustainable Tourism and Transport, NHTV, Breda, Netherlands, 2013. Available online:

[5]
Central people’s Government of the People's Republic of China. 2017. Enhanced actions on climate change: China’s intended nationally determined contributions. Available online: Available online:

[6]
Chang B, Kendall A.2011. Life cycle greenhouse gas assessment of infrastructure construction for California’s high-speed rail system.Transportation Research Part D: Transport and Environment, 16(6): 429-434.

[7]
China Automotive Technology and Research Center. 2016. China’s new energy automotive industry development report (2016). Beijing, China: Social Science Literature Publishing House. (in Chinese)

[8]
China National Tourism Administration. 2017a. China tourism development report (2016). Available online: accessed on 20 May 2017). (in Chinese)

[9]
China National Tourism Administration. 2017b. Guidance on further promoting energy conservation and emission reduction in the tourism industry. Available online: . 2017b. Guidance on further promoting energy conservation and emission reduction in the tourism industry. Available online: in Chinese)

[10]
China National Tourism Administration. 2017c. National A-class tourist attractions online publicity list. Available online: . Available online: accessed on 20 May 2017).(in Chinese)

[11]
China National Tourism Administration. 2017d. Several opinions on tourism in addressing climate change. Available online: Available online: accessed on 20 May 2017). (in Chinese)

[12]
Fishman E, Washington S, Haworth N, et al.2015. Factors in influencing bike share membership: Analysis of Melbourne and Brisbane.Transportation Research Part A: Policy and Practice, 71: 17-30.

[13]
GB/T 26362-2010B/T 26362-2010. 2010. Construction and operation guidelines for prototype-zone of national ecotourism attractions. Beijing,China: China Tourism Press. (in Chinese)

[14]
GB/T 14308-1993B/T 14308-1993. 1993. Star-rating standard for tourist hotels. Beijing,China: China Statistics Press. (in Chinese)

[15]
GB/T 17775-1999B/T 17775-1999. 1999. Standard of rating for quality of tourist attractions. Beijing, China: China Tourism Press. (in Chinese)

[16]
Gössling S, Hall M.2008. Swedish tourism and climate change mitigation: An emerging conflict?Scandinavian Journal of Hospitality and Tourism, 8: 141-158.

[17]
Gu A L, Li Z Q.2016. Effects of economic structure change on carbon emissions of China: Analysis based on IO-SDA Model.China Population, Resources and Environment, 26(3): 37-45. (in Chinese)

[18]
Hein L, Metzger MJ, Moreno A.2009. Potential impacts of climate change on tourism: A case study for Spain.Current Opinion in Environmental Sustainability, 1(2): 170-178.

[19]
Jones C.2013. Scenarios for greenhouse gas emissions reduction from tourism: An extended tourism satellite account approach in a regional setting.Journal of Sustainable Tourism, 21: 458-472.

[20]
Kemp R.2004. Transport energy consumption.Power Engineer, 10: 1-7.

[21]
LB/T 048-2016B/T 048-2016. 2016. Demonstration Destination for Green Tourism. Beijing,China: China Tourism Press. (in Chinese)

[22]
LB/T 018-2011B/T 018-2011. 2011. Guidelines for Energy-saving and Emission Reduction of Tourist hotel. Beijing, China: China Statistics Press. (in Chinese)

[23]
LB/T 007-2006 007-2006. 2006. Green Hotels. Beijing,China: China Statistics Press. (in Chinese)

[24]
Liu Z J.2016. China’s first published “China’s transport development” . People’s Daily, 2016-12-30. (in Chinese)

[25]
Meddin R, DeMaio P. 2017. The bike-sharing world map. Available online: DeMaio P. 2017. The bike-sharing world map. Available online:

[26]
Ministry of Environmental Protection of the People’s Republic of China. 2017. Administrative measures for the national demonstration zone of ISO 14000.Available online: accessed on 20 May 2017) (in Chinese)

[27]
Ministry of Finance of China, Ministry of Science and Technology of China. 2017. Notice on starting new energy vehicles pilot promotion. Available online: Available online: accessed on 20 May 2017). (in Chinese)

[28]
Ministry of Finance of China, Ministry of Science and Technology of China, Ministry of Industry and Information Technology of China, National Development and Reform Commission of China. 2017. Notice on furthering new energy vehicles pilot promotion. Available online: Available online: accessed on 20 May 2017). (in Chinese)

[29]
Ministry of Finance of China, Ministry of Science and Technology of China, Ministry of Industry and Information Technology of China, National Development and Reform Commission of China. 2017. Notice on adjusting the application of financial subsidy policy for new energy vehicles. Available online: Available online: in Chinese)

[30]
National Bureau of statistics of the People’s Republic of China. (1997-2016). China Statistical Yearbook. China Statistics Press: Beijing, China, 1997-2016. (in Chinese)

[31]
National Development and Reform Commission of China. Notice of printing and distributing the “Medium and Long Term Railway Network Planning” Available online: in Chinese)

[32]
OECD. 2017. OECD core set of indicators for environmental performance reviews: A synthesis report by the group on the state of the environment. Available online:

[33]
OECD, UNEP.2017. Climate change and tourism policy in OECD countries. Available online: accessed on 20 May 2017

[34]
Shi P H, Feng L, Wu P.2010. The energy consumption and carbon emission status of China’s tourism. In energy saving and emission reduction and low-carbon development in tourism industry:Policy system and practice guide.China Tourism Press:Beijing , China. (in Chinese)

[35]
Shi P H, Wu P.2011. A rough estimation of energy consumption and CO2 emissions in tourism sector of China.Acta Geographica Sinica, 66(2): 235-243. (in Chinese)

[36]
Smith I J, Rodger CJ.2009. Carbon emission offsets for aviation-generated emissions due to international travel to and from New Zealand.Energy Policy, 37(9): 3438-3447.

[37]
Tang B J, Ma Y, Wei Y M, et al.2016. Analysis of energy conservation and emission reduction of new energy vehicles in Beijing during the “13th Five-Year Plan”.Journal of Beijing Institute of Technology(Social Sciences Edition), 18(2): 13-17. (in Chinese)

[38]
Tang M F, Cao H M, Shen Y, et al.2014. Visitors’ cognition and willingness to low-carbon tourism--Taking Lijiang City as an example.Journal of Ecology, 34(17): 5096-5102. (in Chinese)

[39]
The State Council of the People’s Republic of China. 2017a. Energy conservation and new energy automotive industry development plan (2012-2020). Available online: Available online: accessed on 20 May 2017). (in Chinese)

[40]
The State Council of the People’s Republic of China. 2017b. Opinions on accelerating the development of tourism. Available online: Available online: accessed on 20 May 2017).(in Chinese)

[41]
The State Council of the People’s Republic of China. The 12th Five-Year Plan for the national economic and social development of the People’s Republic of ChinaAvailable online: accessed on 20 May 2017).(in Chinese)

[42]
Tongheng Urban Data Lab. 2017. 2017 white paper of share bicycle and urban development.Available online: in Chinese)

[43]
UNWTO. 2009.Towards a low carbon travel & tourism sector. World Economic Forum, 2009.

[44]
UNWTO. 2017..Climate change and tourism: responding to global challenges. Available online: accessed on 20 May 2017)

[45]
WTM. 2007.Why the Ministers’ Summit 2007 is crucial to the industry. The UNWTO Ministers Summit on tourism and climate change, 2007.

[46]
Yuan Y J.2013. Tourism in China: Indirect energy consumption and carbon emissions.Tourism Tribune, 28(10): 81-88. (in Chinese)

[47]
Zhang C L.2016. Analysis on calculation and characters of total carbon dioxide emission.Journal of Jiangsu Normal University (Philosophy and Social Sciences), 42(5): 98-104. (in Chinese)

[48]
Zhang G X, Zhang Z H, Guan X.2017. Is the synergy between measures and objectives of energy conservation and emission reduction policies in China effective? Research on 1052 energy conservation and emission reduction policies.Journal of Management Sciences in China, 20(3): 162-182. (in Chinese)

[49]
Zhang L L, Hang J L, Cao H.2016. Analysis on the cognition, willingness and behavior of low-carbon tourism of tourists-A case study of Gulan-

1)gyu, Xiamen.Environmental Science, 42(3): 58-64. (in Chinese)

[50]
Zhong Y D, Shi S Y, Li S H, et al.2014. Empirical research on construction of measurement framework for tourism carbon emission in China.China Population, Resources and Environment, 24(1): 78-86. (in Chinese)

[51]
Zhou X J.2015. China’s needs to develop high-speed railways - concurrently on energy saving and emission reduction effects of high-speed railways.China Economic Report, 7: 66-69. (in Chinese)

Outlines

/