Orginal Article

Analysis of Spatio-temporal Land Surface Temperature and Normalized Difference Vegetation Index Changes in the Andassa Watershed, Blue Nile Basin, Ethiopia

  • Melkamu Meseret Alemu , 1, 2
Expand
  • 1. School of Earth Sciences, Bahir Dar University, P.o. Box 79, Ethiopia
  • 2. Geospatial Data and Technology Center (GDTC), Bahir Dar University, P.o. Box 79, Ethiopia;
*Corresponding author: Melkamu Meseret Alemu, E-mail:

Received date: 2018-06-22

  Accepted date: 2018-09-10

  Online published: 2019-01-28

Copyright

All rights reserved

Abstract

Analysis of the nexus between vegetation dynamics and climatic parameters like surface temperature is essential in environmental and ecological studies and for monitoring of the natural resources. This study explored the spatio-temporal distribution of land surface temperature (LST) and Normalized Difference Vegetation Index (NDVI) and the relationship between them in the Andassa watershed from 1986 to 2016 periods using Landsat data. Monthly average air temperature data of three meteorological sites were used for validating the results. The findings of the study showed that the LST of the Andassa watershed has increased during the study periods. Overall, average LST has been rising with an increasing rate of 0.081°C per year. Other results of this study also showed that there has been a dynamic change in vegetation cover of the watershed in all seasons. There was also a negative correlation between LST and NDVI in all the studied years. From this study we can understand that there has been degradation of vegetation and intensification of LST from 1986 to 2016.

Cite this article

Melkamu Meseret Alemu . Analysis of Spatio-temporal Land Surface Temperature and Normalized Difference Vegetation Index Changes in the Andassa Watershed, Blue Nile Basin, Ethiopia[J]. Journal of Resources and Ecology, 2019 , 10(1) : 77 -85 . DOI: 10.5814/j.issn.1674-764X.2019.01.010

1 Introduction

The world is currently experiencing different environmental changes which are caused by both nature-induced and anthropogenic activities. Ethiopia, like other parts of the world, is highly vulnerable to the impacts of these environmental changes (Gedif et al., 2016). The country faces various problems in managing natural resources (Tilahun, 2015). From these, long term degradation of vegetation is one of the major environmental challenges in various parts of the country. Serious vegetation degradation is highly influenced by human activities such as conversion of vegetated and wetland into agricultural, as well as residential and commercial areas (Chen et al., 2008; Pal and C. Akoma, 2009; Kinthada et al., 2014; Waseem et al., 2015).
Vegetation cover change contributes to the earth-atmosphere interaction (Jesus and Santana, 2017) through not only plant transpiration (Jiang et al., 2006) but also photosynthesis, and it is the main factor that causes surface temperature changes on all spatial and temporal scales (Fathian et al., 2015). Land surface temperature (LST), considered as the skin temperature of the land (Jeevalakshmi, 2017; Khandelwal et al., 2017), is a significant parameter in exploring surface-atmosphere interactions and energy fluxes between the atmosphere and the ground (Bonafoni et al., 2017; Khandelwal et al., 2017; Orhan et al., 2014; Rozenstein et al., 2014; Srivastava et al., 2009; Tomlinson et al., 2011).
LST is calculated from emitted radiation measured by either ground or satellite based instruments. Generally, remote sensing techniques require less time and cheaper cost than field methods to investigate numerous phenomena on the land surface. Because of the repetitive nature and increasing spatial resolution, satellite imagery is becoming more and more a viable and preferred alternative to ground based measurements of land surface characteristics. Thermal infrared (TIR) remote sensing provides a method for finding LST information at the regional and global scales since most of the energy detected by the sensor in this spectral region is directly emitted by the surface (Sobrino, 2008). In addition to providing measurements of radiant surface temperature, remote sensing instruments collect measurements of reflecting energy in the red and near-infrared portions of the electromagnetic spectrum that can be used to quantify the extent and changing conditions of vegetation (Gorgani et al., 2013).
There are numerous vegetation indices developed to estimate vegetation cover with remotely sensed imagery. The most common spectral index used to evaluate vegetation cover is the Normalized Difference Vegetation Index (NDVI) (Chen et al., 2008; Karnieli et al., 2009; Valor and Caselles, 1996). NDVI is a good indicator for identifying long-term changes in the vegetation covers and their status (Chander et al., 2009; Fu and Burgher, 2015; Orhan and Yakar, 2016). It provides information about the spatial and temporal distribution of vegetation, vegetation biomass, extent of land degradation in various ecosystems (Chen et al., 2008) and ecological effects of climate disasters (Pettorelli et al., 2005).
Analysis of spatial variability of NDVI, surface temperature and the relationship between these parameters is essential in environmental and ecological studies (Zareie et al., 2016) as well as for spatial decision making and for monitoring of the natural resources. Moreover, the analysis of NDVI and LST of different times can be used to detect land use changes, which were formed because of forest fires, deforestation, urban expansion, mining activities and grass land regeneration (Mimbrero et al., 2014). The study area, Andassa watershed, is known to be the productive area in the country and the head stream of the Blue Nile River. Though it has both national and international significance, recent events have shown that the region is under pressure and is experiencing serious environmental changes (Gashaw et al., 2018). There is an enormous decrease in the natural vegetation of the watershed (Gashaw et al., 2017). Despite these events, only few studies have been carried out in the watershed to investigate the nexus between climatic parameters like surface temperature and vegetation dynamics.
Therefore, the main objective of this study is to analyze the relationships between multi-temporal land surface temperature and Normalized Difference Vegetation Index changes of Andassa watershed, Blue Nile Basin in Ethiopia using remotely sensed data. The specific objectives of this study are:-
· To estimate the land surface temperature of the study area from Landsat imagery.
· To examine relationship between LST and NDVI in the study area.
· To determine the amount of mean temperature increased from the selected time frame (1986 to 2016) in the study area.

2 Materials and methods

2.1 Study area

Andassa watershed is a part of the Blue Nile Basin of Ethiopia (Fig. 1). The watershed occupies an area of 60 968 ha. It is situated in a close proximity to Bahir Dar (the capital city of the Amhara Regional State). Geographically, the watershed extends between 11°09°N-11°32°N and 37°15°E- 37°30°E. The topography is hilly and elevation ranges from 1688-3197 m above sea level. Andassa River, one of the tributaries of the Blue Nile River, is the major river of the studied watershed. Agriculture is the main source of livelihood for the population.
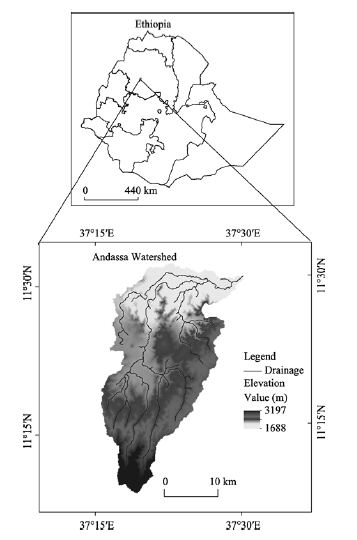
Fig. 1 Location map of the study area

2.2 Data sources

Landsat data (Landsat-5 TM 1986, Landsat-5 TM 2000 and Landsat-8 OLI-TIRS 2016) have been obtained free of charge from US Geological Survey (USGS) (http://earthexplorer.usgs.gov/). Details of image characteristics are presented in Table 1. A 30 m resolution ASTER GDEM, obtained from ASTER Global Digital Elevation Map (http://gdex.cr.usgs.gov/gdex/) was used in this study.
Table 1 Characteristics of satellite imagery used in this study
Satellite image Path/row Sensor Resolution
(m)
No. of
bands
Date of
acquisition
Landsat-5 170/52 TM 30 7 04-02-1986
Landsat-5 170/52 TM 30 7 11-02-2000
Landsat-8 170/52 OLI-TIRS 30 11 07-02-2016

2.3 Methods

For the present study, the methodology involves preparation of NDVI and Land surface temperature maps and correlation analysis between LST and NDVI. The general workflow is shown in Fig. 2 and the details are presented in the next sections.
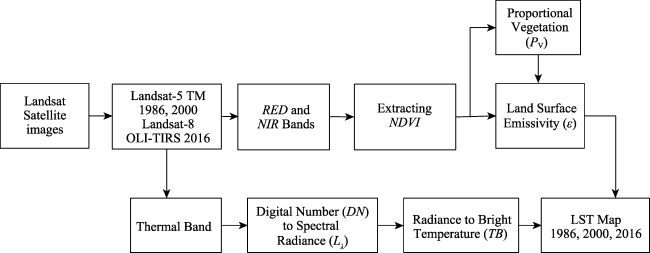
Fig. 2 General workflow of the methodology
2.3.1 Normalized Difference Vegetation Index (NDVI)
The Normalized Difference Vegetation Index (NDVI) is essential to estimate the amount of the aboveground green vegetation cover. It is calculated from measurements of red and near-infrared reflectance using the formula
$NDVI=\frac{NIR-RED}{NIR+RED}$ (1)
where $NIR$ and $RED~$ are the near infrared and red band pixel values respectively. The value of NDVI ranges between -1.0 and 1.0. The value of NDVI for continuous vegetation cover mostly lies between 0.2 and 0.9 (Bustos and Meza, 2015). Values less than 0.1 indicate no vegetation such as rock, water, ice, snow and barren surfaces (Fu and Burgher, 2015).
2.3.2 Land surface emissivity
The land surface emissivity ($\varepsilon $) is the ratio of energy emitted from a natural material to that of a perfect emitter (blackbody) at the same temperature (Jiménez-muñoz et al., 2006). The emissivity for a surface can be obtained using a theoretical approach, which models a given surface by considering it as being made up of bare soil and vegetation based on the following simplified equation (Sobrino et al., 2004):
${{\varepsilon }_{\lambda }}={{\varepsilon }_{v\lambda }}+{{P}_{v}}+{{\varepsilon }_{s\lambda }}\left( 1-{{P}_{v~}} \right)+{{C}_{\lambda }} (2)$
where ${{\varepsilon }_{v}}$ and ${{\varepsilon }_{s}}$ are band emissivity values for vegetation and bare soil, respectively, C is the surface roughness taken as a constant value of 0.005 (Avdan and Jovanovska, 2016; Sobrino and Raissouni, 2000) and Pv is proportional vegetation that shows the amount and nature of vegetation cover(Weng et al., 2004) and is derived from NDVI using the formula
${{P}_{v~}}={{\left[ \frac{NDVI-NDV{{I}_{s}}}{NDV{{I}_{v}}-NDV{{I}_{s}}} \right]}^{2}} (3)$
where NDVIv and $NDV{{I}_{s}}$ are the NDVI values of full vegetation cover and bare soil and their values are suggested to be 0.5 and 0.2 respectively (Sobrino et al., 2004).
2.3.3 Conversion of Digital Number (DN) to spectral radiance (${{L}_{\lambda }}$)
Digital Number (DN) of a pixel in an image is a numerical value which represents the brightness of that pixel in the image. In this step, each pixel of the Landsat images was converted from Digital Numbers ($DN)$ to Spectral radiance (Lλ) using the following formula (Fathian et al., 2015; Wang et al., 2015)
${{L}_{\lambda ~}}=\left( \frac{{{L}_{max}}-{{L}_{min}}}{{{Q}_{calmax}}-{{Q}_{calmin}}} \right)\left( {{Q}_{cal}}-{{Q}_{calmin}} \right)+{{L}_{min}} (4)$
where Qcal is the quantized calibrated pixel value in DN, Lmin is the spectral radiance that is scaled to Qcalmin, Lmax is the spectral radiance scaled to Qcalmax, Qcalmin is the minimum quantized calibrated pixel value in DN and Qcalmax is the maximum quantized calibrated pixel value in DN. The values are presented in Table 2.
Table 2 Values of parameters of Landsat images from metadata
Variable Description Value
(Landsat-5 TM) (Landsat-8 OLI-TIRS)
K1 Thermal constant 607.76 774.8853
K2 Thermal constant 1260.56 1321.0789
Lmin Minimum value of Radiance 1.238 0.10033
Lmax Maximum value of Radiance 15.303 22.00180
Qcalmin Minimum Quantize Calibration 1 1
Qcalmax Maximum Quantize Calibration 255 65535
2.3.4 Conversion of spectral radiance to an effective brightness temperature
Thermal radiance values were converted from spectral radiance to brightness temperature using the thermal constants with the following equation (Sobrino et al., 2004):
${{T}_{B}}=\frac{{{K}_{2}}}{\text{ln}\left( \frac{{{K}_{1}}}{{{L}_{\lambda }}}+1 \right)} (5)$
where TB is satellite brightness temperature (Kelvin), Lλ is Top of Atmosphere spectral radiance, K1 and K2 are calibration constants obtained from the metadata.
2.3.5 Land surface temperature from brightness temperature
The emissivity corrected land surface temperature (LST) in degree Celsius is computed using the formula(Avdan and Jovanovska, 2016; Ding and Elmore, 2015)
$LST=\frac{{{T}_{B}}}{\left[ 1+\left\{ \left( \frac{\lambda {{T}_{B}}}{\rho } \right)\times \text{ln}\varepsilon \right\} \right]}-273.15 (6)$
where LST is the land surface temperature in degree Celsius, λ is the wavelength of emitted radiance in meters, ρ = hCσ -1, σ = 1.38×10⁻²³ JK-1 (Boltzmanconstant), h = 6.626×10⁻³⁴ Js (Planck’s constant), C=2.998×10⁸ ms-1 (Speed of light) and ε is emissivity.
2.3.6 Validation of the results
This step is aimed to validate the results of LST obtained from Landsat data following the methodology. Due to the lack of measured LST data, three meteorological site temperature data were used to validate the results. Monthly average air temperature data of three meteorological sites in the vicinity of the study area (Adet, Bahir Dar and Merawi) in the month of February (the same month of image acquisition) of the years 1986, 2000 and 2016 were used for verifying the results.

3 Results and discussion

3.1 Analysis of NDVI

The spatial distribution of NDVI values from the Landsat TM and Landsat OLI images can be seen in Fig. 3 a-c. The 1986 NDVI values ranged from -0.32 to 0.66, having a mean value of 0.20, and the 2000 NDVI values were in the range of -0.35 to 0.62, having a mean value of 0.12 whereas the NDVI values of the year 2016 ranged from -0.16 to 0.54 with a mean value of 0.12. Relatively, high values of NDVI were observed on the southwestern and northeastern parts of the study area following the drainage areas and low values of NDVI were observed on the southeastern part of the study area. By comparing NDVI of three different periods (1986, 2000 and 2016), it is observed that maximum NDVI values decreased over the studied period of time. Table 3 shows different NDVI classes for the years 1986, 2000 and 2016. The comparison of each class of the different years showed that there has been a marked vegetation cover change during the study period of 30 years. As can be seen from Table 3, 43.47% of the study area in 1986 and 43.84% of the study area in 2000 were covered by NDVI values between 0 and 0.1. But in the year 2016, only 5.4% of the study area was covered by the same NDVI class. These confirmed that there has been a dynamic vegetation cover change from one class to the other in the study area.
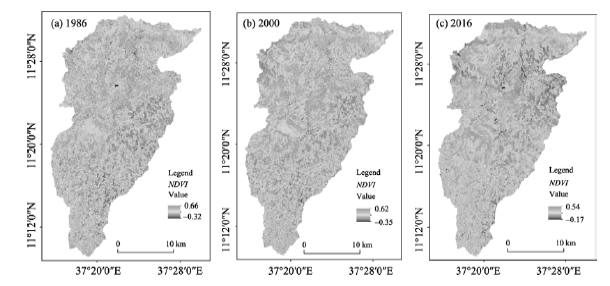
Fig. 3 NDVI maps of the Andassa watershed for three different years^Note: (a) NDVI map in 1986, (b) NDVI map in 2000 and (c) NDVI map in 2016.
Table 3 The NDVI distributions in different classes of years 1986, 2000 and 2016
NDVI 1986 2000 2016
Area (ha) Percent (%) Area (ha) Percent (%) Area (ha) Percent (%)
<0 120.33 0.20 72.72 0.12 13.86 0.02
0-0.1 26505.09 43.47 26728.11 43.84 3292.65 5.40
0.1-0.2 26319.42 43.17 24039.99 39.43 40717.98 66.79
0.2-0.3 6464.16 10.61 7447.95 12.22 14968.26 24.55
0.3-0.4 1367.91 2.24 2197.08 3.60 1838.52 3.02
>0.4 190.98 0.31 482.04 0.79 136.62 0.22

3.2 Analysis of LST

Fig. 4 a-c show spatial pattern of LST for the years 1986, 2000 and 2016 of the study area respectively. The summary statistics of LST for the indicated years is presented in Table 4. In the year 1986, LST ranged from 13.78°C to 39.16°C with mean 30.58°C. From the total area, 25% area represented temperature from 13.78°C to 28.77°C and the remaining 75% area represented temperature between 28.77°C and 39.16°C. In the year 2000, LST varied from 14.25°C to 39.16°C having mean value of 30.77°C and 25% of the study area possessed temperature between 14.25°C and 29.18°C. The remaining 75% of the area possessed temperature between 29.18°C and 39.16°C. Slight increment was observed in both the minimum and the mean LST values as compared to the year 1986. LST in 2016 ranged from 17.39°C to 40.64°C with mean 32.88°C and more than 75% of spatial extent possessed temperature between 31.20°C and 40.64°C.
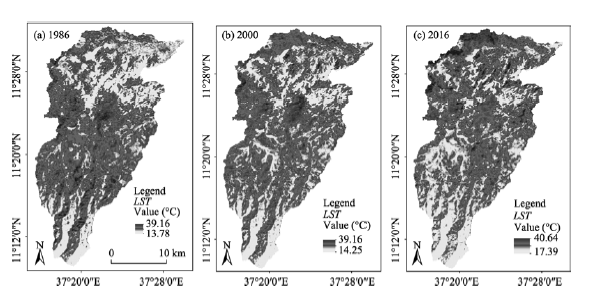
Fig. 4 LST maps of the Andassa watershed for three different years: (a) 1986, (b) 2000 and (c) 2016
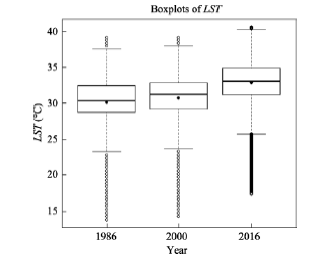
Table 4 Summary statistics of LST of the study area for different years.
Year Min Q1 Mean Q2 Q3 Max Sd
1986 13.78 28.77 30.58 30.42 32.46 39.16 3.06
2000 14.25 29.18 30.77 31.24 32.86 39.16 2.79
2016 17.39 31.20 32.88 33.08 34.88 40.64 2.86
F test was used as the significance examination of variability of LST for pairwise comparison of the years 1986, 2000 and 2016 in the study area. Each pair passed the significance test at the level P < 0.01. Boxplots in Fig. 5 show the variability of LST in the study area for the years 1986, 2000 and 2016. The highest variability in LST was observed in the year 1986 with standard deviation 3.06 followed by year 2016 with standard deviation 2.86. As depicted in the boxplots, average LST increased with positive rates. It showed that within 30 years (from 1986-2016) of the study period, minimum temperature level has raised 3.61°C with an average of 0.12°C per year and average temperature has raised 2.42°C with an increasing rate of 0.081°C yr-1 in the specified period.
Fig. 5 Boxplots of LST for the years 1986, 2000 and 2016
Fig. 6 shows the distribution of the percentage change in LST between the years 1986 and 2016. Maximum percentage change (61.5%) of LST was observed on the northern part of the study area.
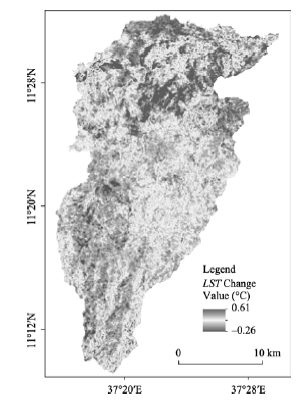
Fig. 6 Map showing percentage change in LST between the years 1986 and 2016

3.3 Analysis of relationship between NDVI, LST and elevation

In order to reduce the potential effect of autocorrelation in the LST and NDVI data, a random sample of 10% pixels was extracted in the study area (n = 67742) (Vlassova et al. 2014) and correlations coefficients between LST, NDVI and elevation were computed for the years 1986, 2000 and 2016. The results are presented in Table 5. From the table it is clear that negative correlation values were observed between LST and NDVI in all the three years. Other studies have also shown similar results (Pal and Ziaul, 2017; Sruthi and Aslam, 2015; Weng et al., 2004; Zhibin et al., 2015). This means that areas with lower vegetation cover are experiencing higher land surface temperature and vice versa. From this it can be inferred that vegetation has a cooling and regulating effect on the surface temperature of an area. Studies showed that vegetated surface can contribute significantly to human comfort and better health conditions by decreasing the land surface temperature even by 13℃ (Gémes et al., 2016).
Table 5 Correlation between LST, NDVI and elevation
Year LST and NDVI LST and Elevation NDVI and Elevation
1986 -0.43 -0.07 -0.11
2000 -0.50 -0.28 -0.03
2016 -0.46 -0.40 -0.06
On the other hand, the correlation between NDVI and elevation in the study area was very weak. Almost no correlation was observed between these two parameters for all the three years. Moreover, in the year 1986, there was no correlation between LST and elevation but moderately negative correlation was observed between these parameters in the years 2000 and 2016 with correlation coefficient values -0.28 and -0.40 respectively.

3.4 Correlation of LST and air temperature

Statistical analysis showed that there was strong correlation between LST and air temperature with correlation coefficient R = 0.95, thereby indicating that the LST and air temperature were following a similar pattern.

4 Conclusions

Nowadays, satellite data are becoming important for various applications in different fields including in environmental and ecological studies. This study has demonstrated that the recent advancements in remote sensing and GIS technologies provide powerful tools for mapping and detecting changes in LST and NDVI. The study used Landsat- data and explored the spatio-temporal distribution of LST, NDVI and the quantitative relationship between them. The findings of this study have shown that the LST of the Andassa watershed has increased during the study periods of 1986, 2000 and 2016. Overall, average LST has been rising with an increasing rate of 0.081°C yr-1. Comparison of the 1986 and 2016 LST maps has shown a maximum percentage change (up to 61.5%) of LST on the northern part of the study area. The results of this study have also shown that there has been declining vegetation cover (as indicated by NDVI) in all seasons. Correlation analysis has also shown that there has been negative correlation between NDVI and LST in all periods. From this study it can be inferred that degradation of vegetation, and intensification and steady increment of LST can disturb and harm the biosphere and ecosystem of the watershed. As a result, conservation activities and rehabilitation of cleared and degraded areas need to be done, especially on the northern part of the study area. Moreover, as Andassa watershed is the head stream of the Blue Nile River, recognizing its local and global importance, different scientific land management strategies and interventions need to be developed and effectively practiced in order to monitor the continuous land use land cover dynamics and to check the intensification of LST. The generated maps can thus be used as guides for various uses such as planning and management of vegetation dynamics in the Andassa watershed. More comprehensive and in-depth analyses of other influence factors, such as population growth, the effect of land use/land cover changes on LST, are required in the future.

The authors have declared that no competing interests exist.

[1]
Anyamba A, Small J L, Britch S C, et al.2014. Recent weather extremes and impacts on agricultural production and vector-borne disease outbreak patterns. PLoS ONE,9(3):23-23.

[2]
Avdan U, Jovanovska G.2016. Algorithm for automated mapping of land surface temperature using LANDSAT 8 satellite data.Journal of Sensors, 2016:1-8.

[3]
Bonafoni S, Anniballe R, Gioli B, et al.2017. Downscaling Landsat Land Surface Temperature over the urban area of Florence. European Journal of Remote Sensing, 49(2016):553-569.

[4]
Bustos E, Meza F J.2015. A method to estimate maximum and minimum air temperature using MODIS surface temperature and vegetation data: application to the Maipo Basin, Chile. Theoretical and Applied Climatology,120(1-2):211-211.

[5]
Chen C C, Xie G D, Zhen L, et al.2008. Analysis of Jinghe watershed vegetation dynamics and evaluation of its relation to precipitation.Acta Ecologica Sinica, 28(3): 0925-0938.

[6]
Chander G, Markham B L, Helder D L, et al.2009. Remote sensing of environment summary of current radiometric calibration coefficients for Landsat MSS, TM, ETM+, and EO-1 ALI sensors. Remote Sensing of Environment,113(5):893-893. 2009. 01.007.

[7]
Ding H, Elmore A J.2015. Remote sensing of environment spatio-temporal patterns in water surface temperature from Landsat time series data in the Chesapeake Bay, U. S. A. Remote Sensing of Environment, 168: 335-348. 2015.07.009.

[8]
Fathian F, Prasad A D, Dehghan Z, et al.2015. Influence of land use / land cover change on land surface temperature using RS and GIS techniques. International Journal of Hydrology Science and Technology,5(3):195-195. 2015.071348.

[9]
Fu B, Burgher I.2015. Riparian vegetation NDVI dynamics and its relationship with climate, surface water and groundwater.Journal of Arid Environments, 113: 59-68. 2014. 09.010.

[10]
Gashaw T, Tulu T, Argaw M, et al.2017. Evaluation and prediction of land use/land cover changes in the Andassa watershed, Blue Nile Basin, Ethiopia. Environmental Systems Research, 6(17): 1-14.

[11]
Gashaw T, Tulu T, Argaw M, et al.2018. Modeling the hydrological impacts of land use / land cover changes in the Andassa watershed, Blue Nile Basin , Ethiopia. Science of the Total Environment, 619: 1394-1408. 2017.11.191.

[12]
Gedif B, Wondmagegn W, Ayalew T, et al.2016. Analysis of the existing early warning systems : The case of Amhara national regional state.International Journal of Advanced Scientific Research, 1(9): 24-28.

[13]
Gémes O, Tobak Z, van Leeuwen B.2016. Satellite based analysis of surface urban heat island intensity. Journal of Environmental Geography, 9: 23-30.

[14]
Gillies R R, Carlson T N.1995. Thermal remote sensing of surface soil water content with partial vegetation cover for incorporation into climate models. Journal of Applied Meteorology,34: 745-756. CO;2.

[15]
Goetz S J.1997. M ulti-sensor analysis of NDVI , surface temperature and biophysical.International Journal of Remote Sensing, 18(1): 71-94.

[16]
Gorgani S A, Panahi M, Rezaie F.2013. The relationship between NDVI and LST in the urban area of Mashhad , Iran. International Conference on Civil Engineering Architecture & Urban Sustainable Development 27&28 November 2013, Tabriz, Iran,.

[17]
Jeevalakshmi D.2017. Land surface temperature retrieval from LANDSAT data using emissivity estimation.International Journal of Applied Engineering Research, 12(20): 9679-9687.

[18]
Jesus J B De, Santana I D M.2017. Estimation of land surface temperature in caatinga area using Landsat 8 data.Journal of Hyperspectral Remote Sensing, 7: 150-157.

[19]
Jiang Z, Huete A R, Chen J, et al.2006. Analysis of NDVI and scaled difference vegetation index retrievals of vegetation fraction. Remote Sensing of Environment,101(3):366-366. 2006.01.003.

[20]
Jiménez-muñoz J C, Sobrino J A, Gillespie A, et al. 2006. Improved land surface emissivities over agricultural areas using ASTER NDVI. Remote Sensing of Environment, 103: 474-487. 2006.04.012.

[21]
Karnieli A, Agam N, Pinker R T, et al.2009. Use of NDVI and land surface temperature for drought assessment: Merits and limitations. Journal of Climate, 23:618-633. 1.

[22]
Khandelwal S, Goyal R, Kaul N, et al.2017. Assessment of land surface temperature variation due to change in elevation of area surrounding Jaipur, India. The Egyptian Journal of Remote Sensing and Space Sciences,21(1):87-87. 2017.01.005.

[23]
Kinthada N.R., Gurram M.K., Eadara A., et al.2014. Land Use/Land Cover and NDVI Analysis for Monitoring the Health of Micro-Watersheds of Sarada River Basin, Visakhapatnam District, India.Geology & Geosciences, 3(2): 146-153. doi: 10.4172/2329-6755.1000146

[24]
Mimbrero M R, Vlassova L, F.2014. Analysis of the Relationship between Land Surface Temperature and Wildfire Severity in a Series of Landsat Images. Remote Sensing, 6: 6136-6162.

[25]
Moran M S, Clarke T R, Inoue Y, et al.1994. Estimating Crop Water Deficit Using the Relation between Surface-Air Temperature and Spectral Vegetation Index.Remote Sens.Environ., 49: 246-263.

[26]
Orhan O, Ekercin S, Dadaser-celik F.2014. Use of Landsat Land Surface Temperature and Vegetation Indices for Monitoring Drought in the Salt Lake Basin Area, Turkey. The Scientific World Journal, 2014: 1-11.

[27]
Orhan O, Yakar M.2016. Investigating land surface temperature changes using landsat data in Konya, Turkey, The International Archives of the Photogrammetry, Remote Sensing and Spatial Information Sciences XLI-B8, 285-289.

[28]
Pal S, C. Akoma O.2009. Water Scarcity in Wetland Area within Kandi Block of West Bengal: A Hydro-Ecological Assessment.Ethiopian Journal of Environmental Studies and Management, 2(3): 1-12.

[29]
Pal S, Ziaul S.2017. Detection of land use and land cover change and land surface temperature in English Bazar urban centre q. The Egyptian Journal of Remote Sensing and Space Sciences,20(1):125-125. 2016.11.003.

[30]
Pettorelli N, Vik J O, Mysterud A, et al.2005. Using the satellite-derived NDVI to assess ecological responses to environmental change. Trends in Ecology and Evolution,20(9):503-503.

[31]
Rozenstein O, Qin Z, Derimian Y, et al.2014. Derivation of Land Surface Temperature for Landsat-8 TIRS Using a Split Window Algorithm. Sensors,14:5768-5780.

[32]
Sobrino J.2008. Split-Window Coefficients for Land Surface Temperature Retrieval From Low-Resolution Thermal Infrared Sensors. IEEE Geoscience and Remote Sensing Letters,5(4):806-806. 2008.2001636.

[33]
Sobrino J A,Jiménez-Muñoz J C, Paolini L. 2004. Land surface temperature retrieval from LANDSAT TM 5. Remote Sensing of Environment,90(4):434-434. 2004.02.003.

[34]
Sobrino J A, Raissouni N.2000. Toward remote sensing methods for land cover dynamic monitoring: Application to Morocco. International Journal of Remote Sensing,21(2):353-353.

[35]
Srivastava P K, Majumdar T J,& Bhattacharya A K. 2009. Surface temperature estimation in Singhbhum Shear Zone of India using Landsat- 7 ETM + thermal infrared data. Advances in Space Research,43(10):1563-1563.

[36]
Sruthi S,Aslam M A M.2015.Agricultural Drought Analysis Using the NDVI and Land Surface Temperature Data: a Case Study of Raichur District. Aquatic Procedia, 4:1258-1264. 2015.02.164.

[37]
Stisen S, Sandholt I, Nørgaard A, et al.2008. Combining the triangle method with thermal inertia to estimate regional evapotranspiration — Applied to MSG-SEVIRI data in the Senegal River basin. Remote Sensing of Environment, 112: 1242-1255. https:// doi.org/10.1016/j.rse.2007.08.013.

[38]
Tang R, Li Z, Tang B. 2010. Remote Sensing of Environment An application of the T s - VI triangle method with enhanced edges determination for evapotranspiration estimation from MODIS data in arid and semi-arid regions: Implementation and validation . Remote Sensing of Environment,114(3):540-540. 2009.10.012.

[39]
Tilahun A.2015. Application of GIS for Estimation of Brightness Temperature using Landsat Data in Kilite Awulalo, Tigray Ethiopia.Advances in Physics Theories and Applications, 40: 16-24.

[40]
Tomlinson C J, Chapman L, Thornes J E, et al.2011. Remote sensing land surface temperature for meteorology and climatology: A review. Meteorological Applications,18(3):296-296. 287.

[41]
Valor E, Caselles V.1996. Mapping Land Surface Emissivity from NDVI : Application to European, African, and South American Areas.Remote Sens. Environ, 184: 167-184.

[42]
Vlassova L, Perez-Cabello F, Rodrigues M, et al.2014. Analysis of the Relationship between Land Surface Temperature and Wildfire Severity in a Series of Landsat Images.Remote Sensing, 6: 6136-62.

[43]
Wang F, Qin Z, Song C, et al.2015. An Improved Mono-Window Algorithm for Land Surface Temperature Retrieval from Landsat 8 Thermal Infrared Sensor Data. Remote Sensing,7(4):4268-4268. https:// doi.org/10.3390/rs70404268.

[44]
Waseem M, Halmy A, Gessler P E, et al. 2015. Land use / land cover change detection and prediction in the north-western coastal desert of Egypt using Markov-CA .Applied Geography, 63: 101-112. 2015.06.015.

[45]
Weng Q, Lu D, Schubring J.2004. Estimation of land surface temperature-vegetation abundance relationship for urban heat island studies . Remote Sensing of Environment,89(4):467-483.2003.11.005.

[46]
Zareie S, Khosravi H, Nasiri A, et al.2016. Using Landsat Thematic Mapper (TM) sensor to detect change in land surface temperature in relation to land use change in Yazd, Iran. Solid Earth, 7: 1551-1564.

[47]
Zhibin R, Haifeng Z, Xingyuan H, et al.2015. Estimation of the Relationship Between Urban Vegetation Configuration and Land Surface Temperature with Remote Sensing. Journal of the Indian Society of Remote Sensing, 43(1): 89-100. https://doi.org/10.1007/s12524-014-0373-9.

Outlines

/