Orginal Article

Net Horizontal Payments for Ecosystem Services: An Application in the Beijing-Tianjin-Hebei Region of China

  • LIN Yongsheng 1 ,
  • GUO Zhixin 2 ,
  • ZHENG Yaomin , 3, * ,
  • ZHANG Lirong , 4 ,
  • HUANG Huabing 3
Expand
  • 1. China Market Economy Research Center, Beijing Normal University, Beijing 100875, China
  • 2. School of Economics and Resource Management, Beijing Normal University, Beijing 100875, China
  • 3. Institute of Remote Sensing and Digital Earth, Chinese Academy of Sciences, Beijing 100101, China
  • 4. Chinese Academy for Environment Planning, Ministry of Ecology and Environment of the People’s Republic of China, Beijing 100012, China;
*Corresponding author: ZHENG Yaomin, E-mail:

Received date: 2018-09-17

  Accepted date: 2018-11-08

  Online published: 2019-01-28

Supported by

Strategic Priority Research Program of the Chinese Academy of Sciences (XDA19030104)

National Key Research and Development Programme of China (2017 YFA0603004).

Copyright

All rights reserved

Abstract

Payments for ecosystem services (PES) are one kind of important tool for environmental protection, and have been widely studied by international scholars and conservationists. Based various definitions of PES from recent articles, we have outlined four principles for PES: parity, measurability, additionality and conditionality, and then have used these principles to develop a formula to calculate a standard for PES. Finding a way to use PES to achieve a win-win relationship between economic growth and environmental protection in the Beijing-Tianjin-Hebei Region (BTHR) is a key task for Chinese government. Synergetic development of BTHR has become a national strategy, like The Belt and Road Initiative. This article employed the formula we developed to calculate the net horizontal PES amounts that each provincial government within BTHR should pay. Our findings show that Beijing should have paid 10.44×10⁹ Yuan (0.4% of Beijing’s GRP) and Tianjin 16.56×10⁹ Yuan (0.93% of Tianjin’s GRP) to Hebei in 2016.

Cite this article

LIN Yongsheng , GUO Zhixin , ZHENG Yaomin , ZHANG Lirong , HUANG Huabing . Net Horizontal Payments for Ecosystem Services: An Application in the Beijing-Tianjin-Hebei Region of China[J]. Journal of Resources and Ecology, 2019 , 10(1) : 63 -68 . DOI: 10.5814/j.issn.1674-764X.2019.01.008

1 Introduction

One of the most important tasks that economists face in making ecological or environmental policies is to evaluate the economic value of ecosystem services and implement payments for ecosystem services (also referred to as payments for environmental services, PES). There are different understandings of PES; they can be looked at in a broad sense or a narrow sense. PES in the narrow sense includes rewards for protecting ecosystems and natural resources, and the payment of compensation for destroying ecosystems and natural resources. PES in the broad sense also includes charges for polluters. In China, PES is usually used the narrow sense. Because there are already some formal charges for polluters in China. For example, Pollution discharge fees were put in place in the 1980s, and these were replaced by an environmental contamination tax in 2018. Given that domestic market for environmental goods is incomplete, many actors lack an incentive to protect ecosystems. Under such circumstances, PES acts as an important institutional arrangement for the construction of ecological civilization and can be very helpful in protecting the natural environment. Guidance for Perfecting Mechanisms of Payments for Ecosystem Protection, published by the State Council of People’s Republic of China (PRC) in 2016, pointed out that PES will be able to cover all important ecosystem types, such as forest, grassland, wetland, desert, the sea, river and cropland, and cover all import areas such as Prohibited Development Regions (PDR) and Important Ecological Areas (IEA) by 2020 (Ouyang et al., 2016; Xu et al., 2017).
International scholars, especially scholars from developed countries, have examined PES as an incentive mechanism that encourages ecosystem service suppliers to provide services that have positive externalities or the characteristics of public goods, and as an application of Coase Theory in ecological economics and environmental economics (Coase, 1960). One of the most popular definitions of PES was originally developed by Wunder who thought that PES generally involved five factors: PES must be a kind of volunteer behavior; ecosystem services can be clearly classified; there must be at least one purchaser of ecosystem services; there must be at least one supplier of ecosystems services; and only when the supplier delivers the ecosystem services can he or she receive PES (Wunder, 2005). Wunder later modified the definition he proposed in 2005 and argued that PES was a kind of volunteer transaction between a user and a supplier of ecosystem services, and that a conditional payment was based on the ecosystem services generated by the natural resources management agreement between them (Wunder, 2015).
Who should pay and who should receive the PES? Engel et al. (2008) tried to answer these questions in detail. They considered that the suppliers of ecosystem services should receive the PES (seller of PES) and the users of ecosystem services or a third party representing the users should pay the PES (buyer of PES). Because the method of land use can affect the supply of ecosystem services, potential sellers are usually private land owners (Song, 2018). There are also some ecological projects connected to public lands like protected areas, and in such cases, the government, collective or community that owns the public land can be the seller of the PES (Zheng et al., 2012 and 2015, Niu et al., 2011 and 2012). Of course, to a certain degree, everyone is a user of ecosystem services, though each person does not enjoy equal benefits from these services. The benefit level depends on the specific type of service and the distance from an individual’s residence to the ecosystem. This makes it difficult to identify individual households or firms as sole buyers of PES. In practice, the buyer of most PES projects in developed and developing countries is a third party, often the local government (Schomers and Matzdorf, 2013).
The most difficult part of PES, both in theory and in practice, is to assess the economic value of the ecosystem services and then to establish a standard for the PES. If the standard is too high, the buyer of PES will have trouble affording the high cost, and this is likely to be a huge burden on local governments. If the standard is too low, the seller of the PES may not have sufficient incentive to protect the ecosystem and the environment. An extensive literature is focused on this issue and there is a consensus that the standard for PES should lie between the opportunity cost (lower limit) of protecting the ecosystem and the ecosystem services value (ESV) (upper limit). During implementation, many PES projects set up standards in line with the opportunity cost; the Grain for Green Project (GGP) and the Grassland Ecological Protection Project (GEP) are two examples of this in China (Li and Liu, 2010; Lin et al., 2017). The Cropland Retirement Project (CRP) and the Environment Quality Incentive Project (EQIP) of America (Claassen, et al., 2008) are two projects in Costa Rica and Mexico (Kalacska, et al., 2008).
However, there is still no a consistent, widely accepted formula to calculate amount of PES. This paper will show that a formula for PES can be constructed based on four principles: parity, measurability, additionality and conditionality. The next section presents basic principles and a model for PES. Then, we examine a detailed case and application with an empirical analysis of the Beijing-Tianjin- Hebei region of China. The final section discusses the model results and presents our conclusions.

2 Principles and model

An ideal institutional arrangement for PES should recognize four principles. The first principle is parity. This means that the government or administrative entities involved in the PES must be at the same level; that is, province/state-to- province/state or city to city. If there is not parity between parties to a PES and one party is more powerful than the other, the amount of the PES may be over or underestimated, and enforcement of the PED may be affected as well.
The second principle is measurability. This refers to the need for the the economic value of ecological service to be measured as precisely as possible. This is the basis of PES. Many scholars including Costanza et al. (1997 and 2017) have made important contributions in this area.
The third principle is additionality. In a PES arrangement, one local government will pay the PES to another local government, and the first local government must receive corresponding additional ecological services. This is much like ordinary consumer behavior, with a consumer paying money and getting goods from shops in return. This principle implies that all the subjects in a PES should be adjacent to each other, meaning that the ecological service quality in one region will have spillover effect on the other.
The final principle is conditionality. Whether two local governments can establish a PES must depend on certain conditions being met. One of these is that a local government really must take positive measures to protect the ecology and environment, rather than simply relying on the fact that it possesses a good natural ecological environment. In regard to this, the exact amount of the PES should not be established solely on the basis of the economic value of the ecological service offered by certain local regions for a certain periods of time. The extent to which a local government takes positive action to protect its ecological environment must also be taken into account.
After establishing the four principles, we construct a theoretical model of PES to capture these principles. With respect to the parity principle, suppose there are N provinces within a country. In fact this implies that we assume the government level for PES is the provincial level. With respect to the additionality principle, suppose that there are Mi neighboring provinces for the province i, and that province i and the Mi neighbors, can all partake equally of the positive or negative spillover effects (also called externalities in economics) from the ecosystem service quality of province i. That is, each neighboring province of province i can enjoy \(\left( \frac{1}{1+{{M}_{i}}} \right)\) of province i’s ecosystem services. With respect to the measurability principle, we use the ecological service value (ESVi) to denote the economic value of ecosystem service in province i. With respect to the conditionality principle, we use βi to denote the extent to which province i positively takes measures to protect its ecological system and environment.
Based on these hypotheses, the model for a PES between region i and region j can be expressed:
\(PE{{S}_{Ri-Rj}}=\frac{1}{1+{{M}_{i}}}\times ES{{V}_{i}}\times {{\beta }_{i}},\)i, j, M=1, 2, 3…N, 0<βi<1 (1)
Where βi=0 means that region i does nothing to protect its ecosystem and natural environment, and βi=1 means that region i tries its best to protect and improve its ecosystem services.
To calculate the ESVi, we divide the ecosystem of region i into six categories based on the land use types of the region (ESik, k=1, 2, 3, 4, 5, 6, refers to the area of type k ecosystem in region i), including cropland (ESi1), forest (ESi2), grassland (ESi3), shrubland (ESi4), wetland (ESi5), and water (ESi6). For the ecosystem service offered by each category, suppose the corresponding economic value in per unit area is P1, P2, P3, P4, P5, and P6. The ESVi can then be expressed as:
\[ES{{V}_{i}}=\sum\limits_{k=1}
{6}{E{{S}_{ik}}\times {{P}_{k}}}\ (2)\]
Given (1) and (2), we can get an expression for the net payment of ecological services (NPES) between region i and region j, which will be as follows:
\[\begin{align} & NPE{{S}_{Ri-Rj}}=\left| PE{{S}_{Ri-Rj}}-PE{{S}_{Rj-Ri}} \right|= \\ & \left| \frac{1}{1+{{M}_{i}}}\times {{\beta }_{i}}\times \left( \sum\limits_{k=1}
{6}{E{{S}_{ik}}\times {{P}_{k}}} \right)-\frac{1}{1+{{M}_{j}}}\times {{\beta }_{j}}\times \left( \sum\limits_{k=1}
{6}{E{{S}_{jk}}\times {{P}_{k}}} \right) \right| \\ \end{align}\ (3)\]

3 Data and empirical analysis for Beijing-Tianjin-Hebei Region of China

The Beijing-Tianjin-Hebei region (BTHR) is the economic circle of China’s capital composed of Beijing, Tianjin and 11 cities in Hebei province. It lies in the Chinese heartland next to the Bohai Sea. With its large economy, the region has great promise and has attracted the attention of people worldwide. In 2016, gross regional product was 7.46×10¹² Yuan, representing 10 percent of China’s gross domestic product (GDP).
Compared to its two neighbors—Beijing and Tianjin, Hebei province is much less developed.
There are almost 3 million poor people living in the border areas of Hebei next to Tianjin and Beijing. Moreover, many steel and chemical plants from environmentally unfriendly industries are located in Hebei province. These facts present obvious dilemmas for environmental protection and economic development. If the government of Hebei province introduces much stricter environmental regulations, the economy will slow and poverty will increase. At the same time, as the regional economy has grown and the level of urbanization level expanded, especially for Beijing, both population and the number of private cars have increased, resulting in urban problems like traffic congestion and air pollution. During the winter of 2013, the most serious air pollution event occurred in BTHR, and was much worse than pollution problems in other regions of China. Since then, BTHR synergetic development (BTHRSD) has become an important national strategy for China, complementing The Belt and Road Initiative. BTHRSD is a kind of inter-regional blueprint designed to achieve a win-win relationship between economic growth and environmental protection in a wide area, and stimulate gradient development among different cities. Furthermore, another important task of BTHRSD is to design policies and mechanisms that improve ecological services and environmental quality within BTHR. The development of PES is a part of this effort.
Given formula (3) described by the model, to calculate NPES within BTHR, we need at least three kinds of information for each province: the number of neighbors, the value of ecological services, the extent to which local governments have taken measures to protect their ecological systems.
As for the neighbors of each province, we know that Beijing is adjacent to Tianjin and Hebei, Tianjin is adjacent to Hebei and Beijing, and Hebei borders Beijing, Tianjin, Liaoning, Mongolia, Shanxi, Henan and Shandong.
With respect to the value of ecological services, we use the amount of each type of land area, multiplying relative economic value per unit area. The amount of each type of land area within BTHR was calculated (Gong et al., 2013; Li et al., 2017), and then figures were assigned to demonstrate the distribution of different ecological systems (Table 1, Fig. 1).
Table 1 Different types of land area within BTHR
Type Code Area (ha)
Beijing Tianjin Hebei
Cropland 10 344060.73 767710.62 10597474.71
Forest 20 1098045.99 115873.02 7380781.38
Grassland 30 361561.32 157420.53 7297648.56
Shrubland 40 48787.29 1583.91 392740.47
Wetland 50 9309.60 8788.68 32632.92
Water 60 24625.89 151623.00 486923.40
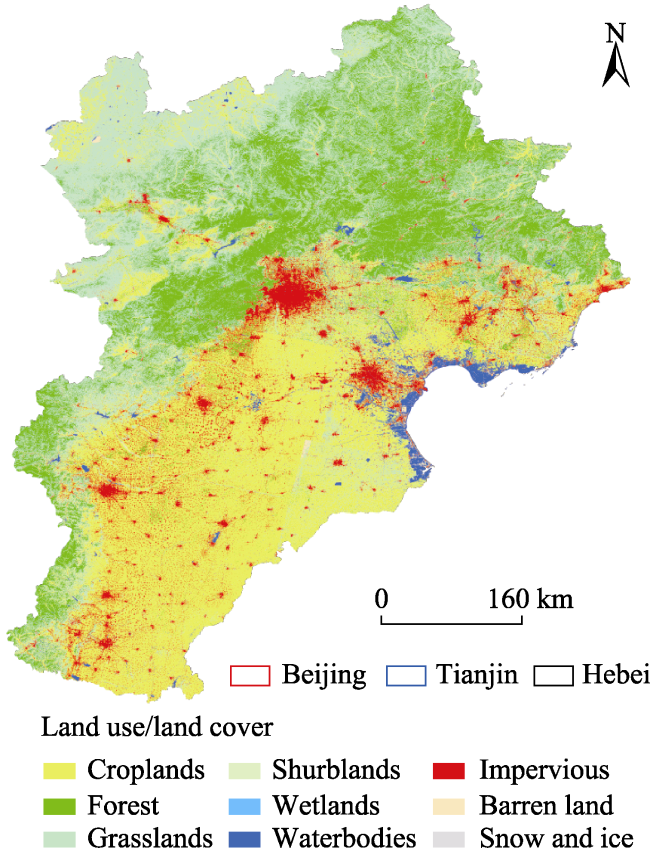
Fig. 1 Ecological system within BTHR
Many scholars have estimated the economic value of ecological services at different scales, from local to national to global scale (Table 2).
Table 2 Estimates of the economic value of ecological services
Land types Costanza et al. (1997) De Groot et al. (2012)
Cropland 579.6 N a
Forest 6104.7 11686.5b
Wetland 93145.5 161796.6c
Water 53537.4 26882.1
Shrublandd 3783.2 14886.9
Grassland 1461.6 18087.3

Note: All the values in the table are calculated using the exchange rate of US $1.00 = 6.30 Yuan; the unit is Yuan ha-1. a: Not accounted; b: Uses the original value of woodlands and does not include tropical forest and temperate forest; c: Uses the original value of inland wetlands and does not include coastal wetlands; d: Uses the mean value of forest and grassland to represent the value of shrubland.

Table 3 Two sub-indicators’ scores within BTHR (full score= 100.00)
Beijing Tianjin Hebei
Environment treatment 98.36 83.1 87.49
Ecosystem protection 70.86 64.81 72.48
Arithmetic average 84.61 73.96 79.99

Source: the 2016 evaluation results bulletin of PRC ecological civilization construction. Arithmetic averages equal to the mean scores of environment treatment and ecosystem protection.

It can be inferred from Table 2 that the estimates for the economic value of ecological services are not consistent. Scholars using different scales and methods come up with different estimates. Costanza calculated that the economic value of ecological services offered by forests is 6104.70 Yuan per ha (Costanza et al., 1997), while De Groot gave a monetary value of 11686.50 Yuan per ha for the same services (De Groot et al., 2012.
On Dec. 22, 2016, the Chinese government published the Evaluation Method for the Objectives of Ecological Civilization Construction, which stipulated that each province would have its green development status evaluated annually and its ecological civilization construction status evaluated every five years, beginning Jan. 1, 2018. On Dec. 26, 2017, the government proclaimed the first annual evaluation results for each province’s green development in 2016 The evaluation was based on the green development indicator (GDI) that was composed of 6 sub-indicators: resource usage, environment treatment, environment quality, ecosystem protection, growth quality and green life. Both the GDI and each of the 6 sub-indicators had a full score of 100. We assumed that 2 of the 6 sub-indicators, environment treatment and ecosystem protection, could be used to measure the extent to which local governments positively protected their ecological systems and natural environment.
According to formula (1), we use arithmetic averages divided by 100 to represent the extent to which local governments have taken positive measures to protect their ecosystem. From this, we find that the β values of Beijing, Tianjin and Hebei are 0.85, 0.74 and 0.80, respectively.

4 Results and conclusions

Combining formula (3) and the data above, we estimate the NPES within BTHR as follows (Table 4):
Hebei’s ESV is much higher than those of Beijing and Tianjin, regardless of which estimates for the economic value of ecological services. Tianjin’s ESV is the lowest among the three provinces within BTHR. According to the China Statistical Yearbook 2017, Beijing, Tianjin and Hebei’s gross regional products (GRP) were 2.57×10¹² Yuan, 1.78×10¹² Yuan, and 3.21×10¹² Yuan, respectively, in 2016. Table 4 shows that NPES between Beijing and Tianjin was 2.04×10⁹ Yuan, and that Tianjin should pay the PES to Beijing. NPES between Beijing and Hebei was 12.48×10⁹ Yuan, and that Beijing should pay the PES to Hebei. NPES between Tianjin and Hebei was 14.52×10⁹ Yuan, and Tianjin should also pay the PES to Hebei. We can conclude from table 4 that, in 2016, Beijing and Tianjin should pay the NPES to Hebei, 10.44×10⁹ Yuan (12.48 minus 2.04, 0.4% of Beijing’s GRP) and 16.56×10⁹ Yuan (14.52 plus 2.04, 0.93% of Tianjin’s GRP), respectively.
Table 4 NPES within BTHR
Regions M ESV β
Beijing 2 16.13 0.85
Tianjin 2 10.25 0.74
Hebei 7 170.53 0.80
NPESB-T 2.04 (Tianjin to Beijing)
NPESB-H 12.48 (Beijing to Hebei)
NPEST-H 14.52 (Tianjin to Hebei)

Note: The values of ESV or NPES are shown in 109 Yuan; the economic value of ecological services equals the mean of the estimates of Costanza et al. (1997) and De Groot et al. (2012) in Table 2.

In order to safeguard the water supply for Beijing and Tianjin and prevent it from being degraded by wind-carried sand, Hebei made robust efforts in the areas of water resources allocation, and ecosystem and environmental protection, implementing strict environmental policies and regulating the spatial distribution of industrial facilities, which together had, to a certain degree, a negative effect on the province’s economic development. Since the year 2000, the city of Zhangjiakou in Hebei has closed more than 400 polluting firms and asked almost 280 more firms to stop operations to further abate the emission of pollutants. Moreover, Zhangjiakou has not given approval to more than 800 new investment projects during this period. As a result, one billion Yuan in profits and tax revenue was lost annually.
Fortunately, due to proposals and promotions by the Chinese central government, there have been several positive attempts at PES within BTHR, including the project to treat BTHR dust sources, the Saibei woodland project, the Green for Grain Project, the plan for sustainable utilization of capital water resources at the beginning of the 21st century (2001-2005), and the plan to prevent pollution and improve water quality of the Haihe river, to name some of the efforts. Additionally, Beijing cooperated with and paid PES to Zhangjiakou and Chengde to assist with water conservation, water pollution control, and small river treatment. Actually, these positive measures have been very helpful in purifying water sources that are used to supply Beijing and Tianjin. These efforts have improved ecosystems and substantially reduced damage caused by wind and dust.
However, in examining all of these efforts and practices, we can identify problems with PES in BTHR that still need to be resolved.
Firstly, there are no formal laws, regulations or rules for PES, and there is no agency specifically tasked to focus on PES related issues. The State Council of China issued The Instructions about Improving PES Mechanisms in April of 2016, a document which emphasized the importance of horizontal PES. Since then, many local governments started to develop PES mechanisms at the local level. For example, Tianjin published The Implementation Instructions for Improving PES Mechanisms on June 20, 2017. As far as the nature of these instructions is concerned, whether they were issued at the central or local government level, they are not laws or regulations setting statutory requirements. Generally speaking, the Ministry of Ecology and Environment (MEE), and committee of BTHRSD should be in charge of PES related issues, but because these government bodies already have many duties and responsibilities, they can seldom allocate sufficient time and human resources to implement and supervise PES in practice.
Secondly, most current PES practices are connected with specific domains, like water resources, forest, or air pollution; they are not broadly defined for application to all PES projects. The amounts of PES, which have already been paid by Beijing and Tianjin to Hebei, are too low without creating enough incentives for ecosystem protection. For example, although much of the water supply of Beijing and Tianjin comes from the two Hebei cities of Chengde and Zhangjiakou, they only received 12 million Yuan from Beijing for the pollution abatement of small rivers during the period of 1996-2004, 202 million Yuan from Beijing during the years 2005-2009 and 80 million Yuan from Tianjin during 2008- 2011 for water quality maintenance and water pollution mitigation. Besides, Hebei’s forest area increased from 3.44 million ha in 1990 to 7.05 million ha in 2012 mainly as a result of the Grain for Green Project. This effort has been very helpful in controlling the sources of wind and sand that affect Beijing and Tianjin. However, during this entire time period, the PES was implemented according to administrative divisions and Hebei could not receive any payments from Beijing or Tianjin. As a result, due to the limited size of its economy and budget constraints, Hebei could not provide adequate financial subsidies to the involved parties. Also during this time period, the central government budgeted 5×10⁹ Yuan to address serious fog and haze pollution problems within BTHR and asked BTHR to develope inter-regional prevention and control mechanism. As part of this effort, Hebei needed to complete the 6643 Project, which called for reducing pressure and limiting product. Actually, a single part of the 6643 Project, like cutting 60 million tons of steel product capacity, would cause Hebei’s GDP to decease by more than 51×109 Yuan.
Finally, the measures for PES lack a long-term perspective or mechanisms. In the future, we need to strengthen the research on Mi for improving the NPES model. To date, the PES measures in BTHR include projects of limited time duration, such as the Grain for Green Project and the rice for dry land project. Local residents receive some PES benefits and will, of course, try their best to comply with the measures to protects local ecosystems for the duration of the PES projects. However, once these projects come to an end, local residents will lose an important income source and need to find alternatives that may involve producing goods and services locally and result in degradation of the natural environment.

The authors have declared that no competing interests exist.

[1]
Claassen R, Cattaneo A, Johansson R, et al. 2008. Cost-effective design of agri-environmental payment programs: U.S. experience in theory and practice. Ecological Economics, 65: 737-752.

[2]
Coase R H, 1960. The problem of social cost.The Journal of Law and Economics, 3: 1-44.

[3]
Costanza R, D’Arge R, Groot R D, et al.1997. The value of the world’s ecosystem services and natural capital.Nature, 387: 253-260.

[4]
Costanza R, Groot R D, Braat L, et al.2017. Twenty years of ecosystem services: How far have we come and how far do we still need to go?Ecosystem Services, 28: 1-16.

[5]
Engel S, Pagiola S, Wunder S.2008. Designing payments for environmental services in theory and practice: An overview of the issues.Ecological Economics, 65: 663-674.

[6]
Gong Peng, Wang Jie, Yu Le, et al.2013. Finer resolution observation and monitoring of global land cover: first mapping results with Landsat TM and ETM+ data.International Journal of Remote Sensing, 34: 2607-2654.

[7]
Groot R D, Brander R, Ploeg S V D, et al. 2012. Global estimates of the value of ecosystems and their services in monetary units. Ecosysetm Services, 1: 50-61.

[8]
Huang Huabing, Chen Yanlei, Clinton N, et al.2017. Mapping major Land cover dynamics in Beijing using all Landsat images in Google Earth Engine.Remote Sensing of Environment, 202: 166-176.

[9]
JU Xuehai, XUE Yinghao, XI Bin, et al.2018. Establishing an agro- ecological compensation mechanism to promote agricultural green development in China.Journal of Resources and Ecology, 9(4): 426-433.

[10]
Kalacska M, Sanchez-Azofeifa G A, Rivard B, et al.2008. Baseline assessment for environmental services payments from satellite imagery: A case study form Costa Rica and Mexico.Journal of Environment Management, 88: 348-359.

[11]
Li Congcong, Gong Peng, Wang Jie, et al.2017. The first all-season sample set for mapping global land cover with Landsat-8 data.Science Bulletin, 62: 508-515.

[12]
Li Wenhua, Liu Moucheng.2010. Several strategic thoughts on China’s eco-compensation mechanism,Resource Science. 32, 791-796. (in Chinese)

[13]
Lin Yongsheng, Zheng Yaomin, Zong Xue.2017. Ecological compensation baseline of alpine wetland in the Chinese Zoige Plateau.Journal of Beijing Normal University (Natural Science), 53(1): 105-110. (in Chinese)

[14]
Niu Zhenguo, Zhang Haiying, Gong Peng.2011. More protection for China’s wetlands.Nature, 471: 305.

[15]
Niu Zhenguo, Zhang Haiying, Wang Xianwei, et al.2012. Mapping wetland changes in China between 1978 and 2008.Chinese Science Bulletin, 57: 2813-2823.

[16]
Ouyang Zhiyun, Zheng Hua, Xiao Yi, et al.2016. Improvements in ecosystem services from investments in natural capital.Science, 352: 1455-1459.

[17]
Schomers S, Matzdorf B.2013. Payments for ecosystem services: A review and comparison of developing and industrialized countries. Ecosystem Services, 6: 16-30.

[18]
Sommerville M M, Jones J P G, Milner-Gulland E J.2009. A revised conceptual framework for payments for environmental services.Ecology and Society, 14: 34.

[19]
Song Xiaopeng.2018. Global estimates of ecosystem service value and change: Taking into account uncertainties in satellite-based land cover data.Ecological Economics, 143: 227-235.

[20]
WANG Jiaran, LIU Moucheng, YANG Lun, et al.2018. Factors affecting the willingness of farmers to accept eco-compensation in the Qianxi Chestnut Agroforestry System, Hebei.Journal of Resources and Ecology, 9(4) : 407-415.

[21]
WEN Yihui, LIU Guihuan, WU Rui.2018. Eco-compensation in Guanting Reservoir Watershed Based on Spatiotemporal Variations of Water Yield and Purification Services.Journal of Resources and Ecology, 9(4): 416-425.

[22]
Wunder S, Engel S, Pagiola S.2008. Taking stock: A comparative analysis of payments for environmental services programs in developed and developing countries.Ecological Economics, 65: 834-852.

[23]
Wunder S.2005. Payments for environmental services: Some nuts and bolts. Bogor, Indonesia: Center for International Forestry Research, 42: 24.

[24]
Wunder S.2015. Revisiting the concept of payments for environmental services.Ecological Economics, 117: 234-243.

[25]
Xu Weihua, Xiao Yi, Zhang Jingjing, et al.2017. Strengthening protected areas for biodiversity and ecosystem services in China.Proceedings of the National Academy of Sciences, 114: 1601-1606.

[26]
YANG Lun, LIU Moucheng, MIN Qingwen, et al.2018. Transverse eco-compensation standards for water conservation: A case study of the middle route project of south-to-north water diversion in China.Journal of Resources and Ecology, 9(4): 395-406.

[27]
Zheng Yaomin, Niu Zhenguo, Gong Peng, et al.2012. Protection efficacy of national wetland reserves in China.Chinese Science Bulletin, 57: 1116-1134.

[28]
Zheng Yaomin, Niu Zhenguo, Gong Peng, et al.2015. A database of global wetland validation samples for wetland mapping.Science Bulletin, 4: 428-434.

Outlines

/